Monetary Policy Report submitted to the Congress on February 15, 2006, pursuant to section 2B of the Federal Reserve Act
Section 2
ECONOMIC AND FINANCIAL DEVELOPMENTS IN 2005 AND EARLY 2006
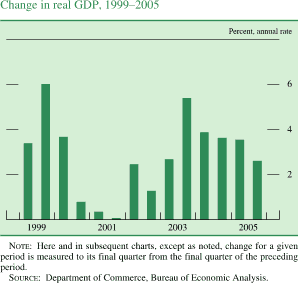
The economic expansion remained firmly entrenched in 2005, although the growth of real GDP late in the year was apparently restrained by the effects of the hurricanes and by sharp drops in some volatile categories of spending. In the labor market, payroll employment rose moderately for a second year in a row, and the unemployment rate declined further. As in 2004, headline inflation was boosted appreciably by soaring energy prices; however, core inflation remained subdued. In 2005, financial market conditions were once again supportive of growth, with long-term market interest rates low and credit spreads and risk premiums narrow.
The Household Sector
Consumer Spending
Consumer spending had gathered considerable steam in 2003 and 2004 and remained vigorous in 2005. Higher energy prices last year continued to siphon off household purchasing power, and short-term interest rates moved up; nevertheless, spending was again bolstered by an improving labor market and rising household wealth.
Real personal consumption expenditures (PCE) had posted back-to-back increases of 3-3/4 percent in 2003 and 2004 and continued to rise at about that pace over the first three quarters of 2005; in the fourth quarter, PCE growth slowed to an annual rate of just 1 percent as consumer outlays for motor vehicles slackened after a surge prompted by last summer's "employee discount" programs. For 2005 as a whole, sales of light vehicles (cars, vans, sport-utility vehicles, and pickup trucks) totaled nearly 17 million units, about the same as the annual figure for 2004. Real spending on consumer goods other than motor vehicles was robust in 2005, with substantial gains almost across the board; a notable exception was real spending on gasoline, which was up only modestly for a second year in a row as prices at the pump soared. Real expenditures on services rose moderately in 2005, as a sizable further increase in outlays for medical care was partly offset by a relatively small gain in outlays for energy services.
Excluding the estimated effects of the one-time special dividend payment that Microsoft made in December 2004, disposable personal income (DPI)--that is, personal income less personal current taxes--rose about 1-1/2 percent in real terms in 2005, considerably less than in 2003 and 2004. Although aggregate wages and salaries advanced moderately last year and some other major types of nominal income posted notable gains, the increases in real terms were eroded by the rise in energy prices. In addition, personal tax payments rose faster last year than did personal income as measured in the national income and product accounts (NIPA). In the second half of the year, the growth of real DPI was volatile, mainly because of the hurricanes. Rental income and proprietors' income were pulled down in the third quarter as a result of uninsured losses on residential and business property. Real DPI snapped back in the fourth quarter as income in these hurricane-affected categories rebounded from the exceptionally low levels in the third quarter.
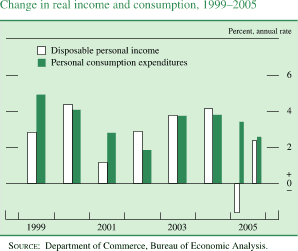
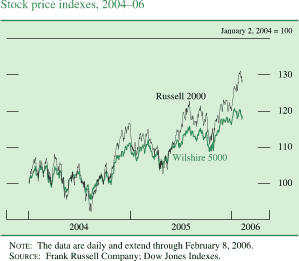
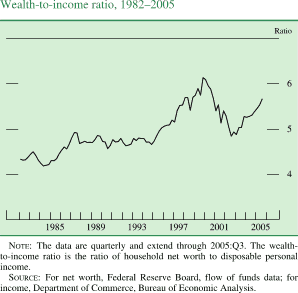
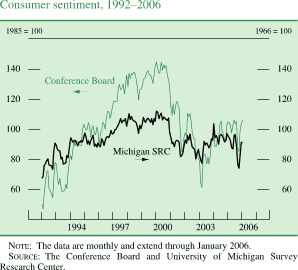
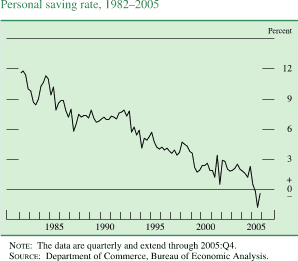
Although the run-up in energy prices restrained the growth of real DPI in 2005, its effect on overall spending appears to have been largely offset by other factors. In particular, sharp increases in household wealth since 2002 have provided many households with the resources and inclination to sustain their spending through a period of relatively weak growth of real income. Household net worth, which typically feeds through to spending over several quarters, posted sizable gains in 2003 and 2004, and it rose further in 2005 as house values continued to climb and as stock prices moved modestly higher. At the end of the third quarter (the most recent period for which complete data on wealth are available), the ratio of household net worth to disposable income stood at 5.65, well above its long-run average level of 4.75. Meanwhile, surveys by the Michigan Survey Research Center (SRC) and the Conference Board suggest that, apart from the first few months after the hurricanes, consumer confidence was about at the favorable levels that had prevailed in 2004. All in all, personal outlays exceeded disposable income in 2005. As a result, the personal saving rate, which had dropped below 2 percent in 2004, fell further in 2005, ending the year at negative 1/2 percent.
Residential Investment
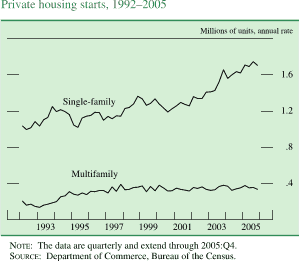
Activity in the housing sector remained torrid through much of 2005. By the end of the year, however, a few tentative signs of cooling had begun to appear. In the single-family sector, starts of new units dipped in December after a string of exceptionally strong months; still, they totaled 1.7 million for the year as a whole--6-1/2 percent above the already rapid pace in 2004. Starts in the multifamily sector totaled 350,000 in 2005, a pace similar to that of the preceding three years. Real expenditures on residential structures--which include outlays not only for new construction but also for additions and alterations as well as commissions paid to real estate agents--rose nearly 8 percent in 2005, the fourth large yearly increase in a row.
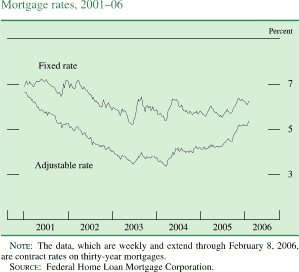
Sales of both new and existing homes set records in 2005, although they, like housing starts, seem to have lost some steam late in the year. Rates on thirty-year fixed-rate mortgages were in the neighborhood of 5-3/4 percent for much of the year, but they rose in the autumn. Since October, they have averaged close to 6-1/4 percent, at the upper end of the narrow range that has prevailed since 2003 but still fairly low by historical standards. Rates on adjustable-rate mortgages have been trending up since early 2004. The softening of home sales in recent months has contributed to an updrift in the stock of unsold new and existing homes. As of December, the stock of unsold new homes was equal to nearly five months of supply when measured at that month's sales pace. Between 1998 and 2004, the stock of unsold new homes had averaged about four months of supply.
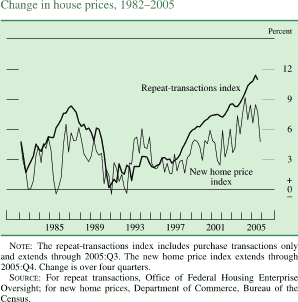
Measures of house prices that attempt to control for shifts in the quality and composition of homes sold show that prices continued to rise rapidly through the third quarter of 2005, though partial data for the fourth quarter point to some slowing. Notably, the purchase-only version of the repeat-transactions price index for existing homes, which is published by the Office of Federal Housing Enterprise Oversight and tracks sales of the same houses over time, rose 11 percent over the year ending in the third quarter (the latest available data), once again outstripping the increases in household incomes and rents. The Census Bureau's constant-quality price index for new homes, which controls for changes in the composition of sales by geography, home size, and other readily observable characteristics, had also shown sizable increases through the third quarter, but it decelerated sharply in the fourth quarter and was up just 4-3/4 percent over 2005 as a whole; in 2004, this measure had risen 8-1/2 percent.
Household Finance
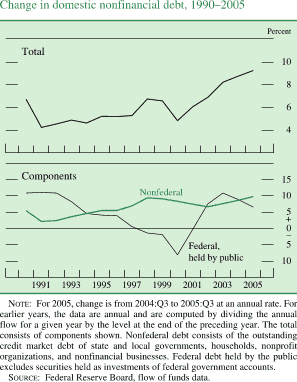
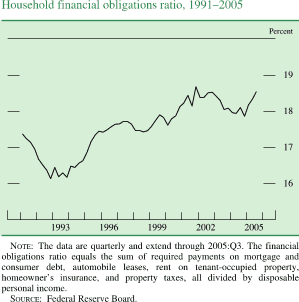
Household debt expanded about 10-1/2 percent at an annual rate over the first three quarters of last year, roughly the same brisk pace as had been registered in 2004. Home-mortgage debt continued to grow rapidly, as homeowners took advantage of the further sizable increases in house prices last year. The use of alternative mortgage products spread further in 2005, in part because rising home values generally made house purchases less affordable. Last May federal regulators issued guidance promoting sound risk-management practices to financial institutions with home equity lending programs. Mortgage-related borrowing likely took the place of some funding with consumer credit, which expanded only modestly again last year. Overall, the expansion in household debt outpaced the growth in disposable personal income, and the financial obligations ratio moved up to a level close to the peak that it had reached earlier this decade. However, the relatively low readings on most measures of loan delinquencies last year indicate that most households were not struggling to meet their obligations.
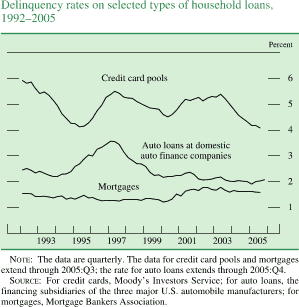
A large number of households filed for bankruptcy in the weeks leading up to October 17, the date when a new bankruptcy law took effect. The law was designed in part to diminish the ability of households to discharge their debts through chapter 7 filings. After the new law became effective, filings fell sharply to a level significantly below the average of recent years, and they have since remained low. This suggests that, to avoid the new rules, some households accelerated filings they would have undertaken eventually even under the old law. The spike in bankruptcies appears to have induced a jump in charge-offs of consumer loans in the fourth quarter.
The Business Sector
Fixed Investment
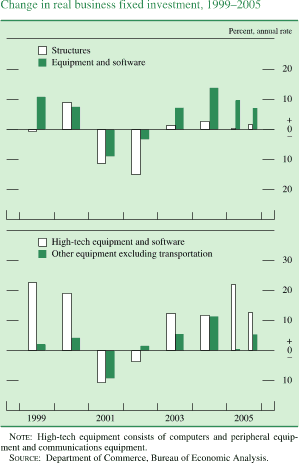
Real business fixed investment rose 6-1/2 percent in 2005. Real spending on equipment and software (E&S) posted an increase of more than 8 percent after rising nearly 14 percent in 2004. The broadly based growth in E&S spending last year was supported by favorable fundamentals: appreciable growth in final sales, ample financial resources in the corporate sector, and supportive conditions in financial markets.
Real investment in high-technology equipment rose 17 percent in 2005, as further declines in prices provided a substantial incentive for firms to step up their outlays on such items; the increase was 5 percentage points faster than in 2003 and 2004 and about in line with the average annual gain over the past twenty-five years. Spending on communications equipment was exceptionally strong last year, as telecom service providers rolled out major new fiber-optic systems and third-generation wireless gear. Business spending for computing equipment rose roughly 30 percent in real terms, a pace close to its historical average, while spending on software posted its largest increase in several years.
Although aircraft investment remained depressed as domestic airlines continued to grapple with overcapacity and soaring fuel prices, the other major categories of E&S spending outside the high-tech area did well in 2005. Business outlays on motor vehicles rose markedly, with the demand for heavy trucks especially strong. Investment in equipment other than high-tech and transportation goods--a broad category that accounts for nearly half of E&S spending when measured in nominal terms--barely rose in real terms over the first half of 2005. Investment in this category sped up after midyear, to increase moderately over the year as a whole.
Apart from the drilling and mining sector, where investment has strengthened in response to higher energy prices, outlays for nonresidential construction have yet to gain much traction. Spending on office and commercial structures has been essentially flat since 2003; construction of manufacturing facilities leveled out in 2005 after having firmed in late 2004; and investment in the power and communications sector moved down further last year. However, vacancy rates have continued to reverse some of the run-up that occurred between 2000 and 2003, and some industry reports suggest that an upturn in building activity is in train.
Inventory Investment
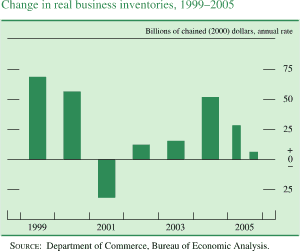
After having been exceptionally restrained earlier in the economic expansion, inventory investment picked up sharply in 2004, and the higher pace of accumulation extended into early 2005. The step-up in accumulation, which provided considerable impetus to industrial production for a time, brought stocks into better alignment with sales and set the stage for a subsequent downswing in inventory investment. Inventories in the motor vehicle sector were drawn down in both the second and third quarters, though accumulation resumed in the fourth quarter after last summer's surge in sales cleared out dealers' lots. Apart from motor vehicles, real stockbuilding slowed sharply over the course of the year and, according to the advance NIPA estimate, came to a halt in the fourth quarter. At year-end, inventories seemed to be in reasonable alignment with sales, even taking into account the downward trend in inventory-sales ratios that has resulted from the ongoing improvement in supply-chain management.
Corporate Profits and Business Finance
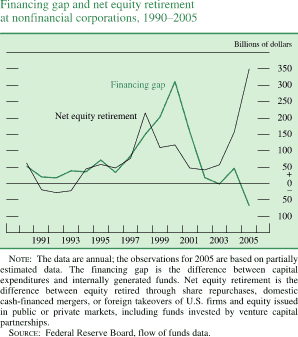
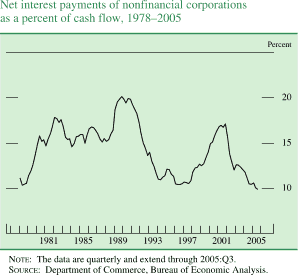
With profits posting further solid gains in 2005 and ample liquid assets on corporate balance sheets, nonfinancial businesses were able to finance much of their capital expenditures out of internal funds, pay record sums to shareholders in the form of share buybacks, and still maintain strong balance sheets. Nonetheless, elevated merger and acquisition activity and the considerable rise in share buybacks boosted the pace of business borrowing. Short-term borrowing rose significantly, driven by financing from banks. The issuance of long-term debt remained moderate overall, but debt related to commercial mortgages continued to expand rapidly. Indicators of corporate credit quality generally remained favorable.
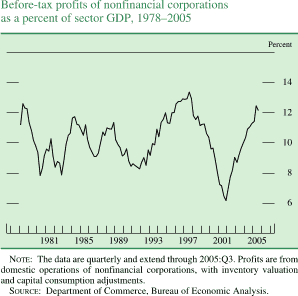
Corporate profits continued to grow strongly in 2005. The ratio of before-tax profits of domestic nonfinancial corporations to that sector's gross value added rose to more than 12 percent, near its 1997 peak. Gains in earnings were fairly widespread, with profits in the petroleum and gas industries especially strong. In the fourth quarter of 2005, operating earnings per share for S&P 500 firms appear to have been nearly 14 percent above their level four quarters earlier.
Gross equity issuance remained modest in 2005, while net equity issuance sank into deeply negative territory as corporations retired shares at a rapid pace. Both a jump in cash-financed mergers and a record-setting level of share repurchases were spurred by the strong growth of profits as well as by the substantial liquidity that firms had built up in recent years.
Net corporate bond issuance was subdued in 2005, as modest growth in nominal capital expenditures, strong cash positions, and robust profits apparently limited the demand for such financing. However, commercial-mortgage debt grew rapidly last year. Gross issuance of commercial-mortgage-backed securities likely reached a record pace in the fourth quarter.
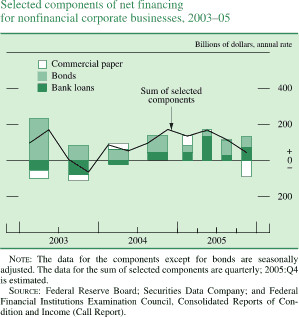
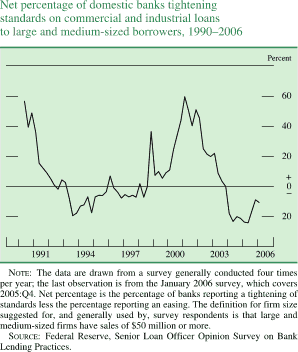
Short-term borrowing by businesses rose smartly in 2005, as business lending by both large and small commercial banks surged. Throughout the year, respondents to the Senior Loan Officer Opinion Surveys indicated that their institutions had further eased standards and terms for lending to businesses and that the demand for such loans had continued to strengthen. Most respondents attributed the stronger demand to borrowers' increased need to finance inventories, accounts receivable, and investment in plant and equipment; a substantial fraction of respondents to some surveys also pointed to a pickup in merger and acquisition activity. By contrast, outstanding commercial paper declined last year.
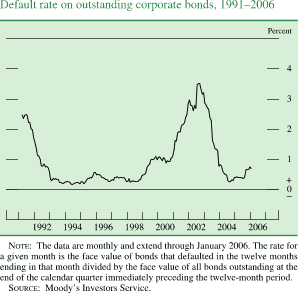
Readings on credit quality for nonfinancial companies generally remained favorable in 2005 despite some pockets of distress. The amount of corporate debt that was downgraded by Moody's Investors Service last year exceeded the amount that was upgraded, mainly as a result of the high-profile downgrades of the debt of General Motors and Ford. After trending down over the first three quarters of last year, the six-month trailing bond default rate moved up in the fall, most notably because of the bankruptcies of Delta Air Lines, Northwest Airlines, Delphi, and Calpine. However, these bankruptcies were widely anticipated and had little effect on other measures of aggregate credit quality. The credit quality of commercial mortgage debt also appeared to remain robust during 2005; delinquency rates on commercial mortgages held by banks and on those pooled into securities trended down on balance over last year, while delinquencies on mortgages held by insurance companies remained low.
The Government Sector
Federal Government
The deficit in the federal unified budget narrowed appreciably in fiscal year 2005. Although outlays continued to rise rapidly, receipts rose even faster; as a consequence, the deficit fell to $318 billion, roughly $100 billion less than the deficit in fiscal 2004. The latest projections from the Administration and the Congressional Budget Office, however, point to a deterioration in the unified budget position in fiscal 2006, in part because of the start of the Medicare drug benefit and the need to pay for post-hurricane reconstruction and relief.
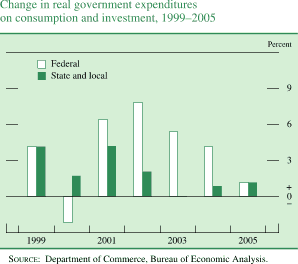
Nominal federal spending rose nearly 8 percent in fiscal 2005 and stood at about 20 percent of GDP--virtually the same as in 2003 and 2004 but 1-1/2 percentage points above the recent low in fiscal 2000. Defense spending rose 8-1/2 percent after three years of double-digit increases; outlays for nondefense discretionary programs moved up further as well, in part because of higher spending for education and for disaster relief. (Spending on disaster relief in fiscal 2005, which ended on September 30, was primarily for needs that emerged before Hurricane Katrina.) As for the major health programs, Medicare outlays continued to climb. Medicaid spending rose relatively slowly, mainly because it had been boosted during much of fiscal 2004 by the temporary increase in the federal share of the program's costs included in the Jobs and Growth Tax Relief Reconciliation Act of 2003 (JGTRRA). Net interest payments, which had declined steadily from 1998 to 2003 and had increased only moderately in 2004, were up significantly in fiscal 2005 as short-term interest rates rose. Thus far in fiscal 2006, outlays have continued to rise rapidly, in part because of heavy spending for flood insurance payouts and other hurricane-related disaster relief. According to the NIPA, real federal expenditures on consumption and gross investment, the part of government spending that is a component of real GDP, increased 1-1/4 percent over the four quarters of calendar year 2005.
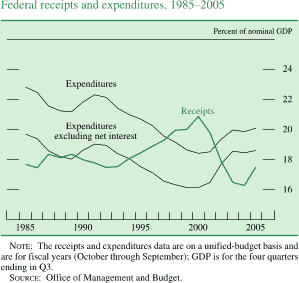
Federal receipts rose 14-1/2 percent in fiscal 2005; as a ratio to GDP, they stood at 17-1/2 percent--more than 1 percentage point higher than in 2004. Corporate payments rose nearly 50 percent, lifted by the robust profits of 2004 and 2005 and the termination of the partial-expensing tax incentive at the end of calendar 2004. Individual income taxes increased nearly 15 percent; nonwithheld taxes rose especially rapidly because of both substantial strength in nonwage taxable incomes (including capital gains) and certain features of JGTRRA that altered the timing of tax payments in a way that temporarily reduced the level of collections in 2004. Social insurance taxes rose in line with wages and salaries.
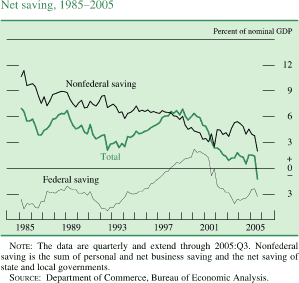
Mirroring the narrowing of the unified deficit, federal saving (essentially, the unified surplus or deficit adjusted to conform to the accounting practices followed in the NIPA) improved from negative 3-1/2 percent of GDP in calendar 2004 to negative 2-1/2 percent in the first half of 2005. However, the beneficial effect of the smaller deficit in terms of national saving was essentially offset by a sharp decline in personal saving. Measured net of estimated depreciation, national saving in the first half of 2005 was equal to just 1-1/2 percent of GDP, about the same as in 2004 and well below the recent highs of more than 6 percent of GDP in the late 1990s. In the third quarter, net saving was dragged down by sizable hurricane-related reductions in both federal and nonfederal net saving; excluding these one-time factors, net saving in the third quarter would have been roughly the same as it was in the first half of the year. If not reversed over the longer haul, persistent low levels of saving will necessitate either slower capital formation or continued heavy borrowing from abroad, either of which would hamper the ability of the nation to cope with the retirement needs of the baby-boom generation and would retard the growth of the standard of living.
Federal Borrowing
Borrowing by the Treasury moderated somewhat in calendar year 2005--federal debt rose 7 percent last year after increasing 9 percent in 2004. Much of the improvement reflected the surge in tax receipts noted earlier. As a result, the amount of Treasury bills outstanding contracted on net in 2005, and Treasury sales of coupon securities declined. As was widely anticipated, the Treasury announced in August that it would resume regular semiannual issuance of a thirty-year nominal bond. The first such auction, held on February 9, 2006, was well received, with a high level of participation from indirect bidders. The Treasury expects issuance of the thirty-year bond to help stabilize the average maturity of outstanding marketable Treasury debt, which declined from a high of about seventy months at the end of 2000 to fifty-three months at the end of 2005.
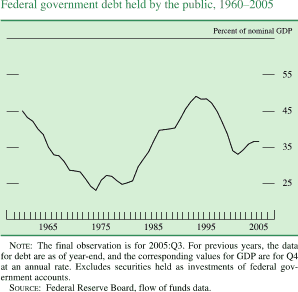
Federal debt held by the public as a percentage of nominal GDP was steady during 2005 and stood at about 36 percent at the end of the third quarter. The federal debt ceiling did not need to be raised last year, but the Treasury has announced that it expects that the debt will reach its statutory ceiling in February 2006.
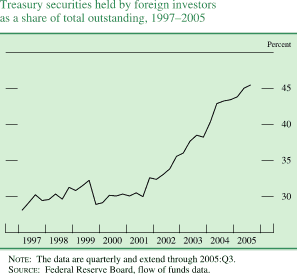
The appetite for Treasury securities among foreign investors remained strong in the aggregate in 2005. The proportion of outstanding Treasury securities held by foreign investors is estimated to have climbed to slightly more than 45 percent in the third quarter of 2005, a record. Data from the Treasury International Capital reporting system suggest that net purchases of Treasury securities by foreign private investors jumped last year, whereas such purchases by foreign official institutions slowed significantly amid upward pressure on the foreign exchange value of the dollar.
State and Local Governments
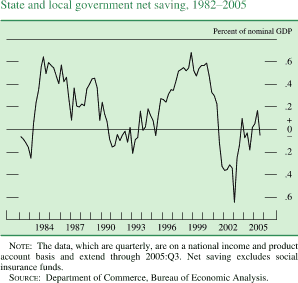
The fiscal positions of state and local governments continued to improve in 2005. Strong growth in income and retail sales boosted revenues, as did rising property values. And although the sector continued to grapple with higher medical costs and pressures to restore funding to programs that had been cut back earlier in the decade, states and localities generally kept a tight rein on current outlays. On a NIPA basis, net saving by state and local governments--which is broadly similar to the surplus in an operating budget--turned positive in the first half of 2005 after having been negative between 2002 and 2004, and it would have remained positive in the third quarter in the absence of the hurricanes. The sizable revenue gains reported by many states in fiscal 2005, which ended on June 30 in all but four states, appear to have extended into fiscal 2006. Even so, some governments are still struggling with strained fiscal situations, and some face significant structural imbalances in their budgets that likely will be exacerbated in coming years by the need to provide pensions and health care to a growing number of retired employees. In addition, the jurisdictions in the Gulf Coast region confront the dual challenge of substantial post-hurricane demands and diminished flows of tax revenues.
According to the NIPA, real expenditures on consumption and gross investment by state and local governments rose 1-1/4 percent in 2005. Real outlays for current consumption were up only about 1 percent for a second year, in part because of the relatively slow pace of hiring. Real investment expenditures also registered a small gain.
State and Local Government Borrowing
Borrowing by state and local governments picked up in 2005. Gross issuance of municipal securities was brisk, as the relatively low level of longer-term market interest rates spurred advance refundings of outstanding securities. The bulk of new capital issues last year reportedly was earmarked for education-related projects. Credit quality in the state and local sector generally remained favorable in 2005. Notable exceptions were the obligations of numerous municipal issuers in Michigan, which were downgraded last year largely as a consequence of the difficulties of GM and Ford. In addition, the obligations of a number of issuers in the regions that were hit by last year's hurricanes were downgraded in the fourth quarter, and some bonds from these areas remain on watch. Despite these isolated troubles, rating upgrades of municipal bonds slightly outpaced downgrades in 2005.
The External Sector
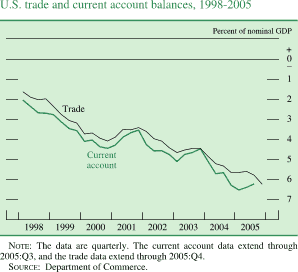
The U.S. current account deficit widened further in 2005. At an annual rate, it came in at just under $800 billion, or about 6-1/4 percent of nominal GDP, in the first three quarters (the latest available data). As in the past, a substantial portion of the widening of the current account deficit came from a larger deficit on trade of goods and services, but a decrease in net investment income also worsened the external account. Net investment income edged into negative territory in the second quarter of 2005 for the first time in the post-World War II period. Unilateral transfer payments to foreigners dropped sharply on net in the third quarter because of a surge in receipts from foreign insurance companies for damage caused by the hurricanes, leading to a slight narrowing of the deficit from the previous quarter. The trade data through December showed that the U.S. trade deficit widened further in the fourth quarter of 2005, to about $790 billion at an annual rate. This increase suggests that the fourth-quarter current account deficit, yet to be reported, will also widen substantially.
International Trade
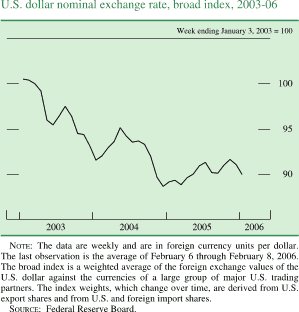
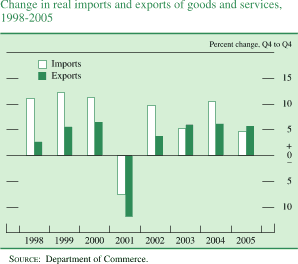
Real exports of goods and services continued the solid pace of expansion registered in both 2003 and 2004; they rose an estimated 5-3/4 percent in 2005, supported by robust foreign economic activity. Export growth was rapid in the first half of the year, spurred by the depreciation of the dollar in previous years; it then slowed in the second half of the year, in part owing to the dollar's appreciation since the beginning of 2005. For the year as a whole, exports of capital goods posted solid growth. Exports of aircraft performed especially well despite an interruption of their production in September because of a strike at Boeing. Exports of industrial supplies were hampered late in the year by the effects of the hurricanes on production and shipping in the Gulf Coast region. By destination, exports to Canada and Mexico grew rapidly in 2005, those to Western Europe also increased, but exports to Japan were relatively weak. Exports of services rose about 3 percent in 2005 in real terms.
Prices of exported goods increased at an annual rate of 2-3/4 percent in 2005, a bit below the rate of increase in 2004. Prices decelerated in the second and third quarters as the dollar strengthened and as pressures on prices of agricultural exports and other nonfuel commodities ebbed. Prices accelerated again in the fourth quarter, when a sharp rise in the prices of oil and metals drove up prices for many nonagricultural industrial supplies.
After expanding at a double-digit pace in 2004, real imports of goods and services decelerated to about 4-1/2 percent in 2005, even as U.S. GDP growth remained robust. Although overall growth of non-oil imports was slower last year than in 2004, capital goods imports continued strong. The hurricanes affected several categories of imports. Despite a contraction of domestic oil consumption, real imports of oil expanded to offset reduced production in the Gulf Coast region. Chemicals imports also registered strong gains toward year-end amid hurricane-related losses in domestic production. Real imports of services moved up only 2-1/4 percent in 2005, a substantial cooling from their 2004 pace.
Prices of imported goods excluding oil and natural gas increased at an annual rate of 1-1/2 percent in 2005, down from a rate of 2-3/4 percent in 2004. Prices decelerated in midyear as the dollar appreciated and nonfuel commodity prices steadied. However, import prices accelerated in the fourth quarter of 2005, led by higher prices for chemicals, metals, and building materials. In global commodity markets, prices of metals increased an average of 30 percent in 2005, a surge that reflected both robust global demand and limited increases in supply.
A key event in 2005 was the substantial increase in the price of crude oil. The spot price of West Texas intermediate (WTI) crude oil climbed from about $43 per barrel at the start of 2005 to a peak of about $70 per barrel in late August, at the time of Hurricane Katrina. The spot price then edged down as production revived in the Gulf of Mexico and as above-average temperatures in the United States reduced oil demand. After falling to below $60 per barrel by late November, oil prices moved up to an average of about $65 per barrel for January, in part on concerns about possible disruptions of foreign supply. However, oil prices have declined so far in February. Growing conviction among traders that oil-market conditions would remain tight in future years pushed the price of the far-dated NYMEX oil futures contract (currently for delivery in 2012) from an average of $38 per barrel for January 2005 to about $61 per barrel for January 2006.
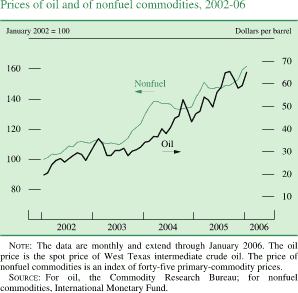
Although the rate of growth in world oil consumption slowed in 2005 from its torrid pace of 2004, spare production capacity among OPEC members remained limited, at an estimated level of only about 1 million barrels per day. With the perception that additional capacity would be slow to come on line, oil markets were highly sensitive to news about fluctuations in supply and demand. Market participants' concerns about crude oil supply were heightened by production difficulties in Iraq and by the resumption of nuclear activities in Iran, both posing risks to the stability of Middle East supply. Elsewhere, production problems in Nigeria stemming from social unrest and a marked slowdown in the growth of Russian production also kept upward pressure on oil prices throughout the year.
Domestic crude oil supply was severely hampered by last year's hurricanes, which were the most damaging in the history of the U.S. energy industry. At the peak of the disruption, all U.S. crude oil production in the Gulf of Mexico (about 28 percent of total U.S. production) and 88 percent of U.S. natural gas production there (about 17 percent of total U.S. production) were shut in. At the end of January 2006, 25 percent of Gulf oil production remained shut in, and cumulative lost production in the Gulf stood at about 22 percent of the average annual output from that region. Refinery outages, which peaked after Hurricane Rita at more than one-fourth of total U.S. refining capacity, caused sharp increases in the prices of refined products. Retail gasoline prices in the United States jumped to more than $3 per gallon in early September, briefly crimping gasoline demand and, in turn, demand for crude oil. Petroleum product prices returned to pre-hurricane levels within a few weeks as imports soared and refineries resumed operations, but they began to rise again in December and January.
The Financial Account
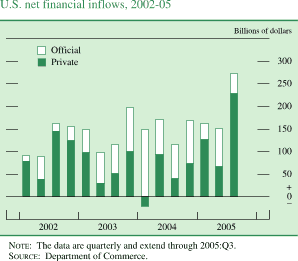
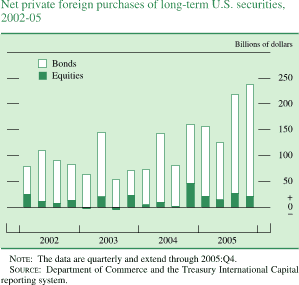
In 2005, foreign official financial inflows slowed from their extraordinary pace of 2004 but remained sizable. Most of these official inflows took the form of purchases of U.S. long-term government and private securities for reserve accumulation, primarily by Asian central banks. The slowdown in foreign official inflows last year was more than offset, however, by an increase in foreign private purchases of U.S. securities. Most of this pickup was concentrated in bonds, as in 2004, but foreign private purchases of U.S. equities also increased somewhat. Foreign direct investment flows into the United States continued to be strong in 2005, with the average pace during the first three quarters a bit higher than in 2004.
U.S. residents' net purchases of foreign securities remained brisk last year, near the levels recorded in 2003 and 2004, with smaller purchases of foreign bonds offset by larger purchases of foreign equities. By contrast, U.S. direct investment flows abroad slowed markedly during the first half of 2005 and turned negative in the third quarter. This unusual pattern reflected responses to the partial tax holiday provided in the 2004 Homeland Investment Act, which allowed firms to repatriate at a preferential tax rate previous years' earnings that had been reinvested in their foreign affiliates.
The Labor Market
Employment and Unemployment
Conditions in the labor market continued to improve, on balance, in 2005, although many individuals lost jobs in the aftermath of the hurricanes. Nonfarm payroll employment rose 175,000 per month, on average, through August, the same as the average monthly increase in 2004. Net hiring then slowed sharply in September and October, as job losses in the Gulf Coast region largely offset moderate increases in payrolls elsewhere in the nation. In November and December, monthly job growth was uneven, but it averaged 250,000, and hiring remained brisk in January. The reemployment of many of those who lost jobs because of the hurricanes appears to have provided a modest lift to overall hiring in recent months. However, others affected by the storms apparently have not found new jobs yet, and the unemployment rate among evacuees seems to have remained quite high.
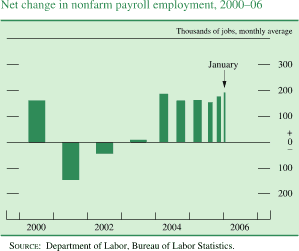
Employment gains were widespread by industry in 2005. As in 2004, hiring was especially strong at firms supplying professional and business services and in health care. The construction industry also continued to exhibit a good deal of vigor, spurred by the booming housing sector. Employment in retail trade and in food services rose fairly briskly in the first half of the year, but it was held down in the second half by job losses in the Gulf Coast region. In the manufacturing sector, employment was essentially flat for a second year after three years of steep declines. In the government sector, state and local payrolls continued to rise modestly, while civilian employment in the federal government was about unchanged.
After hovering around 5-1/2 percent during the second half of 2004, the unemployment rate fell, on net, over the first three months of 2005. During the remainder of the year, it fluctuated in a narrow range around 5 percent. In January 2006, it decreased to 4.7 percent. The labor force participation rate, which had dropped noticeably between 2000 and 2004, edged up, on net, in 2005. The participation rate in January 2006 was 66 percent, well below the high of 67-1/4 percent reached in early 2000 but not far from its trend, which has been declining in recent years as a consequence of demographic forces.
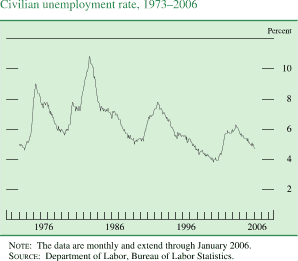
Other indicators also pointed to a gradual improvement in labor market conditions over the course of 2005. Initial claims for unemployment insurance drifted lower, and the job openings rate moved up. At year-end, the Conference Board reported that a larger proportion of respondents to its monthly survey thought that jobs were plentiful than thought that jobs were hard to get.
Productivity and Labor Costs
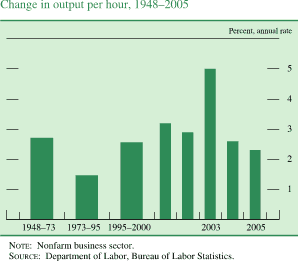
Labor productivity in the nonfarm business sector continued to advance in 2005. Last year's increase in output per hour of 2-1/4 percent was noticeably below the average annual gain over the preceding four years. But taking the longer view, growth in labor productivity over the past five years has averaged 3-1/4 percent per year, nearly 3/4 percentage point faster than the already impressive gains posted between 1995 and 2000. Productivity appears to have received considerable impetus in recent years from a number of factors, including the rapid pace of technological change and the growing ability of firms to use information and other technology to improve the efficiency of their operations. Increases in the amount of capital per worker, especially high-tech capital, have also helped to spur productivity growth over the past few years, although apparently by less than was the case during the capital spending boom in the late 1990s.
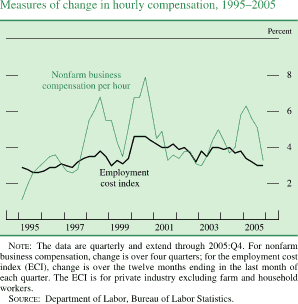
Increases in hourly labor compensation were moderate in 2005 even though overall consumer prices rose relatively rapidly for a second year and the downward pressure on wages from labor market slack diminished. As measured by the employment cost index (ECI) for private nonfarm businesses, hourly compensation increased 3 percent last year, 3/4 percentage point less than in 2004. The wages and salaries component of the ECI rose just 2-1/2 percent, the same as in 2004, while the cost of providing benefits rose 4 percent after two years of increases in the area of 6-1/2 percent to 7 percent. Much of the deceleration in benefits costs was in employers' contributions to retirement plans, which had increased markedly in 2003 and 2004 as firms ratcheted up their contributions to defined-benefit plans to cover earlier declines in the market value of the plans' assets. Health insurance costs rose 6-1/2 percent in 2005, the smallest increase since the late 1990s.
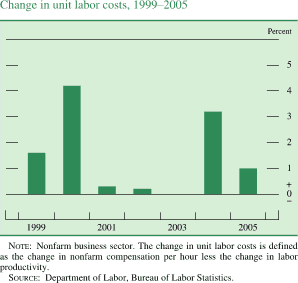
According to preliminary data, compensation per hour in the nonfarm business (NFB) sector--an alternative measure of compensation developments derived from the data in the NIPA--rose 3-1/4 percent in 2005, about the same rise as in the ECI. In 2004, NFB compensation had risen nearly 6 percent; a fourth-quarter surge in the value of stock option exercises, which are excluded from the ECI, likely contributed to that increase. The preliminary estimate for NFB compensation in 2005 reflects the apparent reversal of some of the late-2004 upswing in compensation, though it is subject to revision when more-detailed information becomes available later this year. In any event, the deceleration in hourly compensation last year held the increase in unit labor costs to 1 percent. Unit labor costs had risen more than 3 percent in 2004 after having been close to flat over the preceding three years.
Prices
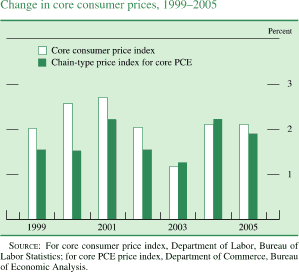
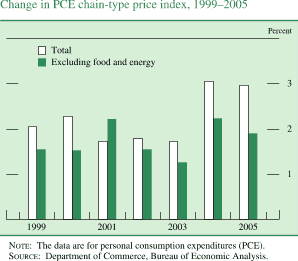
Headline inflation continued to be boosted by soaring energy prices in 2005, while core inflation--which excludes the direct effects of movements in food and energy prices--remained subdued. The PCE chain-type price index rose 3 percent for the second year in a row. The increase in core PCE prices, which in 2004 had ticked up to 2-1/4 percent, remained high in early 2005 by recent standards. Core PCE inflation subsequently subsided and came in a shade below 2 percent for the year as a whole. The market-based component of the core PCE price index--which excludes prices that must be imputed because they cannot be observed in market transactions and that often move erratically--rose 1-3/4 percent in 2005, unchanged from its pace in 2004. A similar pattern is evident in the core consumer price index, which rose about 2 percent in both 2004 and 2005, and in broad NIPA price measures such as the price index for GDP, which was up about 3 percent in both years.
