

Federal Reserve Banks
The Federal Reserve Banks provide "payment services" to depository and certain other institutions, distribute the nation's currency and coin to depository institutions, and serve as fiscal agents and depositories for the U.S government and other entities. The Reserve Banks also contribute to setting national monetary policy and supervision and regulation of banks and other financial entities operating in the United States (discussed in the preceding chapters of this report).
Developments in Federal Reserve Priced Services
Federal Reserve Banks provide a range of payment and related services to depository institutions, including collecting checks, operating an automated clearinghouse (ACH) service, transferring funds and securities, and providing a multilateral settlement service. The Reserve Banks charge fees for providing these "priced services."
The Monetary Control Act of 1980 requires that the Federal Reserve establish fees for priced services provided to depository institutions so as to recover, over the long run, all direct and indirect costs actually incurred as well as the imputed costs that would have been incurred--including financing costs, taxes, and certain other expenses--and the return on equity (profit) that would have been earned if a private business firm had provided the services.1 The imputed costs and imputed profit are collectively referred to as the private-sector adjustment factor (PSAF).2 Over the past 10 years, Reserve Banks have recovered 97.8 percent of their priced services costs, including the PSAF (see table).3
| Year | Revenue from services1 | Operating expenses and imputed costs2 | Targeted return on equity3 | Total costs | Cost recovery (percent)4,5 |
|---|---|---|---|---|---|
| 2000 | 922.8 | 818.2 | 98.4 | 916.6 | 100.7 |
| 2001 | 960.4 | 901.9 | 109.2 | 1,011.1 | 95.0 |
| 2002 | 918.3 | 891.7 | 92.5 | 984.3 | 93.3 |
| 2003 | 881.7 | 931.3 | 104.7 | 1,036.1 | 85.1 |
| 2004 | 914.6 | 842.6 | 112.4 | 955.0 | 95.8 |
| 2005 | 994.7 | 834.7 | 103.0 | 937.7 | 106.1 |
| 2006 | 1,031.2 | 875.5 | 72.0 | 947.5 | 108.8 |
| 2007 | 1,012.3 | 913.3 | 80.4 | 993.7 | 101.9 |
| 2008 | 873.8 | 820.4 | 66.5 | 886.9 | 98.5 |
| 2009 | 675.4 | 707.5 | 19.9 | 727.5 | 92.8 |
| 2000-2009 | 9,185.2 | 8,537.2 | 859.0 | 9,396.3 | 97.8 |
Note: Here and elsewhere in this chapter, components may not sum to totals or yield percentages shown because of rounding.
1. For the 10-year period, includes revenue from services of $8,600.9 million and other income and expense (net) of $584.3 million. Return to table
2. For the 10-year period, includes operating expenses of $8,113.8 million, imputed costs of $140.8 million, and imputed income taxes of $282.5 million. Return to table
3. For 2009, in light of uncertainty about the long-term effect that the payment of interest on reserve balances held by depository institutions at the Reserve Banks would have on the level of clearing balances, the PSAF has been adjusted to reflect the actual clearing balance levels maintained throughout 2009. Return to table
4. Revenue from services divided by total costs. Return to table
5. For the 10-year period, cost recovery is 93.0 percent, including the net reduction in equity related to ASC 715 reported by the priced services in 2009. Return to table
Return to textIn 2009, Reserve Banks recovered 92.8 percent of total priced services costs of $727.5 million, including the PSAF.4 Revenue from priced services amounted to $662.7 million, other income was $12.7 million, and costs were $707.5 million, resulting in a net loss to priced services of $32.1 million.5 During the year, the Banks raised prices, reduced operating costs, and accelerated the consolidation of their check-processing infrastructure to improve their overall cost recovery. These efforts, however, were not sufficient to offset reduced net income on clearing balances and increased pension costs.
The Reserve Banks are engaged in a number of technology initiatives that will modernize their priced services processing platforms over the next several years. The Banks are developing and planning to implement a new end-to-end electronic check-processing system to improve the efficiency and reliability of their current check-processing operations. They also continued efforts to migrate the FedACH and Fedwire Funds services off a mainframe system and to a distributed environment.
Commercial Check-Collection Service
In 2009, Reserve Banks recovered 92.8 percent of the total costs of their commercial check-collection service, including the PSAF. The Banks' operating expenses and imputed costs totaled $514.6 million. Revenue from operations totaled $481.7 million and other income totaled $9.2 million, resulting in a net loss of $23.7 million. Check-service fee revenue in 2009 decreased $123.5 million from 2008.6
Reserve Banks handled 8.6 billion checks in 2009, a decrease of 10.1 percent from 2008 (see table). The decline in Reserve Bank check volume has been influenced by nationwide trends away from the use of checks and toward greater use of electronic payment methods.7 By year-end 2009, 98.6 percent of Reserve Bank check deposits and 94.3 percent of Reserve Bank check presentments were being made through Check 21 products.8
| Service | 2009 | 2008 | 2007 | Percent change | |
|---|---|---|---|---|---|
| 2008 to 2009 | 2007 to 2008 | ||||
| Commercial check | 8,584,929 | 9,545,424 | 10,001,289 | -10.1 | -4.6 |
| Commercial ACH | 9,966,260 | 10,040,388 | 9,363,429 | -0.7 | 7.2 |
| Fedwire funds transfer | 127,357 | 134,220 | 137,555 | -5.1 | -2.4 |
| National settlement | 464 | 469 | 505 | -1.1 | 7.2 |
| Fedwire securities transfer | 10,519 | 11,717 | 10,110 | -10.2 | 15.9 |
Note: Activity in commercial check is the total number of commercial checks collected, including processed and fine-sort items; in commercial ACH, the total number of commercial items processed; in Fedwire funds transfer and securities transfer, the number of transactions originated online and offline; and in national settlement, the number of settlement entries processed.
The Reserve Banks continued the consolidation of their check-processing offices in 2009. Because of the rapid adoption of electronic check processing, the Banks were able to reduce their check-processing infrastructure more quickly than originally expected. By year-end 2009, the Banks were processing paper checks at two sites nationwide, down from 13 at year-end 2008. This reduction is part of the Reserve Banks' multiyear initiative, begun in 2003, to reduce the number of offices at which Banks process checks to meet their long-run cost-recovery requirement under the Monetary Control Act of 1980.
Commercial Automated Clearinghouse Services
In 2009, the Reserve Banks recovered 93.4 percent of the total costs of their commercial ACH services, including the PSAF. Reserve Bank operating expenses and imputed costs totaled $98.5 million.
Revenue from ACH operations totaled $92.9 million and other income totaled $1.8 million, resulting in a net loss of $3.8 million. The Reserve Banks processed 10.0 billion commercial ACH transactions, a decrease of 0.7 percent from 2008. ACH volumes were down slightly because of lower growth rates in industry ACH volume, including checks converted at lockbox locations.
Check 21 -- Five Years Later
The Check Clearing for the 21st Century Act (Check 21), which became effective on October 28, 2004, promised a modernization of the nation's largely paper-based check-clearing system. In the five years since, considerable progress has been made toward achieving the act's purpose of improving the overall efficiency of the nation's payments system by fostering innovation in the check-collection system.
When Check 21 was enacted, the nation's retail payments system was already undergoing a transformation driven by changes in technology, rules, and consumer and business preferences. Federal Reserve research had revealed that, in 2003, the number of electronic payments had surpassed the number of check payments for the first time. However, the modernization of the check-collection system was stymied by laws that let banks demand that original checks be presented for payment. The banking industry's extensive reliance on the physical movement of checks became apparent after the terrorist attacks of September 11, 2001, when air traffic came to a standstill resulting in delays in the clearing of many checks.
Check 21 addressed these issues indirectly by creating a new negotiable paper instrument, called a substitute check, that when properly prepared would be the legal equivalent of an original check. The law required banks that were either unable or unwilling to accept checks electronically to accept substitute checks in place of the originals. This statutory change, in turn, facilitated "check truncation," whereby banks could stop forwarding original checks for collection or return and apply check-imaging technology in a more robust fashion to achieve the efficiencies and cost savings associated with electronic check clearing.
The Federal Reserve Banks began offering Check 21 services as soon as the law became effective. Initially, the move toward electronic check clearing unfolded gradually as many banks tried to determine how best to apply the provisions of the new law. The use of the Reserve Banks' Check 21 services accelerated after banks developed their business strategies and made the investments necessary to support the exchange of check images. Banks initially focused on collecting checks electronically rather than receiving their check presentments electronically. As a result of the disparity in adoption rates on the collection and presentment sides, Federal Reserve Bank substitute check volume peaked in October 2007, at 13.9 million per day, which represented 34 percent of Reserve Bank presentment volume.
The extensive use of costly substitute checks by the Reserve Banks was a transitional phenomenon, however, as an increasing number of banks began accepting check presentments electronically. In December 2009, almost 99 percent of Reserve Bank check deposits were electronic while 94 percent of check presentments were electronic. The re-engineering of the process by which banks return checks has lagged that of the forward check collection. More recently, however, the use of Reserve Bank electronic check return products has begun to accelerate and, by December 2009, 91 percent of check returns were deposited electronically and almost 51 percent were delivered electronically.
The rapid decline in the use of paper checks has allowed the Reserve Banks to reduce their processing infrastructure for paper checks more quickly than originally expected. In 2003, the Banks processed checks at 45 offices nationwide; by early 2010, only one Reserve Bank office processed paper checks. This infrastructure consolidation has enabled the Banks to significantly reduce check-processing costs, including the costs to physically transport paper checks.
The transformation of the nation's check-clearing system has also benefited retail and institutional bank customers. The Reserve Banks' consolidation of check-processing sites has resulted in the reclassification of checks from nonlocal to local, reducing the maximum permissible hold periods for deposited checks under Regulation CC. Beginning in 2010, nonlocal checks, as a class, no longer exist. Some banks have also extended deposit cutoff hours at branches and ATMs, and have begun to offer their customers remote deposit capture services, which allow checks to be deposited electronically for collection.
A new industry ACH format related to cross-border transactions, the International ACH Transaction (IAT) format, was introduced in 2009. To help depository institutions meet their compliance obligations for international ACH transactions, the Reserve Banks began offering an IAT report service. This service searches incoming files for a given processing day and, if any IAT items are found, it generates a report displaying all IAT items for a given business day.
Fedwire Funds and National Settlement Services
In 2009, Reserve Banks recovered 92.1 percent of the costs of their Fedwire Funds and National Settlement Services, including the PSAF. Reserve Bank operating expenses and imputed costs totaled $69.3 million in 2009. Revenue from these operations totaled $64.4 million, and other income amounted to $1.3 million, resulting in a net loss of $3.6 million.
Fedwire Funds Service
The Fedwire Funds Service allows participants to use their balances at Reserve Banks to transfer funds to other participants. In 2009, the number of Fedwire funds transfers originated by depository institutions decreased 5.1 percent from 2008, to approximately 127 million. The average daily value of Fedwire funds transfers in 2009 was $2.5 trillion.
In 2009, the Reserve Banks implemented an enhanced Fedwire Funds Service message format to include additional information about cover payments. Cover payments are bank-to-bank funds transfers used to fund or settle underlying customer payment obligations. This message format provides the space to include identifying information about originators and beneficiaries of transfers, improving payment transparency and assisting banks in risk management and transparency.
National Settlement Service
The National Settlement Service is a multilateral settlement system that allows participants in private-sector clearing arrangements to settle transactions using Federal Reserve balances. In 2009, the service processed settlement files for 41 local and national private-sector arrangements. The Reserve Banks processed slightly more than 10,500 files that contained almost 464,000 settlement entries for these arrangements in 2009.
Fedwire Securities Service
In 2009, the Reserve Banks recovered 93.8 percent of the total costs of their Fedwire Securities Service, including the PSAF. The Banks' operating expenses and imputed costs for providing this service totaled $25.1 million in 2009. Revenue from the service totaled $23.7 million, and other income totaled $0.5 million, resulting in a net loss of $0.9 million.
The Fedwire Securities Service allows participants to transfer electronically to other participants in the service certain securities issued by the U.S. Treasury, federal government agencies, government-sponsored enterprises, and certain international organizations.9 In 2009, the number of non-Treasury securities transfers processed via the service decreased 10.2 percent from 2008, to approximately 10.5 million.
Float
The Federal Reserve had daily average credit float of $1,976.4 million in 2009, compared with credit float of $1,193.4 million in 2008.10
Developments in Currency and Coin
The Federal Reserve Board issues the nation's currency (in the form of Federal Reserve notes), and the Federal Reserve Banks distribute currency and coin through depository institutions. The Reserve Banks also receive currency and coin from circulation through these institutions.
The Reserve Banks received 35.2 billion Federal Reserve notes from circulation in 2009, a 4.1 percent decrease from 2008, and made payments of 35.8 billion notes into circulation in 2009, a 5.1 percent decrease from 2008. Although Reserve Bank payments into circulation decreased to pre-financial-crisis levels, receipts from circulation decreased to a greater extent, likely because consumers typically hold more currency in times of economic uncertainty. The value of currency in circulation increased 4.1 percent in 2009, to $887.8 billion, following a significant increase in 2008. The Banks received 65.3 billion coins from circulation in 2009, a 1.4 percent increase from 2008, and they made payments of 68.9 billion coins into circulation, a 4.7 percent decrease from 2008.
Board staff worked with Treasury, the U.S. Secret Service, and the Reserve Banks' Currency Technology Office to develop a more-secure design for the $100 Federal Reserve note. The new design was unveiled on April 21, 2010.
The Reserve Banks continued implementing a program to extend the useful life of the System's BPS 3000 high-speed currency-processing machines. The program will replace the operating systems of the current equipment, which will help improve the Reserve Banks' processing efficiency. By year-end 2009, the Banks had upgraded 90 of 131 machines. They expect to complete the program in 2010.
Reserve Banks are in the early stages of developing a new cash automation platform that will facilitate control of the Banks' cash operations and improve their efficiency, provide an expansive and responsive management information reporting system with superior and flexible reporting tools, facilitate business continuity and contingency planning, and enhance the support provided to Reserve Bank customers and business partners. In 2009, the Banks refined the design for the new system.
Developments in Fiscal Agency and Government Depository Services
As fiscal agents and depositories for the federal government, the Federal Reserve Banks auction Treasury securities, process electronic and check payments for Treasury, collect funds owed to the federal government, maintain Treasury's bank account, and invest Treasury balances. The Reserve Banks also provide certain fiscal agency and depository services to other entities; these services are primarily related to book-entry securities.
Treasury and other entities fully reimbursed the Reserve Banks for the costs of providing fiscal agency and depository services. In 2009, reimbursable expenses amounted to $450.3 million, compared with $461.1 million in 2008 (see table). Support for Treasury programs accounted for 93.8 percent of the cost, and support for other entities accounted for 6.2 percent. The Reserve Banks actively monitor program expenses, and they strive to contain these costs while providing the resources necessary to accomplish program objectives.
Treasury Securities Services
The Reserve Banks work closely with Treasury's Bureau of the Public Debt in support of the borrowing needs of the federal government. The Banks auction, issue, maintain, and redeem securities; provide customer service; and operate the automated systems supporting paper U.S. savings bonds and book-entry marketable Treasury securities (bills, notes, and bonds). Treasury securities services consist of retail securities programs (which primarily serve individual investors) and wholesale securities programs (which serve institutional customers).
Retail Securities Programs
The Reserve Banks continued to support Treasury's efforts to improve the quality and efficiency of securities services provided to retail customers. The Banks process paper U.S. savings bonds transactions and book-entry marketable Treasury securities transactions for securities held in Legacy Treasury Direct, Treasury's first application designed to support retail customers who purchase marketable Treasury securities. Reserve Bank operating expenses for the retail securities programs were $73.7 million in 2009, compared with $72.4 million in 2008. Although the Banks' staffing levels declined slightly in response to lower activity levels, the associated costs savings were offset by other cost increases.
| Agency and service | 2009 | 2008 | 2007 |
|---|---|---|---|
| Department of the Treasury | |||
| Bureau of the Public Debt | |||
| Treasury retail securities | 73,678.5 | 72,373.7 | 74,149.2 |
| Treasury securities safekeeping and transfer | 8,814.6 | 9,304.7 | 8,687.7 |
| Treasury auction | 30,215.8 | 37,071.6 | 41,372.0 |
| Computer infrastructure development and support | 2,333.2 | 4,463.7 | 3,558.7 |
| Other services | 1,375.0 | 909.9 | 724.5 |
| Total | 116,417.0 | 124,123.7 | 128,492.1 |
| Financial Management Service | |||
| Payment services | 104,354.8 | 108,218.5 | 105,326.8 |
| Collection services | 37,967.5 | 49,179.7 | 50,738.1 |
| Cash-management services | 49,045.7 | 48,676.4 | 44,742.7 |
| Computer infrastructure development and support | 66,958.5 | 65,058.6 | 70,999.9 |
| Other services | 7,392.9 | 7,577.4 | 7,245.7 |
| Total | 265,719.3 | 278,710.6 | 279,053.2 |
| Other Treasury | |||
| Total | 40,390.3 | 27,017.2 | 19,609.6 |
| Total, Treasury | 422,526.6 | 429,851.5 | 427,154.9 |
| Other Fiscal Principals | |||
| Total, other agencies | 27,757.9 | 31,292.3 | 31,031.1 |
| Total reimbursable expenses | 450,284.5 | 461,143.9 | 458,186.0 |
Note: Numbers in bold reflect restatements due to recategorization.
During the year, the Reserve Banks began working with the Bureau of the Public Debt on an initiative that will improve the quality, consistency, and efficiency of support provided to retail securities customers. Treasury's Retail E-Services initiative aims to lower costs while providing a high-quality customer service experience, providing more opportunities for customer self-service, and eliminating duplicative processes.
Consistent with the trend from previous years, both the Legacy Treasury Direct and paper savings bonds programs experienced volume declines in 2009. The Legacy Treasury Direct system held $49.9 billion (par value) of Treasury securities as of December 31, a 21.2 percent decrease from 2008. This decrease is attributable to fewer reinvestments of maturing securities, fewer purchases of new securities, and higher dollar values of outgoing securities transfers.
The Reserve Banks also printed and mailed more than 20 million savings bonds in 2009, an 11.4 percent decrease from 2008. The decline in Legacy Treasury Direct holdings and in the number of paper savings bonds printed and mailed aligns with the Bureau of the Public Debt's strategic goal to transition retail customers from these legacy products to Treasury's web-based Treasury Direct application, which supports investments in book-entry Treasury securities and electronic savings bonds.
Wholesale Securities Programs
The Reserve Banks also support wholesale securities programs through the sale, issuance, safekeeping, and transfer of marketable Treasury securities. In support of Treasury's strategic goal to finance government operations effectively at the lowest overall cost, the Banks worked to contain costs in the auction and book-entry securities services. Reserve Bank operating expenses in 2009 in support of Treasury securities auctions were $30.2 million, compared with $37.1 million in 2008. The decline in costs is attributable to lower staffing levels resulting from the implementation of the new Treasury auction application in April 2008. In 2009, the Banks conducted 283 Treasury securities auctions, compared with 263 in 2008. The increase in the number of auctions was attributable in part to the reintroduction of the seven-year Treasury note, which is auctioned monthly.
In addition, operating expenses associated with securities safekeeping and transfer activities were $8.8 million in 2009, compared with $9.3 million in 2008. The cost decline is attributable to the lower volume of Treasury security transfers during the year, due in part to consolidation of some Treasury securities dealers. In 2009, the number of Fedwire Treasury securities transfers decreased 22.0 percent from 2008, to approximately 10.0 million.
Payments Services
The Reserve Banks work closely with Treasury's Financial Management Service and other government agencies to process payments to individuals and companies. The Banks process electronic and paper-based disbursements such as Social Security and veterans' benefits, income tax refunds, and other types of payments. Reserve Bank operating expenses for payments-related activity totaled $104.4 million in 2009, compared with $108.2 million in 2008. The decline in costs is primarily attributable to the staff reductions in the Banks' Treasury check operations.
In 2009, the Reserve Banks processed 1.2 billion ACH payments for Treasury, an increase of 5.4 percent from 2008. The Banks also processed 202.2 million Treasury checks, a decrease of 25.0 percent from 2008. The decrease in Treasury checks is roughly equivalent to the increase experienced in 2008 due to the economic stimulus payments issued that year.
The increase in the number of ACH payments (relative to check payments) is consistent with Treasury's long-standing goal to make all payments electronically. Similar to the experience of the commercial check-collection service discussed earlier in this chapter, the proportion of Treasury checks presented to the Reserve Banks for processing in image form continued to increase as the number of depository institutions depositing checks in image form with the Banks increased. By year-end 2009, 99.1 percent of Treasury checks presented to the Banks were presented in image form. The shift in form from paper to images has increased the efficiency of processing Treasury checks, and resulted in lower staffing levels at the Banks and lower costs to the Treasury.
The Reserve Banks support Treasury's ongoing effort to convert paper checks to electronic payments through support of the Go Direct initiative (www.godirect.org), which focuses on converting check benefit payments to direct deposit. In 2009, more than 692,000 check payments were converted to direct deposit, an increase of 20.0 percent from the number of conversions in 2008. The Banks also operate an international electronic payment service that supports government benefit and other payments to more than 150 countries. In 2009, the Banks processed nearly $24.0 billion in international payments, compared with $22.5 billion in 2008. During the year, the Banks improved operational efficiency by reducing the number of service providers used to make international payments.
Collection Services
The Reserve Banks also work closely with Treasury's Financial Management Service to collect funds owed the federal government--such as federal taxes--and fees for its goods and services.
Reserve Bank operating expenses related to collections services totaled $38.0 million in 2009, compared with $49.2 million in 2008. The decline in costs is due to the transition of two collection programs from the Reserve Banks to a commercial bank at the end of 2008.
Throughout 2009, the Reserve Banks and Treasury continued work on the Collections and Cash Management Modernization (CCMM) initiative, a multiyear Treasury effort to simplify, modernize, and improve the services, systems, and processes supporting Treasury's collections and cash management programs. The Banks actively support various aspects of the CCMM initiative, including development of new applications to support both collection of funds and monitoring of collateral pledged to government programs.
To support the collection of federal taxes, the Reserve Banks operate several systems to process both electronic and paper tax payments. For example, the Banks operate the Federal Electronic Tax Application (FR-ETA), a same-day electronic federal tax payment system. In 2009, depository institutions submitted $452.2 billion in tax payments through FR-ETA.
The Reserve Banks also process paper federal tax deposit coupons submitted by depository institutions. The Banks processed 24.6 million coupons with a dollar value of $42.1 billion in 2009, compared with 29.5 million coupons with a dollar value of $54.9 billion in 2008. There are expected to be further declines in paper tax coupon payments in the coming years as the federal government continues to promote participation in electronic tax payment mechanisms.
In support of the collection of funds to pay for goods and services provided by the federal government, the Reserve Banks operate Pay.gov, a Treasury program that allows the public to use the Internet to authorize and initiate payments to federal agencies. During the year, the Pay.gov program was expanded to include several new agencies. In 2009, Pay.gov processed transactions worth $64.9 billion, compared with $44.1 billion in 2008.
The Reserve Banks also operate software that supports the settlement of transactions from Pay.gov and two other Treasury collection programs. In 2009, the Banks processed 62.9 million transactions valued at $99.5 billion, compared with 46.4 million transactions valued at $74.9 billion in 2008. As part of the CCMM initiative, the Banks are developing a more broadly based settlement framework that will support several additional collection applications. It is scheduled to replace the current system in 2010.
The Reserve Banks also support the government's centralized delinquent debt-collection program. Specifically, the Banks developed software that facilitates the collection of delinquent debts owed to federal agencies and states by matching federal payments against delinquent debts, including past-due child support payments owed to custodial parents. The Banks helped Treasury collect more than $4.8 billion through this program in fiscal year 2009.
Treasury Cash-Management Services
Treasury maintains an operating cash account at the Reserve Banks to support the various transactions discussed in the preceding sections of this chapter, and it may instruct the Banks to invest funds from its account in interest-bearing accounts with qualified depository institutions.
The Reserve Banks provide collateral-management and collateral-monitoring services for Treasury's investment programs and other Treasury programs that have collateral requirements. Reserve Bank operating expenses related to these programs and other cash-management initiatives totaled $49.0 million in 2009, compared with $48.7 million in 2008. The slight cost increase is due to additional work associated with application development initiatives supporting Treasury's CCMM initiative.
During 2009, the Reserve Banks continued to support Treasury's effort to modernize its financial management processes, with a focus on improving centralized government accounting and reporting functions. The Banks worked with Treasury to identify potential, long-term efficiency improvements in the way the Banks account for government payments and collections. The Banks also collaborated with the Financial Management Service on several ongoing software development efforts. For example, the Banks support Treasury's Governmentwide Accounting and Reporting Modernization initiative, which improves the timeliness of accounting data to support better financial analysis and decisionmaking.
To support Treasury's investment programs, the Reserve Banks continued to maintain several software applications. Treasury investments are fully collateralized, and the Banks monitor the collateral pledged to Treasury. The Banks also monitor collateral pledged to other Treasury programs, such as collateral pledged to secure public funds held on deposit at financial institutions. In addition, as part of the CCMM initiative, the Banks began working with the Financial Management Service to develop a new collateral application that will replace the legacy applications and provide support to other new cash-management applications developed as part of the CCMM initiative.
Computer Infrastructure and Other Treasury Services
The Reserve Banks operate a web-application infrastructure and provide other technology-related services to Treasury. The infrastructure supports multiple Treasury applications, primarily for the Financial Management Service.
Reserve Bank operating expenses for the infrastructure and other technology-related services--the costs of which are shared by the Financial Management Service and the Bureau of the Public Debt--were $67.0 million in 2009, compared with $65.1 in 2008. The web-application infrastructure accounts for the majority of the costs, and the Banks worked closely with Treasury to contain these costs, even as the number of applications supported by the infrastructure continued to increase.
Although the Reserve Banks primarily work with the Financial Management Service and Bureau of the Public Debt on fiscal programs, the Banks also support other fiscal programs, such as Treasury's debt-management program and its exchange stabilization fund. Reserve Bank operating expenses for these programs were $40.4 million in 2009, compared with $27.0 million in 2008. The cost increase is primarily due to the development and implementation of a debt-management application.
Services Provided to Other Entities
When permitted by federal statute or when required by the Secretary of the Treasury, the Reserve Banks provide fiscal agency and depository services to other domestic and international entities.
Book-entry securities issuance and maintenance activities account for a significant amount of the work performed for other entities, with the majority performed for the Federal Home Loan Mortgage Association, the Federal National Mortgage Association, and the Government National Mortgage Association.
The Reserve Banks also process paid postal money orders for the United States Postal Service, activity that accounts for roughly a quarter of the Banks' costs for services provided to other non-Treasury entities. Reserve Bank operating expenses for services provided to other entities were $27.8 million in 2009, compared with $31.3 million in 2008. The decline in costs is due in part to staff reductions in the Banks' postal money orders processing operations. Like Treasury checks, postal money orders are processed primarily in image form now, resulting in operational improvements and lower staffing levels at the Banks and lower costs to the U.S. Postal Service.
Developments in Use of Federal Reserve Intraday Credit
The Board's Payment System Risk (PSR) policy governs the use of Federal Reserve Bank intraday credit, also known as daylight overdrafts.
A daylight overdraft occurs when an institution's account activity creates a negative balance in the institution's Federal Reserve account at any time in the operating day.11 Daylight overdrafts enable institutions to send payments more freely throughout the day than if institutions were limited strictly by their available funds balance. In 2009, institutions held on average about $900 billion in their Federal Reserve accounts overnight, but the daily value of funds transferred over just the Federal Reserve's funds transfer system was about $2.5 trillion.
In December 2008, the Board approved revisions to its PSR policy that will become effective in late 2010 or early 2011.12 The revisions will, in part, allow eligible institutions to collateralize daylight overdrafts and pay no fee for these overdrafts. The Reserve Banks have begun work to modify the systems they use to record collateral pledges and to track daylight overdrafts. In March 2009, the Board implemented an interim policy change for eligible foreign banking organizations (FBOs).13 The interim policy allows highly rated FBOs to use a streamlined procedure to apply for a max cap and allows these institutions to use 100 percent of their capital measure in calculating the deductible amount for daylight overdraft pricing. To remain eligible for the higher deductible value under the new policy, an FBO must have collateral pledged to its Reserve Bank equal to or greater than the amount of its deductible. Under the previous policy, FBOs were eligible to use up to 35 percent of their capital measure in the calculation of the deductible and net debit cap. FBOs introduce greater risks than do U.S.-chartered institutions in terms of the timeliness and scope of available supervisory information and other supervisory issues that may arise because of the cross-border nature of the FBO's business (for example, application of different legal regimes).
Recent Trends in Daylight Overdraft Usage
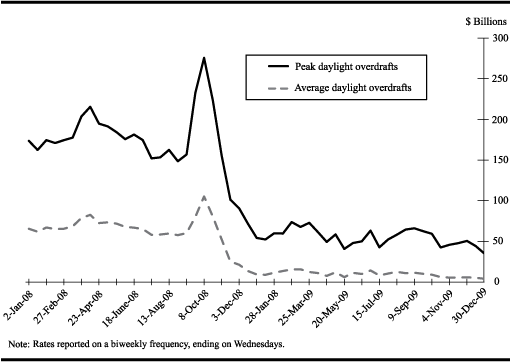
During the periods of extreme market stress in 2008, the level of daylight overdrafts spiked and then dropped to historical lows as balances institutions held at the Reserve Banks spiked to historically high levels. Both daylight overdrafts and Federal Reserve account balances have remained at these historic levels throughout 2009. The average level of average daylight overdrafts in 2009 was about $10 billion, or about 84 percent lower than the average 2008 level.14 The average level of peak daylight overdrafts decreased to about $55 billion in 2009, a decrease of about 67 percent from 2008.15 Daylight overdraft fees paid by institutions also dropped sharply as daylight overdraft levels decreased. In 2008, institutions paid about $52 million in daylight overdraft fees but only $4 million in 2009.
The usage of daylight overdrafts spiked amid the market turmoil near the end of 2008, but dropped sharply as various liquidity programs initiated by the Federal Reserve took effect (see the chart below). During this period, the Federal Reserve also began paying interest on balances held at the Reserve Banks, increased its lending under the Term Auction Facility, and began purchasing government-sponsored enterprise mortgage-backed securities. These measures tended to increase balances institutions held at the Banks, which decreased the demand for intraday credit. In 2008, reserve balances averaged $180 billion and spiked about 400 percent, to an average of about $900 billion in 2009. Furthermore, in 2009 the rate paid on reserve balances remained, on average, about nine basis points more than the effective federal funds rate, which is the rate at which depository institutions lend balances to each other overnight. This spread gives institutions incentive to hold higher balances at the Federal Reserve, and it has likely contributed to very low daylight overdraft usage throughout the System.
Electronic Access to Reserve Bank Services
The Reserve Banks provide several options to enable customers to access the Banks' financial services information and payment services electronically. Most depository institutions that directly access the Banks' Fedwire Funds, Fedwire Securities, and FedACH services do so using FedLine Advantage connections, which provide web-based access. There were 5,673 FedLine Advantage connections at year-end 2009, 10 fewer than at year-end 2008.
The Reserve Banks' largest customers use FedLine Direct connections, which enable unattended computer-to-computer access to the Banks' financial services through dedicated connections. A large majority of the value transferred through the Banks' financial services flow through FedLine Direct connections, of which there were 256 at year-end 2009, 20 fewer than a year earlier.
Like FedLine Direct, FedLine Command enables computer-to-computer access. It provides an unattended, batch-file solution to certain services at a cost lower than that for FedLine Direct. There were 39 FedLine Command connections at year-end 2009, 22 more than a year earlier.
Many institutions access Reserve Bank information services and perform limited transaction services through FedLine Web. There were 2,979 FedLine Web connections at year-end 2009, 43 more than a year earlier.
Also in 2009, the Federal Reserve Banks completed the Tier 1 Data Delivery Service, a cross-business file transfer utility for nonpayment services. This service replaces the BulkData service previously used to transfer low-risk files between the Federal Reserve Banks and customers.
Information Technology
In 2009, the Federal Reserve Banks continued to develop and implement their information technology (IT) strategy by strengthening IT governance, managing information security risk, and analyzing and coordinating the System's IT investments.
In 2009, Federal Reserve Information Technology (FRIT)16 continued to lead Reserve Bank efforts to transition to a more-robust information security model. FRIT initiated a transition to a new information security assurance program for infrastructure systems, based on guidance from the National Institute of Science and Technology.17 The new assurance program will allow the System to
- have a defined and consistent view of information security roles and responsibilities,
- enhance the security controls assessment testing program, and
- introduce an IS risk management function at all levels of the organization.
In 2009, the Reserve Banks approved the following initiatives:
- the consolidation of all Reserve Bank helpdesk functions into a national IT helpdesk
- a strategy to consolidate and centrally manage Reserve Bank servers and storage
- a network strategy that adopts an enterprise approach to the provision, operation, and management of hardware and software that provide data, video, and voice communication for the Reserve Banks.
Examinations of the Federal Reserve Banks
Section 21 of the Federal Reserve Act requires the Board of Governors to order an examination of each Reserve Bank at least once a year. The Board performs its own reviews and engages a public accounting firm. The public accounting firm annually audits the combined financial statements of the Reserve Banks (see the "Federal Reserve Banks Combined Financial Statements" in the "Audits of the Federal Reserve System" section of this report) as well as the annual financial statements of each of the 12 Banks and the consolidated limited liability company (LLC) entities.
The Reserve Banks use the framework established by the Committee of Sponsoring Organizations of the Treadway Commission (COSO) to assess their internal controls over financial reporting, including the safeguarding of assets. In 2009, the Reserve Banks further enhanced their processes under the guidance of the COSO framework and the Sarbanes-Oxley Act of 2002.
Within this framework, the management of each Reserve Bank annually provides an assertion letter to its board of directors that confirms adherence to COSO standards. Similarly, each LLC annually provides an assertion letter to the board of directors of the Federal Reserve Bank of New York (the New York Reserve Bank). A public accounting firm issues an attestation report to each Bank's board of directors and to the Board of Governors.
In 2009, the Board engaged Deloitte & Touche LLP (D&T) to audit the individual and combined financial statements of the Reserve Banks and those of the consolidated LLC entities. Fees for D&T's services totaled $10 million. Of the total fees, $2 million were for the audits of the consolidated LLC entities that are associated with Federal Reserve actions to address the financial crisis and are consolidated in the financial statements of the New York Reserve Bank.18 To ensure auditor independence, the Board requires that D&T be independent in all matters relating to the audit. Specifically, D&T may not perform services for the Reserve Banks or others that would place it in a position of auditing its own work, making management decisions on behalf of the Reserve Banks, or in any other way impairing its audit independence. In 2009, one Reserve Bank engaged D&T for nonaudit consulting services for which the fees were immaterial.
| Item | 2009 | 2008 |
|---|---|---|
| Current income | 54,463 | 41,046 |
| Current expenses | 5,979 | 4,870 |
| Operating expenses1 | 3,694 | 3,232 |
| Interest paid to depository institutions and earnings credits granted2 | 2,187 | 901 |
| Interest expense on securities sold under agreements to repurchase | 98 | 737 |
| Current net income | 48,484 | 36,175 |
| Net additions to (deductions from, -) current net income | 4,820 | 3,341 |
| Profit on sales of U.S. Treasury securities | 0 | 3,769 |
| Profit on sales of federal agency and government-sponsored enterprise mortgage-backed securities | 879 | ... |
| Profit on foreign exchange transactions | 172 | 1,266 |
| Net income (loss) from consolidated limited liability companies | 5,588 | -1,693 |
| Provisions for loan restructuring3 | -2,621 | … |
| Other additions4 | 802 | … |
| Assessments by the Board of Governors | 888 | 853 |
| For Board expenditures | 386 | 352 |
| For currency costs | 502 | 500 |
| Change in funded status of benefit plans | 1,007 | -3,159 |
| Comprehensive income before distributions to Treasury | 53,423 | 35,504 |
| Dividends paid | 1,428 | 1,190 |
| Transferred to surplus and change in accumulated other comprehensive income | 4,564 | 2,626 |
| Distributions to U.S. Treasury5 | 47,431 | 31,689 |
1. Includes a net periodic pension expense of $663 million in 2009 and $160 million in 2008. Return to table
2. In October 2008, the Reserve Banks began to pay interest to depository institutions on qualifying balances. Return to table
3. Represents the economic effect of the interest rate reduction made pursuant to the April 17, 2009, restructuring of the American International Group loan. Return to table
4. Includes dividends on preferred securities, unrealized gain on Term Asset-Backed Securities Loan Facility loans, and compensation paid by Citigroup, Inc. and Bank of America Corporation for the New York Reserve Bank's and Richmond Reserve Bank's commitments to provide funding support, net of related expenses. Return to table
5. Interest on Federal Reserve notes. Return to table
.... Not applicable. Return to table
The Board's annual examination of the Reserve Banks includes a wide range of off-site and on-site oversight activities, conducted primarily by the Division of Reserve Bank Operations and Payment Systems. Division personnel monitor the activities of each Bank and LLC on an ongoing basis and conduct a comprehensive on-site review of each Bank at least once every three years.
The reviews also include an assessment of the internal audit function's conformance to International Standards for the Professional Practice of Internal Auditing, conformance to applicable policies and procedures, and the audit department's efficiency.
To assess compliance with the policies established by the Federal Reserve's Federal Open Market Committee (FOMC), the division also reviews the accounts and holdings of the System Open Market Account (SOMA) at the New York Reserve Bank and the foreign currency operations conducted by that Reserve Bank. In addition, D&T audits the year-end schedule of participated asset and liability accounts and the related schedule of participated income accounts. The FOMC receives the external audit reports and a report on the division's examination.
Income and Expenses
The table on the previous page summarizes the income, expenses, and distributions of net earnings of the Reserve Banks for 2009 and 2008. Income in 2009 was $54,463 million, compared with $41,046 million in 2008.
Expenses totaled $6,867 million ($3,694 million in operating expenses, $2,187 million in interest paid to depository institutions on reserve balances and earnings credits granted to depository institutions, $98 million in interest expense on securities sold under agreements to repurchase, $386 million in assessments for Board of Governors expenditures, and $502 million for currency costs).19 Net additions to and deductions from current net income showed a net profit of $4,820 million, which consists of $879 million in realized gains on federal agency and government-sponsored enterprise mortgage-backed securities (GSE MBS), $5,588 million in net income associated with consolidated LLCs, $802 million of other additions, and $172 million in unrealized gains on investments denominated in foreign currencies revalued to reflect current market exchange rates. These net additions were offset by a $2,621 million provision for loan restructuring.20 Dividends paid to member banks, set at 6 percent of paid-in capital by section 7(1) of the Federal Reserve Act, totaled $1,428 million, $238 million more than in 2008; this reflects an increase in the capital and surplus of member banks and a consequent increase in the paid-in capital stock of the Reserve Banks.
Distributions to the U.S. Treasury in the form of interest on Federal Reserve notes totaled $47,431 million in 2009, up from $31,689 million in 2008; the distributions equal net income after the deduction of dividends paid and the amount necessary to equate the Reserve Banks' surplus to paid-in capital.
| Item | Average daily assets (+)/ liabilities (-) | Current income (+)/ expense (-) | Average interest rate (percent) | |||
|---|---|---|---|---|---|---|
| 2009 | 2008 | 2009 | 2008 | 2009 | 2008 | |
| U.S. Treasury securities1 | 659,483 | 548,254r | 22,873 | 25,532r | 3.47 | 4.66r |
| Government-sponsored enterprise debt securities1 | 98,093 | 3,983r | 2,048 | 99r | 2.09 | 2.49r |
| Federal agency and government-sponsored enterprise mortgage-backed securities2 | 473,855 | ... | 20,407 | … | 4.31 | … |
| Investments denominated in foreign currencies3 | 24,898 | 24,220r | 296 | 623 | 1.19 | 2.57 |
| Central bank liquidity swaps4 | 177,688 | 161,778r | 2,168 | 3,606 | 1.22 | 2.23r |
| Securities purchased under agreements to resell | 3,616 | 86,227r | 13 | 1,891 | 0.36 | 2.19r |
| Other SOMA assets5 | 458 | … | 1 | … | 0.22 | … |
| Securities sold under agreements to repurchase | -67,837 | -55,169r | -98 | -737 | 0.14 | 1.34 |
| Other SOMA liabilities6 | -182 | … | … | … | … | … |
| Total SOMA holdings | 1,370,072 | 769,293r | 47,708 | 31,014 | 3.48 | 4.03r |
| Primary, secondary. and seasonal credit | 40,405 | 32,254r | 204 | 512 | 0.50 | 1.59r |
| Term auction credit | 291,487 | 174,025r | 786 | 3,305 | 0.27 | 1.90r |
| Total loans to depository institutions | 332,892 | 206,279r | 990 | 3,817 | 0.30 | 1.85r |
| Asset-Backed Commercial Paper Money Market Mutual Fund Liquidity Facility (AMLF) | 7,653 | 21,101r | 73 | 470 | 0.95 | 2.24 |
| Primary Dealer Credit Facility (PDCF) and other broker-dealer credit | 7,502 | 28,401r | 36 | 511 | 0.48 | 1.80r |
| Credit extended to American International Group, Inc. (AIG), net7 | 39,099 | 18,742r | 3,996 | 2,367 | 10.22 | 12.63r |
| Term Asset-Backed Securities Loan Facility (TALF)8 | 23,228 | … | 414 | … | 1.78 | … |
| Total loans to others | 77,482 | 68,244r | 4,519 | 3,348 | 5.83 | 4.91r |
| Total loans | 409,374 | 274,523r | 5,509 | 7,165 | 1.35 | 2.61r |
| Total SOMA holding and loans | 1,779,446 | 1,043,816r | 53,217 | 38,179 | 2.99 | 3.66r |
r Restatements due to changes in previously reported data and recategorization. Return to table
1. Face value, net of unamortized premiums and discounts. Return to table
2. Face value of the securities, which is the remaining principal balance of the underlying mortgages, net of unamortized premiums and discounts. Does not include unsettled transactions. Return to table
3. Includes accrued interest. Investments denominated in foreign currencies are revalued daily at market exchange rates. Return to table
4. Dollar value of foreign currency held under these agreements valued at the exchange rate to be used when the foreign currency is returned to the foreign central bank. This exchange rate equals the market exchange rate used when the foreign currency was acquired from the foreign central bank. Return to table
5. Cash and short-term investments related to the federal agency and government-sponsored enterprise mortgage-backed securities portfolio. Return to table
6. Related to the purchases of Federal agency and government-sponsored enterprise mortgage-backed securities that the seller fails to deliver on the settlement date. Return to table
7. Average daily balance includes outstanding principal and capitalized interest net of unamortized deferred commitment fees and allowance for loan restructuring, and excludes undrawn amounts and credit extended to consolidated VIEs. Return to table
8. Represents the remaining principal balance. Excludes amount necessary to adjust TALF loans to fair value at December 31, which is reported in "Other assets" in the Statement of Condition of the Federal Reserve Banks in Table 9A in the "Statistical Tables" section of this report. Return to table
.... Not applicable. Return to table
In the "Statistical Tables" section of this report, table 10 details the income and expenses of each Reserve Bank for 2009, and table 11 shows a condensed statement for each Reserve Bank for the years 1914 through 2009; table 9 is a statement of condition for each Reserve Bank, and table 13 gives the number and annual salaries of officers and employees for each Reserve Bank. A detailed account of the assessments and expenditures of the Board of Governors appears in the "Board of Governors Financial Statements" in the "Audits of the Federal Reserve System" section of this report.
SOMA Holdings and Loans
The Reserve Banks' average net daily holdings of securities and loans during 2009 amounted to $1,779,446 million, an increase of $735,630 million from 2008 (see table).
SOMA Securities Holdings
The average daily holdings of Treasury securities increased by $111,229 million, to an average daily amount of $659,483 million. The average daily holdings of GSE debt securities increased by $94,110 million, to an average daily amount of $98,093 million. The average daily holdings of federal agency and GSE MBS totaled $473,855 million. The increases are due to the purchase of Treasury securities, GSE debt securities, and federal agency and GSE MBS through the large-scale asset purchase program. Average daily holdings of securities purchased under agreements to resell in 2009 were $3,616 million, a decrease of $82,611 million from 2008, while the average daily balance of securities sold under agreements to repurchase was $67,837 million, an increase of $12,668 million from 2008. Average daily holdings of investments denominated in foreign securities in 2009 were $24,898 million, compared with $24,220 million in 2008. The average daily balance of central bank liquidity swap drawings was $177,688 million in 2009 and $161,778 million in 2008.
The average rates of interest earned on the Reserve Banks' holdings of Treasury and GSE debt securities decreased to 3.47 percent and 2.09 percent, respectively, in 2009. The average rate for federal agency and GSE MBS was 4.31 percent in 2009. The average interest rates for securities purchased under agreements to resell and securities sold under agreements to repurchase were 0.36 percent and 0.14 percent, respectively, in 2009. Investments denominated in foreign currencies and central bank liquidity swaps earned interest at average rates of 1.19 percent and 1.22 percent, respectively, in 2009.
Lending
In 2009, average daily primary, secondary, and seasonal credit extended increased $8,151 million to $40,405 million, and term auction credit extended under the Term Auction Facility increased $117,462 million to $291,487 million. The average rate of interest earned on primary, secondary, and seasonal credit decreased to 0.50 percent in 2009, from 1.59 percent in 2008, while the average interest rate on term auction credit decreased to 0.27 percent in 2009, from 1.90 percent in 2008.
During 2008, the Federal Reserve established several lending facilities under authority of section 13(3) of the Federal Reserve Act. These facilities included the Primary Dealer Credit Facility (PDCF), the Asset-Backed Commercial Paper Money Market Mutual Fund Liquidity Facility (AMLF), and the American International Group, Inc. (AIG) credit extension. Amounts funded by the Reserve Banks under these programs are recorded as loans by the Banks. During 2009, the average daily holdings under the PDCF and AMLF were $7,502 million and $7,653 million, respectively, with average rates of interest earned of 0.48 percent and 0.95 percent, respectively. The average daily balance of credit extended to AIG in 2009 was $39,099 million, which earned interest at an average rate of 10.22 percent.
| Item | Commercial Paper Funding Facility LLC (CPFF)1 | TALF LLC1 | Maiden Lane LLC1 | Maiden Lane II LLC1 | Maiden Lane III LLC1 | Total LLCs | |||||
|---|---|---|---|---|---|---|---|---|---|---|---|
| 2009 | 2008 | 2009 | 2009 | 2008 | 2009 | 2008 | 2009 | 2008 | 2009 | 2008 | |
| Net portfolio assets of the consolidated LLCs and the net position of the New York Reserve Bank (FRBNY) and subordinated interest holders | |||||||||||
| Net portfolio assets2 | 14,233 | 334,910 | 298 | 28,140 | 30,635 | 15,912 | 19,195 | 22,797 | 27,256 | 81,380 | 411,996 |
| Liabilities of consolidated LLCs | -173 | -812 | 0 | -1,137 | -4,951 | -2 | -2 | -3 | -48 | -1,315 | -5,813 |
| Net portfolio assets available3 | 14,060 | 334,098 | 298 | 27,003 | 25,684 | 15,910 | 19,193 | 22,794 | 27,208 | 80,065 | 406,183 |
| Loans extended to the consolidated LLCs by the FRBNY4 | 9,379 | 333,020 | 0 | 29,233 | 29,086 | 16,005 | 19,522 | 18,500 | 24,384 | 73,117 | 406,012 |
| Other beneficial interests4,5 | ... | … | 102 | 1,248 | 1,188 | 1,037 | 1,003 | 5,193 | 5,022 | 7,580 | 7,213 |
| Total loans and other beneficial interests | 9,379 | 333,020 | 102 | 30,481 | 30,274 | 17,042 | 20,525 | 23,693 | 29,406 | 80,697 | 413,225 |
| Cumulative change in net assets since the inception of the program6 | |||||||||||
| Allocated to FRBNY | 4,681 | 1,078 | 20 | -2,230 | -3,402 | -95 | -329 | 0 | 0 | 2,376 | -2,653 |
| Allocated to other beneficial interests | … | … | 176 | -1,248 | -1,188 | -1,037 | -1,003 | -899 | -2,198 | -3,184 | -4,389 |
| Cumulative change in net assets | 4,681 | 1,078 | 196 | -3,478 | -4,590 | -1,132 | -1,332 | -899 | -2,198 | -530 | -7,042 |
| Summary of consolidated LLC net income, including a reconciliation of total consolidated LLC net income to the consolidated LLC net income recorded by FRBNY | |||||||||||
| Portfolio interest income7 | 4,224 | 1,707 | 0 | 1,476 | 1,561 | 1,088 | 302 | 3,032 | 517 | 9,820 | 4,087 |
| Interest expense on loans extended by FRBNY8 | -598 | -620 | 0 | -146 | -268 | -238 | -27 | -296 | -45 | -1,278 | -960 |
| Interest expense–other | 0 | 0 | -2 | -61 | -332 | -33 | -103 | -171 | -28 | -267 | -463 |
| Portfolio holdings gains (losses) | 8 | 3 | 0 | -102 | -5,497 | -604 | -1,499 | -1,239 | -2,633 | -1,937 | -9,626 |
| Professional fees | -30 | -12 | -1 | -55 | -54 | -12 | -5 | -27 | -9 | -125 | -80 |
| Net income (loss) of consolidated LLCs | 3,604 | 1,078 | -3 | 1,112 | -4,590 | 201 | -1,332 | 1,299 | -2,198 | 6,213 | -7,042 |
| Less: Net income (loss) allocated to other beneficial interests | … | … | 699 | -61 | -1,188 | -34 | -1,003 | 1,299 | -2,198 | 1,903 | -4,389 |
| Net income (loss) allocated to FRBNY | 3,604 | 1,078 | -702 | 1,173 | -3,402 | 235 | -329 | 0 | 0 | 4,310 | -2,653 |
| Add: Interest expense on loans extended by FRBNY, eliminated in consolidation | 598 | 620 | 0 | 146 | 268 | 238 | 27 | 296 | 45 | 1,278 | 960 |
| Net income (loss) recorded by FRBNY | 4,202 | 1,698 | 7029 | 1,319 | -3,134 | 473 | -302 | 296 | 45 | 5,588 | -1,693 |
1. CPFF LLC was formed to provide liquidity to the commercial paper market. TALF LLC was formed in 2009 to purchase assets of the Term Asset-Backed Securities Loan Facility, which was formed to improve market conditions for asset-backed securities. Maiden Lane LLC was formed to acquire certain assets of Bear Stearns; Maiden Lane II LLC and Maiden Lane III LLC were formed to acquire certain assets of AIG and its subsidiaries. Return to table
2. TALF, Maiden Lane, Maiden Lane II, and Maiden Lane III holdings are recorded at fair value. Fair value reflects an estimate of the price that would be received upon selling an asset if the transaction were to be conducted in an orderly market on the measurement date. CPFF holdings are recorded at book value, which includes amortized cost and related fees. Return to table
3. Represents the net assets available for repayment of loans extended by FRBNY and "other beneficiaries" of the consolidated LLCs. Return to table
4. Book value. Includes accrued interest. Return to table
5. The other beneficial interest holders are the U.S. Treasury for TALF LLC, JPMorgan Chase for Maiden Lane LLC, and AIG for Maiden Lane II LLC and Maiden Lane III LLC. Return to table
6. Represents the allocation of the change in net assets and liabilities of the consolidated LLCs that are available for repayment of the loans extended by FRBNY and the other beneficiaries of the consolidated LLCs. The differences between the fair value of the net assets available and the face value of the loans (including accrued interest) are indicative of gains or losses that would be incurred by the beneficiaries if the assets had been fully liquidated at prices equal to the fair value. Return to table
7. Interest income is recorded when earned and includes amortization of premiums, accretion of discounts, and paydown gains and losses. Return to table
8. Interest expense recorded by each consolidated LLC on the loans extended by FRBNY is eliminated when the LLCs are consolidated in FRBNY's financial statements and, as a result, the consolidated LLCs' net income (loss) recorded by FRBNY is increased by this amount. Return to table
9. FRBNY earned $1,025 million on TALF loans during the year ended December 31, 2009, which offsets the net loss attributable to TALF LLC. Earnings on TALF loans include interest income of $414 million, gains on the valuation of loans of $557 million, and administrative fees of $54 million. Return to table
... Not applicable. Return to table
Investments of the Consolidated LLCs
Additional lending facilities established during 2008 and 2009, under authority of section 13(3) of the Federal Reserve Act, involved creating and lending to consolidated LLCs.21
The consolidated LLCs were funded by the New York Reserve Bank, and acquired financial assets and financial liabilities pursuant to the policy objectives. The consolidated LLCs were determined to be variable interest entities, and the New York Reserve Bank is considered to be the primary beneficiary of each.22 Consistent with generally accepted accounting principles, the assets and liabilities of these LLCs have been consolidated with the assets and liabilities of the New York Reserve Bank in the preparation of the statements of condition included in this report.23 The proceeds at the maturity or the liquidation of the consolidated LLCs' assets will be used to repay the loans extended by the New York Reserve Bank. Information regarding the Reserve Banks' lending to the consolidated LLCs and the asset portfolios of each consolidated LLC is as described in the table on the previous page.
Federal Reserve Bank Premises
Several Reserve Banks took action in 2009 to upgrade and refurbish their facilities. The multiyear renovation program at the New York Reserve Bank's headquarters building continued, while the St. Louis Reserve Bank continued a long-term facility redevelopment program that now involves renovation of the Bank's headquarters building. The New York Reserve Bank completed a program to enhance the business resiliency of its information technology systems and to upgrade facility support for the Bank's open market operations, central bank services, and data center operations. The New York Reserve Bank also leased space in a nearby office building to accommodate staff growth. The Richmond Reserve Bank completed the construction of a new parking garage adjacent to its headquarters building.
Security-enhancement programs continued at several facilities, including the construction of security improvements to the Richmond Reserve Bank's headquarters building, the construction of a remote vehicle-screening facility for the Philadelphia Reserve Bank, and the design of a remote vehicle-screening facility for the Dallas Reserve Bank.
Additionally, the San Francisco Reserve Bank continued its efforts to sell the former Seattle Branch building.
For more information, see table 14 in the "Statistical Tables" section of this report, which details the acquisition costs and net book value of the Federal Reserve Banks and Branches.
Pro Forma Financial Statements for Federal Reserve Priced Services
| Item | 2009 | 2008 | ||
|---|---|---|---|---|
| Short-term assets (Note 1) | ||||
| Imputed reserve requirements on clearing balances | 317.4 | 418.8 | ||
| Imputed investments | 4,112.9 | 6,211.4 | ||
| Receivables | 49.8 | 60.0 | ||
| Materials and supplies | 1.5 | 2.1 | ||
| Prepaid expenses | 19.4 | 29.2 | ||
| Items in process of collection | 449.7
|
983.1 |
||
| Total short-term assets | 4,950.7 | 7,704.7 | ||
| Long-term assets (Note 2) | ||||
| Premises | 346.3 | 441.1 | ||
| Furniture and equipment | 81.4 | 113.0 | ||
| Leases, leasehold improvements, and long-term prepayments | 76.3 | 76.7 | ||
| Prepaid pension costs | 77.1 | 0.0 | ||
| Prepaid FDIC asset | 31.2 | ... | ||
| Deferred tax asset | 231.4
|
313.2
|
||
| Total long-term assets | 843.7
|
944.0
|
||
| Total assets | 5,794.5 | 8,648.7 | ||
| Short-term liabilities | ||||
| Clearing balances and balances arising from early credit of uncollected items | 3,173.6 | 4,188.5 | ||
| Deferred-availability items | 1,728.3 | 2,779.8 | ||
| Short-term debt | 0.0 | 0.0 | ||
| Short-term payables | 146.9
|
573.5
|
||
| Total short-term liabilities | 5,048.8 | 7,541.8 | ||
| Long-term liabilities | ||||
| Long-term debt | 0.0 | 0.0 | ||
| Accrued benefit costs | 436.8
|
605.6
|
||
| Total long-term liabilities | 436.8
|
605.6
|
||
| Total liabilities | 5,485.5 | 8,147.4 | ||
| Equity (including accumulated other comprehensive loss of $478.3 million and $690.6 million at December 31, 2009 and 2008, respectively) | 309.0
|
501.3
|
||
| Total liabilities and equity (Note 3) | 5,794.5 | 8,648.7 | ||
Note: Components may not sum to totals because of rounding. Amounts in bold reflect restatements due to recategorization. The accompanying notes are an integral part of these pro forma priced services financial statements.
| Item | 2009 | 2008 | ||
|---|---|---|---|---|
| Revenue from services provided to depository institutions (Note 4) | 662.7 | 773.4 | ||
| Operating expenses (Note 5) | 713.8
|
808.7
|
||
| Income from operations | -51.1 | -35.3 | ||
| Imputed costs (Note 6) | ||||
| Interest on float | -3.2 | -22.4 | ||
| Interest on debt | 0.0 | 0.0 | ||
| Sales taxes | 9.1 | 9.4 | ||
| FDIC Insurance | 3.4
|
9.2
|
0.5
|
-12.5
|
| Income from operations after imputed costs | -60.3 | -22.8 | ||
| Other income and expenses (Note 7) | ||||
| Investment income | 16.6 | 181.2 | ||
| Earnings credits | -3.9
|
12.7
|
-80.7
|
100.4
|
| Income before income taxes | -47.6 | 77.6 | ||
| Imputed income taxes (Note 6) | -15.5
|
24.2
|
||
| Net income | -32.1 | 53.4 | ||
| Memo:Targeted return on equity (Note 6) | 19.9 | 66.5 | ||
Note: Components may not sum to totals because of rounding. The accompanying notes are an integral part of these pro forma priced services financial statements.
| Item | Total | Commercial check collection | Commercial ACH | Fedwire funds | Fedwire securities |
|---|---|---|---|---|---|
| Revenue from services (Note 4) | 662.7 | 481.7 | 92.9 | 64.4 | 23.7 |
| Operating expenses (Note 5) | 713.8
|
520.1
|
98.8
|
69.8
|
25.2
|
| Income from operations | -51.1 | -38.4 | -5.9 | -5.4 | -1.4 |
| Imputed costs (Note 6) | 9.2
|
6.0
|
1.6
|
1.3
|
0.4
|
| Income from operations after imputed costs | -60.3 | -44.3 | -7.5 | -6.6 | -1.9 |
| Other income and expenses, net (Note 7) | 12.7
|
9.2
|
1.8
|
1.3
|
0.5
|
| Income before income taxes | -47.6 | -35.2 | -5.7 | -5.4 | -1.4 |
| Imputed income taxes (Note 6) | -15.5
|
-11.5
|
-1.9
|
-1.8
|
-0.5
|
| Net income | -32.1 | -23.7 | -3.8 | -3.6 | -0.9 |
| Memo: Targeted return on equity (Note 6) | 19.9 | 14.4 | 2.9 | 2.0 | 0.7 |
| Cost recovery (percent) (Note 8) | 92.8 | 92.8 | 93.4 | 92.1 | 93.8 |
Note: Components may not sum to totals because of rounding. The accompanying notes are an integral part of these pro forma priced services financial statements.
FEDERAL RESERVE BANKS
Notes to Pro Forma Financial Statements for Priced Services
(1) Short-Term Assets
The imputed reserve requirement on clearing balances held at Reserve Banks by depository institutions reflects a treatment comparable to that of compensating balances held at correspondent banks by respondent institutions. The reserve requirement imposed on respondent balances must be held as vault cash or as balances maintained at a Reserve Bank; thus, a portion of priced services clearing balances held with the Federal Reserve is shown as required reserves on the asset side of the balance sheet. Another portion of the clearing balances is used to finance short-term and long-term assets. The remainder of clearing balances and deposit balances arising from float are assumed to be invested in a portfolio of investments, shown as imputed investments.
Receivables are comprised of fees due the Reserve Banks for providing priced services and the share of suspense-account and difference-account balances related to priced services.
Materials and supplies are the inventory value of short-term assets.
Prepaid expenses include salary advances and travel advances for priced-service personnel.
Items in process of collection are gross Federal Reserve cash items in process of collection (CIPC), stated on a basis comparable to that of a commercial bank. They reflect adjustments for intra-System items that would otherwise be double-counted on a consolidated Federal Reserve balance sheet; adjustments for items associated with nonpriced items (such as those collected for government agencies); and adjustments for items associated with providing fixed availability or credit before items are received and processed. Among the costs to be recovered under the Monetary Control Act is the cost of float, or net CIPC during the period (the difference between gross CIPC and deferred-availability items, which is the portion of gross CIPC that involves a financing cost), valued at the federal funds rate.
(2) Long-Term Assets
Long-term assets consist of long-term assets used solely in priced services, the priced-service portion of long-term assets shared with nonpriced services, an estimate of the assets of the Board of Governors used in the development of priced services, an imputed prepaid FDIC asset (see Note 6), and a deferred tax asset related to the priced services pension and postretirement benefits obligation (see Note 3).
(3) Liabilities and Equity
Under the matched-book capital structure for assets, short-term assets are financed with short-term payables and clearing balances. Long-term assets are financed with long-term liabilities and core clearing balances. As a result, no short- or long-term debt is imputed. Other short-term liabilities include clearing balances maintained at Reserve Banks. Other long-term liabilities consist of accrued postemployment, postretirement, and qualified and nonqualified pension benefits costs and obligations on capital leases.
Effective December 31, 2006, the Reserve Banks implemented the Financial Accounting Standard Board's (FASB) Statement of Financial Accounting Standards (SFAS) No. 158, Employers' Accounting for Defined Benefit Pension and Other Postretirement Plans (codified in FASB Accounting Standards Codification (ASC) Topic 715 (ASC 715), Compensation-Retirement Benefits), which requires an employer to record the funded status of its benefit plans on its balance sheet. In order to reflect the funded status of its benefit plans, the Reserve Banks recognized the deferred items related to these plans, which include prior service costs and actuarial gains or losses, on the balance sheet. This resulted in an adjustment to the pension and benefit plans related to priced services and the recognition of an associated deferred tax asset with an offsetting adjustment, net of tax, to accumulated other comprehensive income (AOCI), which is included in equity. The Reserve Bank priced services recognized a net pension asset in 2009 and a net pension liability in 2008. The increase in the funded status resulted in a corresponding change in AOCI of $(212.3) million in 2009.
To satisfy the FDIC requirements for a well-capitalized institution, equity is imputed at 10 percent of total risk-weighted assets.
(4) Revenue
Revenue represents fees charged to depository institutions for priced services and is realized from each institution through one of two methods: direct charges to an institution's account or charges against its accumulated earnings credits (see Note 7).
(5) Operating Expenses
Operating expenses consist of the direct, indirect, and other general administrative expenses of the Reserve Banks for priced services plus the expenses of the Board of Governors related to the development of priced services. Board expenses were $7.8 million in 2009 and $7.2 million in 2008.
Effective January 1, 1987, the Reserve Banks implemented SFAS No. 87, Employers' Accounting for Pensions (codified in ASC 715). Accordingly, the Reserve Bank priced services recognized qualified pension-plan operating expenses of $121.2 million in 2009 and $28.8 million in 2008. Operating expenses also include the nonqualified pension expense of $2.3 million in 2009 and $5.4 million in 2008. The implementation of SFAS No. 158 (ASC 715) does not change the systematic approach required by generally accepted accounting principles to recognize the expenses associated with the Reserve Banks' benefit plans in the income statement. As a result, these expenses do not include amounts related to changes in the funded status of the Reserve Banks' benefit plans, which are reflected in AOCI (see Note 3).
The income statement by service reflects revenue, operating expenses, imputed costs, other income and expenses, and cost recovery. Certain corporate overhead costs not closely related to any particular priced service are allocated to priced services based on an expense-ratio method. Corporate overhead was allocated among the priced services during 2009 and 2008 as follows (in millions):
| 2009 | 2008 | |
|---|---|---|
| Check | 22.0 | 31.0 |
| ACH | 5.0 | 4.6 |
| Fedwire Funds | 3.3 | 3.5 |
| Fedwire Securities | 1.8
|
1.9
|
| Total | 32.1
|
41.2
|
(6) Imputed Costs
Imputed costs consist of income taxes, return on equity, interest on debt, sales taxes, an FDIC assessment, and interest on float. Many imputed costs are derived from the private-sector adjustment factor (PSAF) model. The cost of debt and the effective tax rate are derived from bank holding company data, which serves as the proxy for the financial data of a representative private-sector firm, and are used to impute debt and income taxes in the PSAF model. The after-tax rate of return on equity is based on the returns of the equity market as a whole and is applied to the equity on the balance sheet to impute the profit that would have been earned had the services been provided by a private-sector firm. On October 9, 2008, the Federal Reserve began paying interest on required reserve and excess balances held by depository institutions at Reserve Banks as authorized by the Emergency Economic Stabilization Act of 2008. In 2009, in contrast to previous years and in light of the uncertainty about the long-term effect that this change would have on the level of clearing balances on the balance sheet, the equity used to determine the imputed profit was adjusted to reflect actual clearing balance levels maintained throughout 2009.
Interest is imputed on the debt assumed necessary to finance priced-service assets; however, no debt was imputed in 2009 or 2008.
Effective in 2007, the Reserve Bank priced services imputed a one-time FDIC assessment credit. In 2009, the credit offset $8.0 million of the imputed $11.4 million assessment, resulting in zero remaining credit. The imputed FDIC assessment also reflects the increased rates and new assessment calculation methodology approved in 2009, which resulted in a prepaid FDIC asset of $31.2 million on the priced services balance sheet.
Interest on float is derived from the value of float to be recovered, either explicitly or through per-item fees, during the period. Float costs include costs for the Check, Fedwire Funds, National Settlement Service, ACH, and Fedwire Securities services.
Float cost or income is based on the actual float incurred for each priced service. Other imputed costs are allocated among priced services according to the ratio of operating expenses, less shipping expenses, for each service to the total expenses, less the total shipping expenses, for all services.
The following shows the daily average recovery of actual float by the Reserve Banks for 2009 in millions of dollars:
| Total float | -1,974.1 |
|---|---|
| Unrecovered float | 4.7 |
| Float subject to recovery | -1,978.8
|
| Sources of recovery of float | |
| As-of adjustments | 2.3 |
| Direct charges | 10.9 |
| Per-item fees | -1,992.0
|
Unrecovered float includes float generated by services to government agencies and by other central bank services. As-of adjustments and direct charges refer to float that is created by interterritory check transportation and the observance of non-standard holidays by some depository institutions. Such float may be recovered from the depository institutions through adjustments to institution reserve or clearing balances or by billing institutions directly. Float recovered through direct charges and per-item fees is valued at the federal funds rate; credit float recovered through per-item fees has been subtracted from the cost base subject to recovery in 2009.
(7) Other Income and Expenses
Other income and expenses consist of investment and interest income on clearing balances and the cost of earnings credits. Investment income on clearing balances for 2009 and 2008 represents the average coupon-equivalent yield on three-month Treasury bills plus a constant spread, based on the return on a portfolio of investments. Before October 9, 2008, the return was applied to the total clearing balance maintained, adjusted for the effect of reserve requirements on clearing balances. As a result of the Federal Reserve paying interest on required reserve and excess balances held by depository institutions at Reserve Banks beginning in October 2008 (see Note 6), the investment return is applied only to the required portion of the clearing balance. Other income also includes imputed interest on the portion of clearing balances set aside as required reserves. Expenses for earnings credits granted to depository institutions on their clearing balances are based on a discounted average coupon-equivalent yield on three-month Treasury bills.
(8) Cost Recovery
Annual cost recovery is the ratio of revenue, including other income, to the sum of operating expenses, imputed costs, imputed income taxes, and targeted return on equity.
1. Financial data reported throughout this chapter--including revenue, other income, costs, income before taxes, and net income--can be linked to the pro forma financial statements at the end of this chapter. Return to text
2. In addition to income taxes and the return on equity, the PSAF includes three other imputed costs: interest on debt, sales taxes, and an assessment for deposit insurance by the Federal Deposit Insurance Corporation (FDIC). Board of Governors assets and costs that are related to priced services are also allocated to priced services; in the pro forma financial statements at the end of this chapter, Board assets are part of long-term assets, and Board expenses are included in operating expenses.
On March, 31, 2009, the Board of Governors requested public comment on a proposal to replace the current correspondent bank model underlying the PSAF calculation with a model based on elements derived from publicly traded firms more broadly. The Board is currently analyzing further the proposed publicly traded firm model and an alternate model based on a peer group of publicly traded payments processors that was suggested by several commenters. Return to text
3. Effective December 31, 2006, the Reserve Banks implemented the Financial Accounting Standards Board's Statement of Financial Accounting Standards (SFAS) No. 158, Employers' Accounting for Defined Benefit Pension and Other Postretirement Plans [Accounting Standards Codification (ASC) Topic 715 (ASC 715), Compensation-Retirement Benefits], which has resulted in the recognition of a $478.3 million reduction in equity related to the priced services' benefit plans through 2009. Including this reduction in equity, which represents a decline in economic value, results in cost recovery of 93.0 percent for the 10-year period. For details on how implementing ASC 715 affected the pro forma financial statements, refer to notes 3 and 5 at the end of this chapter. Return to text
4. Total cost is the sum of operating expenses, imputed costs (interest on debt, interest on float, sales taxes, and the FDIC assessment), imputed income taxes, and the targeted return on equity. Return to text
5. Other income is revenue from investment of clearing balances net of earnings credits, an amount termed net income on clearing balances. Return to text
6. In 2008, the Reserve Banks discontinued the transportation of commercial checks between their check-processing offices. As a result, in 2009, there were no costs or imputed revenues associated with the transportation of commercial checks between Reserve Bank check-processing offices. Return to text
7. The Federal Reserve System's retail payments research suggests that the number of checks written in the United States has been declining since the mid-1990s. For details, see Federal Reserve System, "The 2007 Federal Reserve Payments Study: Noncash Payment Trends in the United States, 2003-2006" (December 2007), www.frbservices.org/files/communications/pdf/research/2007_payments_study.pdf. Return to text
8. The Reserve Banks also offer non-Check 21 electronic-presentment products. In 2009, 1.3 percent of Reserve Banks' deposit volume was presented to paying banks using these products. Return to text
9. The expenses, revenues, volumes, and fees reported here are for transfers of securities issued by federal government agencies, government-sponsored enterprises, and certain international organizations. Reserve Banks provide Treasury securities services in their role as the U.S. Treasury's fiscal agent. These services are not considered priced services. For details, see the "Treasury Securities Service" section later in this chapter. Return to text
10. Credit float occurs when the Reserve Banks present items for collection to the paying bank prior to providing credit to the depositing bank (debit float occurs when the Reserve Banks credit the depositing bank prior to presenting items for collection to the paying bank). Return to text
11. When an institution ends a day with a negative balance, the institution incurs an overnight overdraft. The Federal Reserve strongly discourages overnight overdrafts by imposing penalties and taking administrative action against institutions that incur them repeatedly. Institutions that require overnight credit are encouraged to approach the Federal Reserve's discount window to borrow funds as necessary. Return to text
12. Details about the revisions to the PSR policy are available at www.federalreserve.gov/newsevents/press/other/20081219a.htm, and the current policy is available at www.federalreserve.gov/paymentsystems/psr_policy.htm. Return to text
13. Details about the interim changes are available at www.federalreserve.gov/paymentsystems/psr_policy.htm#streamproc. Return to text
14. Average overdrafts are calculated daily by summing all negative balances incurred by institutions across the Federal Reserve System for each minute of the Fedwire operating day (9 p.m. to 6:30 p.m. ET or 21.5 hours). This sum is then divided by the number of minutes in the day (1,291 minutes) to arrive at the average overdraft. Return to text
15. Peak overdrafts are calculated daily by summing the negative balances of all institutions on a minute-by-minute basis throughout the Fedwire operating day (9 p.m. to 6:30 p.m. ET or 21.5 hours). The most negative of these minute-by-minute balances is the peak overdraft. Return to text
16. FRIT supplies national infrastructure and business line technology services to the Federal Reserve System, and provides thought leadership regarding the System information technology architecture and business use of technology. Return to text
17. NIST is a non-regulatory federal agency within the U.S. Department of Commerce whose mission is to promote U.S. innovation and industrial competitiveness by advancing measurement science, standards, and technology in ways that enhance economic security and improve quality of life. Return to text
18. Each LLC reimburses the Board of Governors for the fees related to the audit of its financial statements from the entity's available net assets. Return to text
19. Effective October 9, 2008, the Reserve Banks began paying explicit interest on reserve balances held by depository institutions at the Reserve Banks as authorized by the Emergency Economic Stabilization Act of 2008. Return to text
20. Represents the economic effect of the reduction of the interest note on loans made to American International Group, Inc. prior to April 17, 2009, as part of the loan restructuring that occurred on that date. Return to text
21. For further information on the establishment and policy objectives of these consolidated LLCs, see the "Monetary Policy and Economic Developments" section of this report. Return to text
22. A VIE is an entity for which the value of the beneficiaries' financial interests in the entity changes with changes in the fair value of its net assets. A VIE is consolidated by the financial interest holder that is determined to be the primary beneficiary of the VIE because the primary beneficiary will absorb a majority of the VIE's expected losses, receive a majority of the VIE's expected residual gains, or it is most closely associated with the VIE. To determine whether it is the primary beneficiary of a VIE, the Reserve Bank evaluates the VIE's design and capital structure and the relationships among the variable interest holders. Return to text
23. As a consequence of the consolidation, the extensions of credit from the New York Reserve Bank to the consolidated LLCs are eliminated, the net assets of the consolidated LLCs appear as assets in table 9 in the "Statistical Tables" section of this report, and the liabilities of the consolidated LLCs to entities other than the New York Reserve Bank, including those with recourse only to the portfolio holdings of the consolidated LLCs, are included in "Other liabilities" in statistical table 9A. Return to text