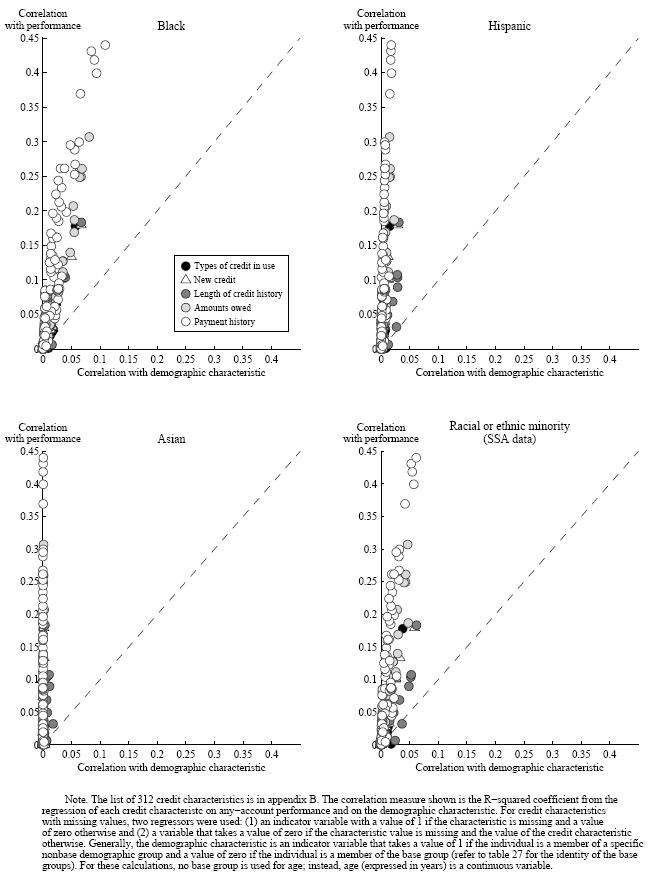
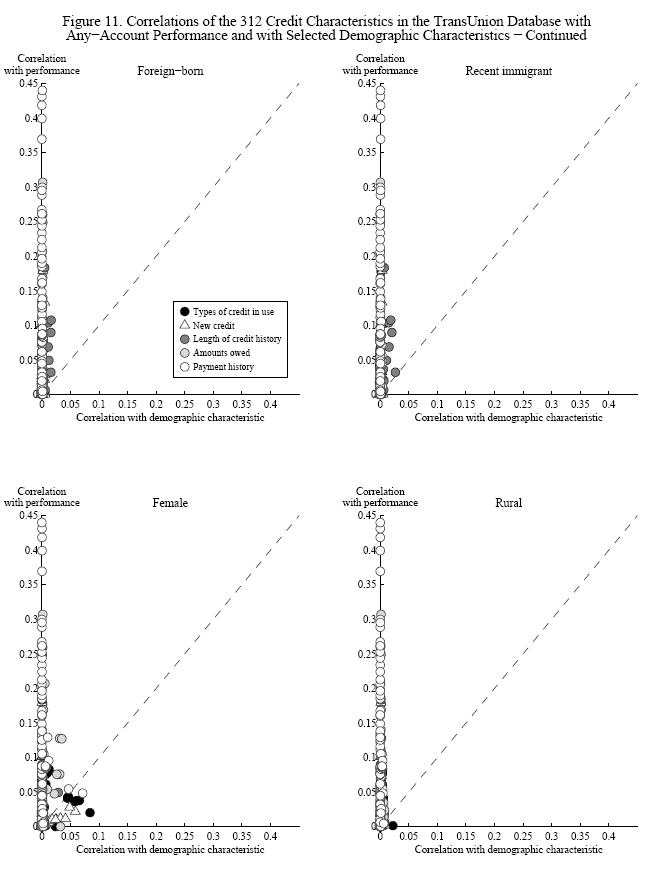
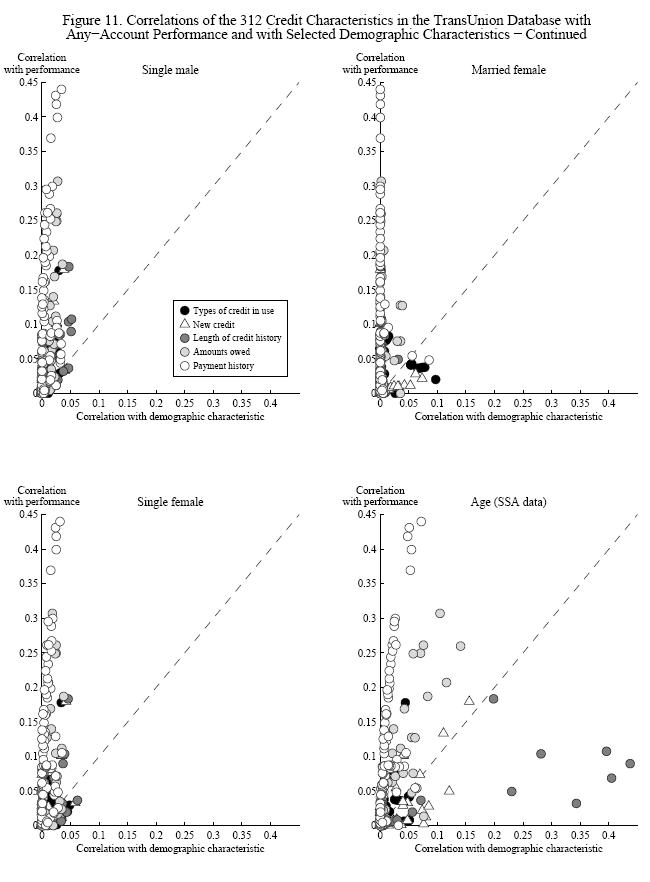
Figure 11. Correlations of the 312 Credit Characteristics in the TransUnion Database with Any-Account Performance and with Selected Demographic Characteristics
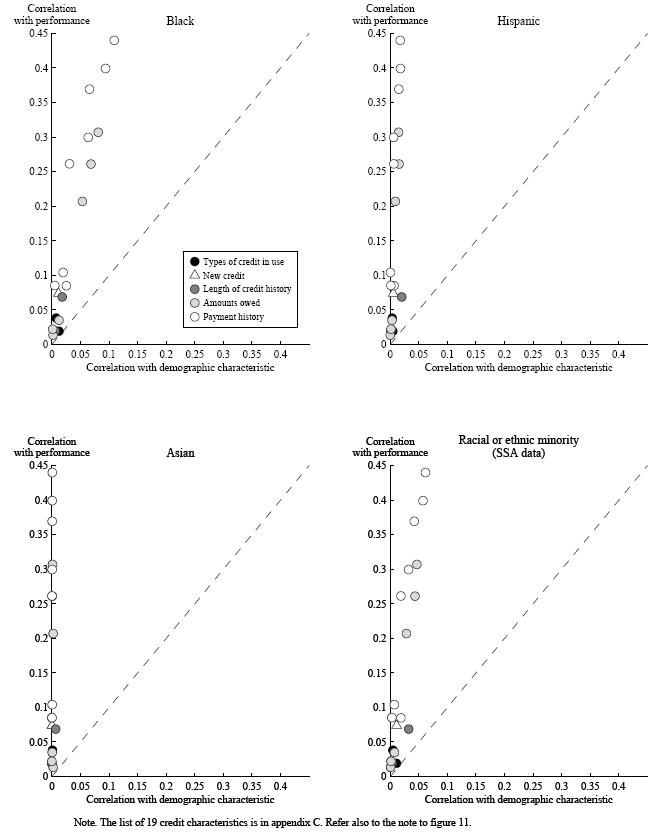
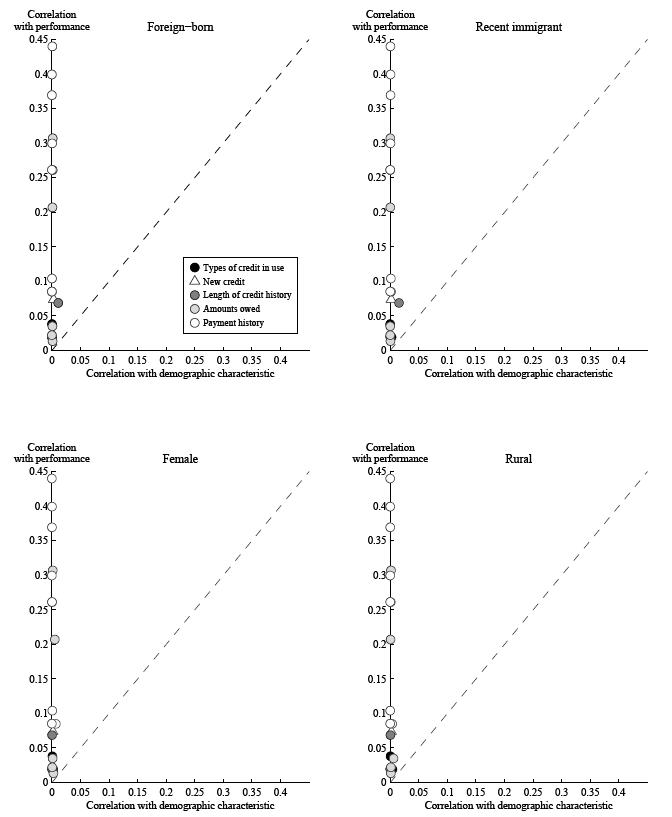
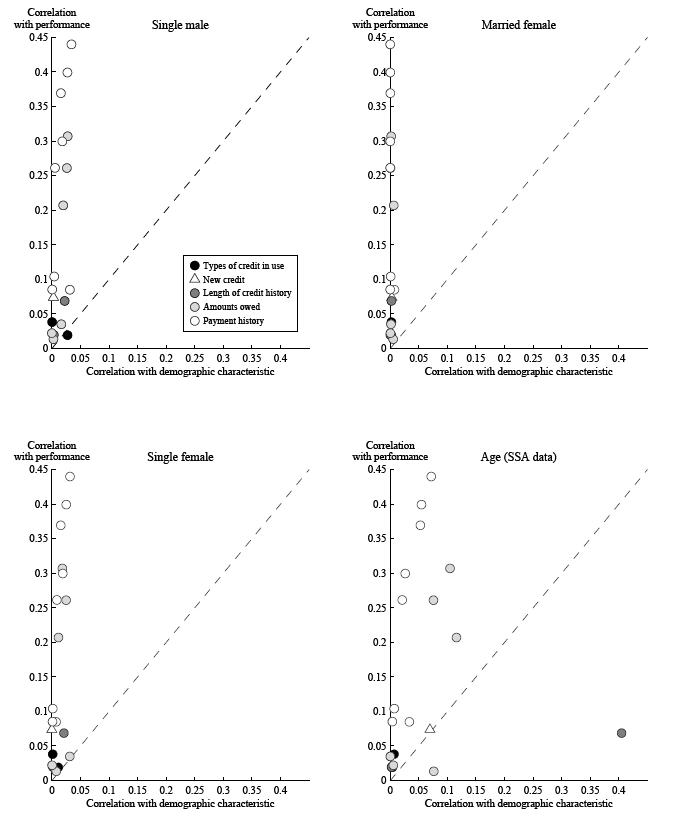
Figure 12. Correlations of the 19 Credit Characteristics in the FRB Base Model with Any-Account Performance and with Selected Demographic Characteristics