
Report to the Congress on the Availability of Credit to Small Businesses
Submitted to the Congress pursuant to section 2227 of the Economic Growth and Regulatory Paperwork Reduction Act of 1996
October 2007
Contents
- Executive Summary
- Flows and Terms of Business Credit
- Credit Use by Small Businesses
- Providers of Credit Lines, Loans, and Leases to Small Businesses
- Special Issues
- Appendix: The 2003 Survey of Small Business Finances
- References
- Footnotes
Executive Summary
Section 2227 of the Economic Growth and Regulatory Paperwork Reduction Act of 1996 requires that, every five years, the Board of Governors of the Federal Reserve System submit a report to the Congress detailing the extent of small business lending by all creditors. The act specifies that the study should identify factors that give policymakers insight into the small business credit market, including the demand for credit by small businesses, the availability of credit, the range of credit options available, the types of credit products used, the credit needs of small businesses, the risks of lending to small businesses, and any other factors that the Board deems appropriate.1
Since 2002, the year of the previous report on the availability of credit to small businesses, financing flows to both large and small firms have generally increased along with economic activity. From 2002 through June 2007, credit conditions were favorable for small and large firms, and there is no evidence that creditworthy borrowers faced substantial credit supply constraints during that period.2 More recently, financial markets have been volatile, but financing conditions for small businesses appear to have held up fairly well. The demand for credit by small businesses generally tracked the pattern of debt growth for nonfinancial businesses: Indicators of small business financing needs suggest that demand picked up in 2004 from low levels in 2003 but moderated in 2006 and early 2007. Equity financings, although well below their record pace of the late 1990s, have been solid and have steadily increased since 2003.
Small businesses--generally defined as firms having fewer than 500 employees--contribute significantly to the strength and vigor of the U.S. economy. Together they employ more than one-half of private-sector workers and produce more than one-half of the private-sector output. Large and successful companies often begin as smaller firms that prosper and grow. Likewise, most of the new firms that form and help the economy adapt to change start as small businesses.
The concerns of the Congress and other policymaking bodies about small business financing stem from the perception that small firms have more difficulty gaining access to credit sources than do large businesses or other types of borrowers. The source of this difficulty may be that lending to small businesses is generally considered riskier and more costly than lending to larger firms. Small businesses are much more affected by swings in the economy and have a much higher failure rate than larger operations.
In addition, lenders historically have had difficulty determining the creditworthiness of applicants for some small business loans. The heterogeneity across small firms, together with widely varying uses of borrowed funds, has impeded the development of general standards for assessing applications for small business loans and has made evaluating such loans relatively expensive. Lending to small businesses is further complicated by the fact that reliable information on the creditworthiness of a small business is often difficult to obtain because little, if any, public information exists about the performance of most small businesses. Small businesses rarely have publicly traded equity or debt securities, and many small businesses also lack detailed balance sheets and other financial information often used by lenders in making underwriting decisions.
Financial institutions, especially commercial banks, are often portrayed in the economics literature as having an advantage in dealing with information problems. Through interactions with a firm that uses its financial services, the lending institution can obtain additional information about the firm's activities, ownership, financial characteristics, and prospects that is important in deciding whether to extend credit. Employing what is often called "relationship financing," lenders can use information gathered over time through long-term relationships with business owners and other members of the local community to monitor the health of the business and to build appropriate incentives into loan agreements.
The 2003 Survey of Small Business Finances (SSBF) provides the most comprehensive and up-to-date information on small business finance available.3 The survey shows that among small businesses, larger firms were more likely than smaller firms to use each of the traditional credit types: credit lines, capital leases, motor vehicle loans, mortgages, equipment loans, and other loans.4 However, whether this pattern reflects a greater need for credit at larger firms or whether lenders are simply more willing to extend credit to larger firms is unclear. The relationship between firm age and credit use is similar to the relationship between size and use--that is, younger firms use fewer of the credit products.
Patterns of credit use by small businesses observed in data from the 2003 SSBF were similar to the patterns in the 1998 SSBF. The most significant difference was the greater use of lines of credit in 2003 than in 1998, which could be due in part to some financial institutions relying more heavily on credit scoring to evaluate certain loan applications.
Besides having access to traditional sources of credit, small businesses have alternative means of financing available, including credit cards, trade credit, and owner loans. Among these alternatives to traditional credit products, only business credit cards registered an appreciable increase in usage between 1998 and 2003. Although most small firms used credit cards and trade credit, the rapid payment of outstanding balances by a large percentage of these firms suggests that much of the use of these products was for convenience rather than for longer-term financing of expenses.
Some small businesses may have wanted to use more credit than was reflected on the 2003 SSBF but were unable to obtain it. Credit application behavior and denial and approval patterns provide information on the credit demands of small firms. According to the 2003 SSBF, slightly more than one-fifth of small businesses applied for new credit between 2000 and 2003. Larger firms were more likely than small firms to apply for new credit and were more likely to have their applications approved. Application rates for younger and older firms were similar, but younger firms were more likely than older firms to be denied credit. The finding that smaller and younger firms have their loan applications denied more frequently is consistent with the conventional wisdom that these firms are riskier, have shorter credit histories or less collateral to pledge as security, and are more informationally opaque.
Some firms that may have wanted additional credit may not have applied because they expected that their applications would be denied. In fact, 18 percent of the SSBF respondents indicated that, between 2000 and 2003, they had forgone applying when they needed credit because they expected to be turned down. The survey data show that younger and smaller firms were more likely to forgo applying for credit, a sign that the demand for credit at such firms may have been higher than the data on credit use indicate. However, some firms that failed to apply at some point between 2000 and 2003 were not shut out of the credit market because they often applied for, and sometimes received, credit at other times.
Small businesses obtain credit from a wide range of sources, including commercial banks, savings institutions, credit unions, finance companies, nonfinancial firms, and individuals such as family members or friends. According to the 2003 SSBF, of these sources, commercial banks are the leading provider: They supplied credit lines, loans, and leases to slightly more than two-thirds of small firms that obtained a traditional form of credit from any source. Banks were also the most common source of credit lines, mortgages, and equipment loans, and they were the second most common source, after finance companies, of automobile loans.
Because banks are the leading source of traditional credit to small business, much attention has been paid to developments in banking that may influence credit availability. The substantial consolidation of the banking industry over the past twenty years is one such development. Mergers and acquisitions have dramatically reduced the number of banks, thereby increasing the importance of large institutions and the concentration of industry assets. These changes to the structure of the industry have raised concerns about possible reductions in the availability of credit to small businesses. Although larger banks supply the majority of bank loans to small businesses, they tend to be proportionately less committed than smaller banks to small business lending.
The evidence suggests that the thousands of small banks still in operation continue to account for a meaningful share of small business lending activity--measured by holdings of business loans equal to or less than $1 million and equal to or less than $100,000--despite their declining numbers and the commensurate fall in their share of industry assets.5 For example, in 2006, banks with assets of $250 million or less accounted for 73.1 percent of all banking organizations but only 5.4 percent of all banking assets. However, they held 16 percent of bank business loans of $1 million or less and 21.3 percent of such loans of $100,000 or less. In addition, the results of studies that directly analyze the relationship between bank consolidation activity and the availability of credit to small businesses tend to suggest that although mergers and acquisitions may sever existing bank-firm relationships and may introduce some short-term uncertainty, overall they have not reduced credit availability to small businesses. After a merger, any reduction in small business lending by the newly consolidated bank is generally offset by an increase in small business lending by other banks.
Analysis of patterns within local areas is likely to capture the relevant structural conditions that face small firms seeking credit and that influence the level of competition in the market for small business loans. Data from the SSBF indicate that small businesses tend to obtain loans, leases, and lines of credit from providers located near them. For example, in 2003, the median distance between a small business and its lender was 11 miles, and in 66 percent of all business lending relationships the lender was located within 30 miles of the firm's headquarters. Among lending relationships with banks and thrifts of all sizes, the median distance between a small business and its depository institution was 4 miles, and 83 percent of lenders were located within 30 miles of the firm's headquarters. The proximity offers small firms convenient access to their lenders and suggests that credit providers focus their lending activities on entities with which they are familiar, partly because such entities are nearby.
Measures of the concentration of local banking markets are used to assess the likely competitive conditions that face small businesses seeking credit. In 2006, the average urban market was moderately concentrated with respect to banking deposits and had an average of twenty-eight banks with 193 offices.6 The average rural area had fewer banks and was highly concentrated. However, comparing these statistics with those of earlier years, we find that despite the significant amount of consolidation in the banking industry, local banking markets do not appear to have become less competitive. Generally, in both rural and urban markets, the number of banks and offices has remained constant or increased somewhat, whereas the concentration measures have either remained constant or decreased somewhat. Modest deconcentration, in conjunction with a small increase in the number of banks, suggests that the availability of credit from commercial banking organizations probably has not declined in recent years.
Savings institutions, defined as savings banks and savings and loan associations, provide much less credit to small businesses than do commercial banks. The differences between the lending volumes of the two groups of institutions reflect both the disparity in overall size between the two groups and the lower proportion of small business lending conducted by the typical savings institution. Among savings institutions, the most active, or leading, lenders to small businesses were not necessarily the largest institutions in terms of assets. A comparison of the shares of small business lending by thrifts for 2002 with the corresponding data for 2006 indicates that the leading savings institutions in terms of small business activity have been accounting for an increasing share of outstanding business loans in both loan-size categories of interest--equal to or less than $1 million and equal to or less than $100,000--while the share of industry assets for these institutions has remained relatively constant. This finding suggests that although some thrifts have increasingly specialized in small business lending, they are not predominantly the largest institutions.
Credit scoring may lead to an increase in the availability of credit for small businesses, in part because it may increase the consistency, objectivity, and speed of credit evaluations while lowering the cost of gathering relevant information. In addition, it may have the potential to increase a lender's ability to accurately predict loan performance and may increase access to capital markets. Credit scoring has been used for more than thirty years in underwriting consumer loans but only since the early to mid-1990s in small business lending (Board of Governors, 2007).
Except for a few banks that have developed proprietary models, most organizations use scoring models obtained from outside vendors, the largest of which is Fair Isaac Corporation. The reliance by a large proportion of the industry on one vendor's model has raised concerns that the resulting problems could be widespread if the model performs poorly. It is not clear how small business credit-scoring models perform relative to traditional reviews of such loans, especially during a major economic slowdown. However, users of the models generally report that, after their adoption, (1) the riskiness of the small business portfolio either remains about the same or declines and (2) the quality of the typical credit decision increases.
Evidence regarding the effect of credit scoring on credit availability is consistent with proponents' claims that the use of scoring models increases the availability of credit to some small businesses. However, concerns have been raised that the continued adoption of credit-scoring techniques may reduce the availability of credit for small firms that find it hard to qualify for loans based only on a formal credit score. At this time, it is unclear how often creditworthy firms that would not qualify for credit-scored products would be able to obtain financing from a lender that relied on traditional methods of loan evaluation. Nonetheless, community banks and other local lenders are likely to continue to provide this valuable service to many small firms that would not qualify for credit-scored loans, especially if loans are priced appropriately.
The securitization of small business loans is a development that could substantially influence the availability of credit. Potential benefits exist for lenders, borrowers, and investors. However, the obstacles to securitizing loans to small businesses are large, especially with loans not backed by a guarantee from the Small Business Administration. Securitization has so far remained modest, and recent developments suggest that the volume of securitized small business loans is unlikely to increase substantially over the next several years.
Community reinvestment activities help financial institutions meet the financing needs of small businesses. Beyond conducting lending programs that are part of a bank's normal operating process, banks often develop or work with specially created entities focused on providing credit in underserved communities. Some of these entities operate wholly within a bank's legal structure, some are partnerships with other service providers, and still others are standalone organizations in which banks invest. These programs encourage capital to flow where it otherwise might not.
Numerous trends in the community development field either are just beginning to significantly influence the delivery of capital to small businesses by financial institutions or have the potential to do so in the near future. Some of these trends--for example, the proliferation of financial literacy and outreach programs--are due primarily to the actions of financial services firms themselves. Others are due to the actions of government--such as the New Markets Tax Credit--to stimulate more lending. Still other trends involve new hybrid partnerships among banks and nonbank entities such as local microloan funds. These trends, should they continue, are likely to result in improved access to credit and capital for small businesses.
Flows and Terms of Business Credit
Since 2002, the year of the previous report on the availability of credit to small businesses, business financing flows to both large and small firms have generally increased along with economic growth. Credit conditions have been favorable for small and large firms, and there is no evidence that creditworthy borrowers have faced substantial credit supply constraints.7
Aggregate Business Financing
The recession of 2001 was marked by sharp reductions in the rate of real investment. Investment began to rebound in 2003 and has continued to rise since then, in part because of favorable credit conditions. Growth in total nonfinancial business debt, which mirrored these developments, surged from an annual rate of about 3 percent in 2002 and 2003 to a rate of 9 percent in the first quarter of 2007 (figure 1). As a result, the ratio of total nonfinancial business debt to gross domestic product (GDP) has increased to about 68 percent, the highest level in more than two decades.
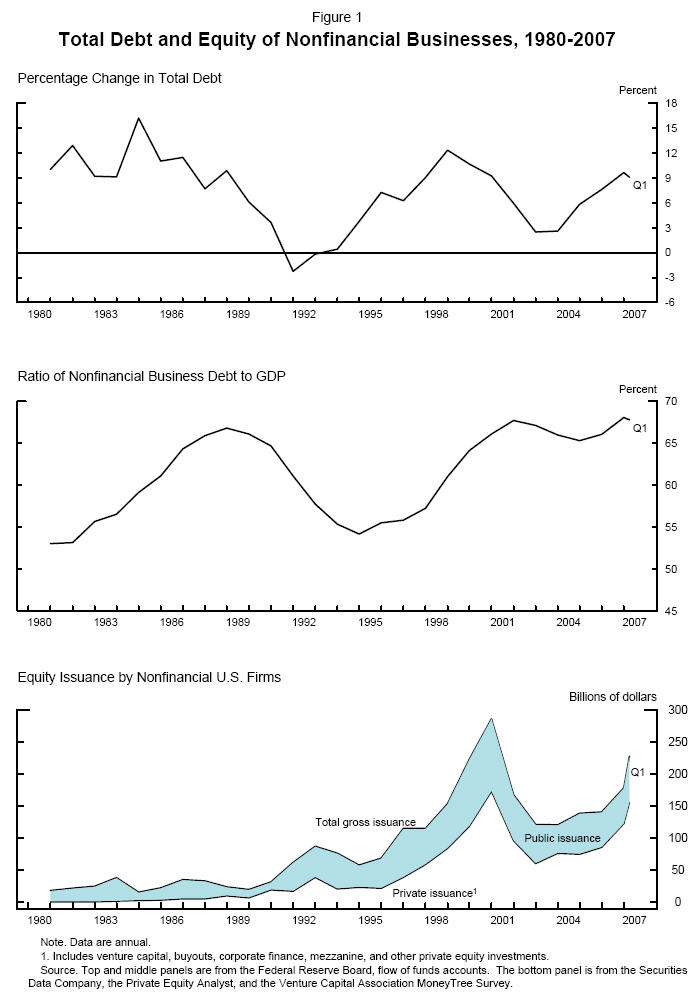
Gross equity issuance by nonfinancial firms has also risen since 2002 (figure 1). Public equity issuance, through both initial and seasoned offerings, has maintained a steady but moderate pace by historical standards. In contrast, private issuance, boosted by the recent wave of leveraged-buyout transactions, has risen sharply from an annual rate of about $60 billion in 2002 to a pace of about $150 billion in the first quarter of 2007. Even so, net equity issuance, already negative in 2002, became even more negative over the period because of a surge in retirements of equity through cash-financed mergers (including leveraged buyouts) and share buybacks.
Financing by Nonfinancial Corporations
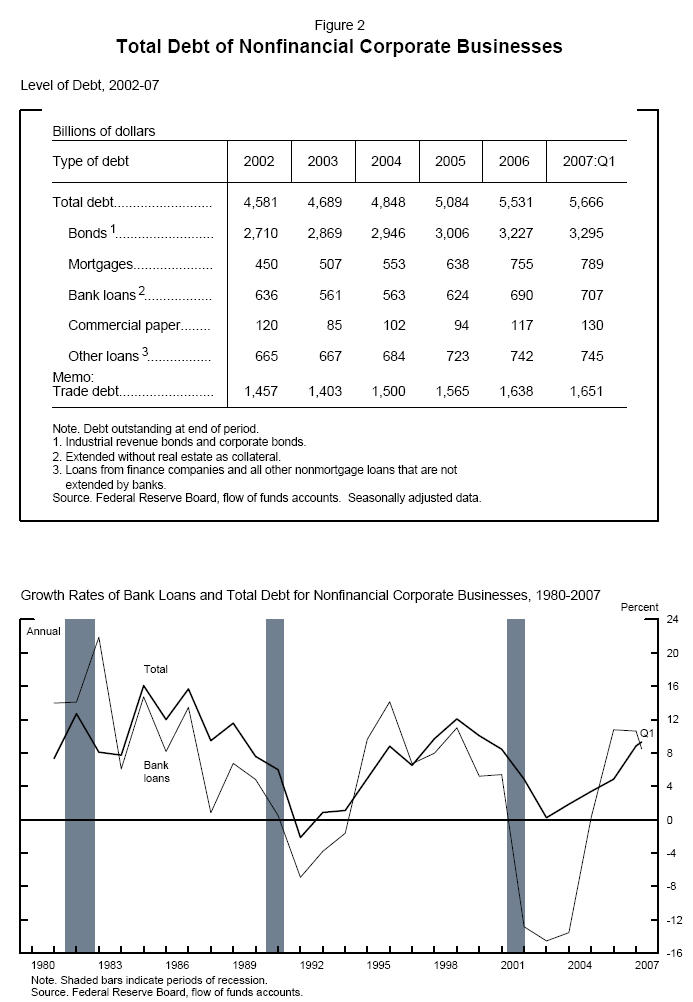
Growth in total nonfinancial corporate debt has risen steadily in the past five years (figure 2). It increased from an annual rate of a bit above zero in 2002 to a pace of about 9 percent in the first quarter of 2007. Corporate debt growth in 2003 and 2004 was weak; the small increase was due mainly to bond issuance, as decreases were recorded in bank loans extended without real estate as collateral and in commercial paper. Since then, nearly all components of corporate debt growth have expanded because of robust merger and acquisition activity and rising outlays for investment goods.
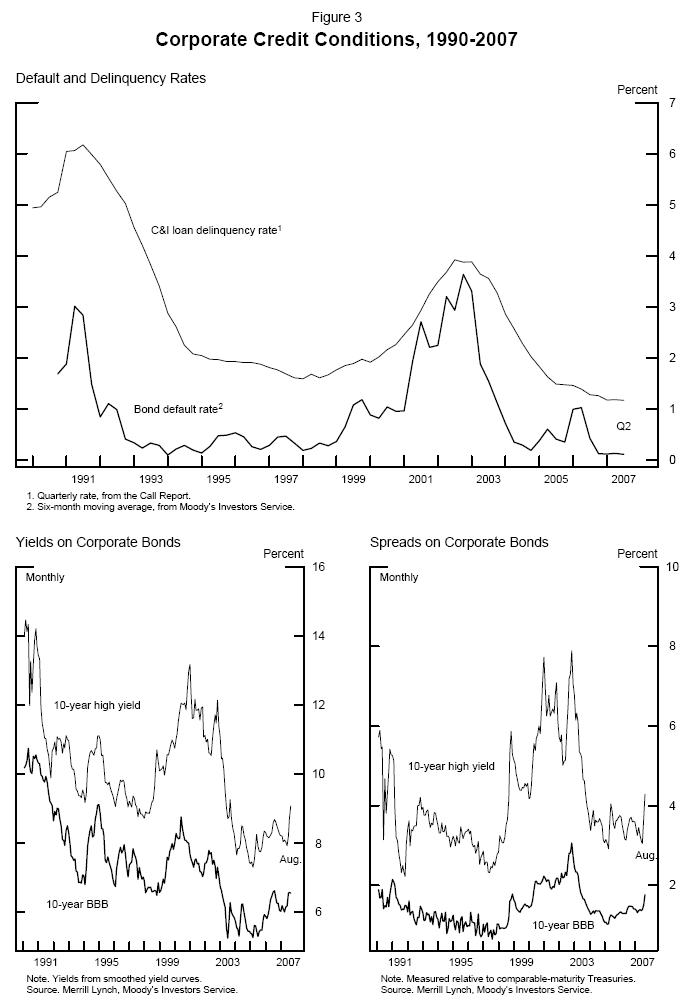
Improving financing conditions for firms in public capital markets and at banks may also have contributed to the increases in corporate debt growth since 2002. Default rates on corporate bonds and on commercial and industrial loans fell substantially to near-historic lows (figure 3). Yields on BBB-rated and high-yield corporate bonds also declined, and their spreads to yields on comparable-maturity Treasury securities remained at the low end of their historical ranges through the first half of 2007. Bond spreads have risen noticeably in recent months but are still far below their peaks in 2002. Relatively narrow yield spreads are consistent with strong overall corporate balance sheets.
Financing by Small Business
Comprehensive data that directly measure the financing activities of small businesses are nonexistent. However, various sources of information can serve as proxies for small business activity and can be used to identify patterns of small business financing. These sources suggest that financing flows to small firms weakened a bit in 2003 but have generally been robust since then.
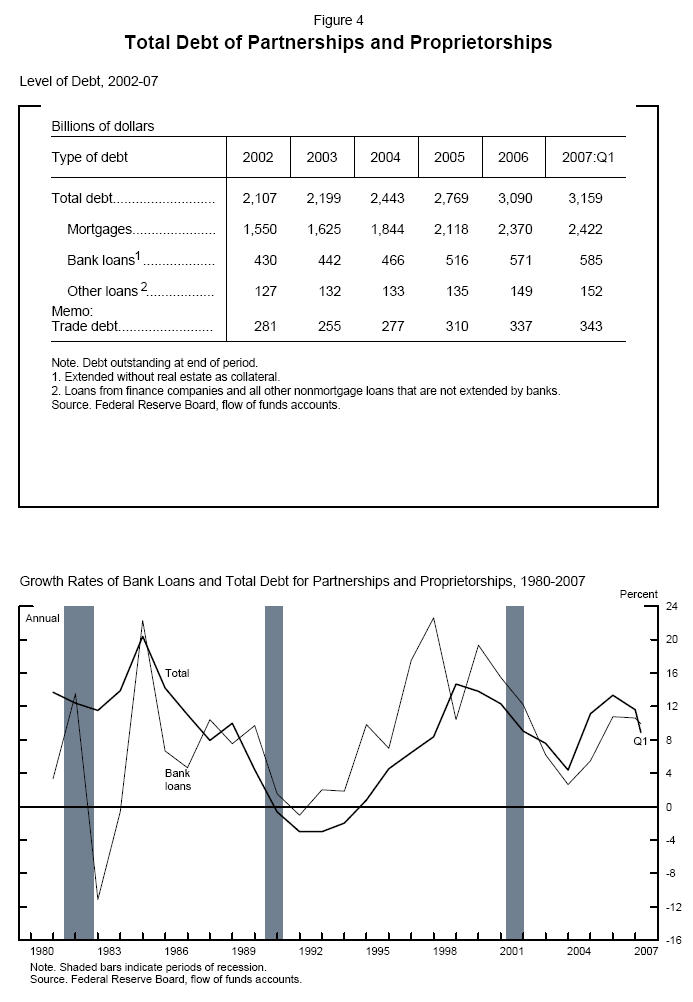
Total small business debt, estimated as the total debt of partnerships and proprietorships, reached $3.1 trillion in the first quarter of 2007 (figure 4).8 Growth in small business debt declined to about 4 percent in 2003, but it rose to about 12 percent in 2005 before moderating a touch over the next two years. Growth in two of the three components of total small business debt--mortgage debt and bank loans extended without real estate as collateral--followed a roughly similar pattern. Commercial bank loans (both with and without real estate as collateral) with principal less than or equal to $1 million, often extended to small firms, have shown modest but steady growth since 2003 (table 1).
| Size of loan and year | All | Commercial and industrial | Nonfarm nonresidential real estate | |
|---|---|---|---|---|
| Amount outstanding, June 30 (billions of dollars) | ||||
| Small business loans ($1 million or less) | ||||
| 2002 | 471.6 | 239.0 | 232.6 | |
| 2003 | 482.5 | 234.7 | 247.8 | |
| 2004 | 504.2 | 239.4 | 264.8 | |
| 2005 | 523.6 | 244.1 | 279.6 | |
| 2006 | 549.8 | 250.8 | 299.0 | |
| Change1 (percent) | ||||
| 2003 | 2.3 | -1.8 | 6.5 | |
| 2004 | 4.5 | 2.0 | 6.9 | |
| 2005 | 3.8 | 2.0 | 5.6 | |
| 2006 | 5.0 | 2.7 | 6.9 | |
| Amount outstanding, June 30 (billions of dollars) | ||||
| Microloans ($100,000 or less) | ||||
| 2002 | 120.0 | 89.2 | 30.9 | |
| 2003 | 115.9 | 86.5 | 29.4 | |
| 2004 | 113.1 | 85.2 | 27.9 | |
| 2005 | 112.7 | 85.2 | 27.5 | |
| 2006 | 115.2 | 89.2 | 26.0 | |
| Change1 (percent) | ||||
| 2003 | -3.4 | -3.0 | -4.9 | |
| 2004 | -2.4 | -1.5 | -5.1 | |
| 2005 | -.4 | .0 | -1.4 | |
| 2006 | 2.2 | 4.7 | -5.5 | |
Note. Small business loans are business loans of $1 million or less; microloans, a subset of small business loans, are for $100,000 or less. U.S. commercial banking organizations are insured U.S. domestically chartered banks excluding credit card institutions and U.S. branches and agencies of foreign banks. Details may not sum to totals because of rounding.
1. Change is from June of preceding year to June of year indicated. Return to table
Source. Call Reports (June 30), various years.
Indicators of small business financing needs suggest that demand picked up in 2004 from low levels but moderated in 2006 and 2007. The demand for small business financing can be inferred from small business investment plans, as reported in surveys conducted by the National Federation of Independent Business (NFIB).9 According to the surveys, the net percentage of firms that planned capital outlays and the net percentage that anticipated business expansions were low by historical standards in 2002 and 2003, rose to above-average levels in 2004 and 2005, but then reverted to low levels in 2006 and 2007 (figure 5). Data on demand for commercial and industrial loans, as reported in the Federal Reserve's Senior Loan Officer Opinion Survey on Bank Lending Practices, show a similar up-and-down pattern over the period.
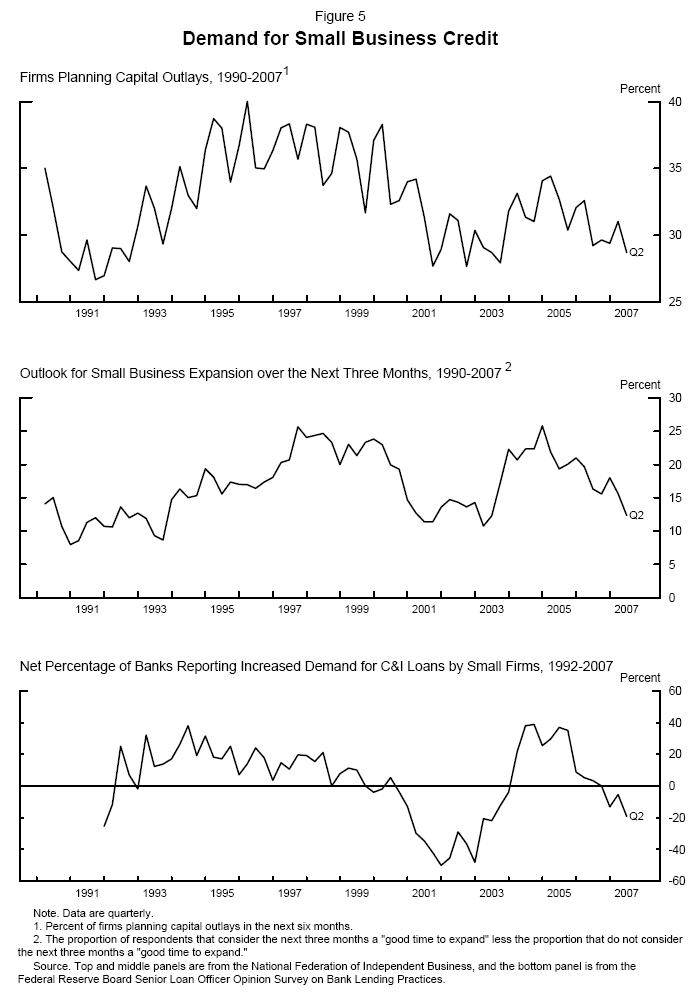
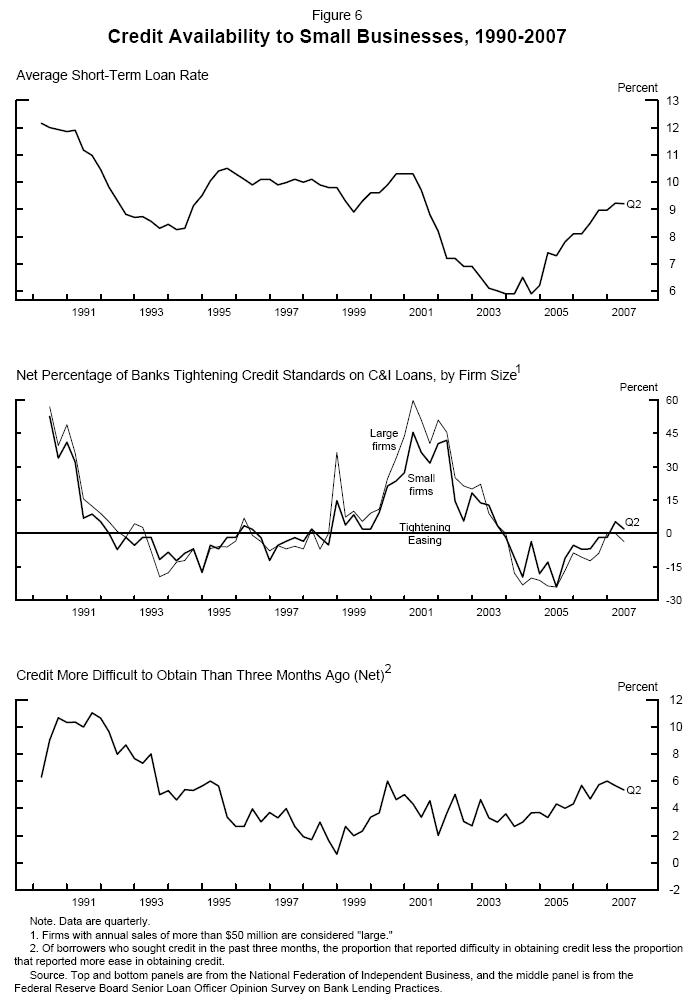
Credit conditions at banks for small businesses have been favorable, for the most part, since 2002. Results from the Senior Loan Officer Opinion Survey indicate that lending standards for small borrowers were tightened a bit in 2002 and 2003, were loosened substantially in each of the subsequent three years, and were about unchanged in the first part of 2007 (figure 6). Responses to other questions in the survey suggest that the general easing of standards since 2004 is due mainly to the favorable economic outlook and the increased competition among banks and other nonbank lenders. Since 2002, the net percentage of NFIB respondents reporting that credit had become more difficult to obtain remained low through the first half of 2007 by historical standards, even as the average short-term interest rate paid by NFIB respondents increased from a low of 6 percent in 2004 to about 9 percent in the first half of 2007.10
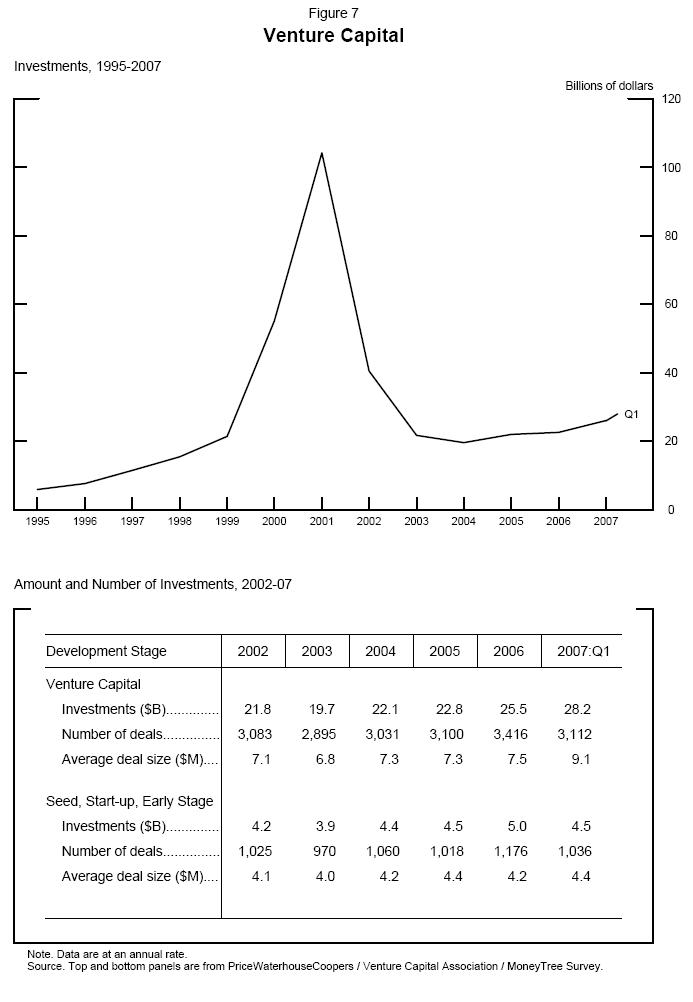
Although well below its record pace of the late 1990s, financing to small business with the potential for significant growth has been solid since 2002. Venture capital investments edged down a bit from $22 billion in 2002 to $20 billion in 2003, have steadily increased since then, and are on pace to reach $28 billion in 2007 (figure 7). Financing of firms at very early stages of development followed a similar pattern.
Credit Use by Small Businesses
This section examines the composition and borrowing behavior of small firms to identify characteristics that are associated with important patterns of credit use. It also discusses the special role that small business plays in the U.S. economy and the unique challenges they face in obtaining credit.
Small Business: Definition and Background
Defining what is meant by "small business" is the first step in conducting a policy-relevant analysis of the financing needs of small business; it is also difficult. The financing needs are very different for a "mom and pop" grocery store, a microenterprise in the inner city, a start-up high-tech firm, a business that is ready to expand from early-stage growth to the next higher level, or a business that has neared the point of issuing public debt or equity. Yet the term "small business" encompasses all of these. According to a broad guideline used by the U.S. Small Business Administration (SBA), a small business is a firm or enterprise with fewer than 500 employees. This definition encompasses more than 99 percent of all businesses in the United States.
The vast majority of small businesses are modest in size. The 2003 Survey of Small Business Finances (SSBF), which is representative of more than 6.3 million nonfarm, nonfinancial businesses with fewer than 500 workers, estimates that more than 91 percent of these businesses have fewer than twenty employees (including working owners) and that three-fifths have fewer than five (table A.1).
Just more than half of the small businesses were organized as proprietorships (44.5 percent) or partnerships (8.7 percent) in 2003. The remainder were organized as either S corporations (31 percent) or C corporations (15.7 percent). The primary difference between the two types of corporations is that C corporations are subject to corporate income tax. However, S corporations are legally constrained to have no more than seventy-five shareholders, are restricted to one class of stock, and to avoid income tax liability, must pass all income to the owners at the end of each fiscal year. In recent years, the S corporation organizational form has become more popular. Between 1998 and 2003, the share of firms organized as S corporations increased from 24 percent to 31 percent, while the share organized as C corporations and that organized as proprietorships declined, respectively, from 20 percent to 15.7 percent and from 49 percent to 44.5 percent.
Two other organizational forms gained legal status in several states during the latter 1990s: the limited liability corporation (LLC) and the limited liability partnership (LLP). LLCs share many characteristics of partnerships but also have the limited liability of a corporation. LLPs are partnerships in which an investor's liability is limited to his or her initial investment. In this report, LLCs and LLPs are classified as partnerships, corporations, or proprietorships according to the way they file their taxes. LLCs may file taxes as partnerships, sole proprietorships, or corporations, and LLPs may file as either partnerships or corporations.
Small businesses operate in every major segment of the U.S. economy. The most common industry for small businesses in 2003 was business services, which accounted for one-fourth of small firms (table A.1). Another fourth of small businesses were in the retail (18.4 percent) and wholesale (5.9 percent) trade sectors. The remaining half of small businesses were involved in professional services (20.6 percent), construction and mining (11.8 percent), insurance and real estate (7.2 percent), transportation (3.8 percent), and manufacturing (7.1 percent).
In 2003, 94 percent of the small businesses in the United States had owners who actively participated in the firm's management, 85.9 percent had a single office, and 79.4 percent were located in urban areas. Geographically, small businesses were widely dispersed throughout the nation, with 19.8 percent in the Northeast, 21.1 percent in the Midwest, 24.4 percent in the West, and the remaining 34.7 percent in the South. A demographic breakdown of the universe of nonfarm, nonfinancial small businesses in the United States according to the 2003 SSBF appears in table A.1.
Small businesses contribute significantly to the strength and vigor of the U.S. economy. According to the SBA, firms with fewer than 500 employees employ more than one-half of private-sector workers and produce more than one-half of the private-sector output. They account for 99.9 percent of all firms. Large and successful companies often begin as smaller firms that prosper and grow. In 2005, the latest year for which data are available, the estimated number of employer firm births, at 671,800, was higher than the number of deaths, at 544,800, for a net change of 127,000 new employer businesses (a net annual growth rate of 2.2 percent). Firms with fewer than 500 employees accounted for 99.9 percent of all firm births and deaths (U.S. Small Business Administration, 2006, p. 10).
The concerns of the Congress and other policymaking bodies about small business financing stem from the perception that small firms have more difficulty gaining access to credit sources than do large businesses or other types of borrowers. The source of this difficulty may be the greater riskiness of small firms and the associated high costs of evaluating and monitoring credit risks, or it may be inefficiencies in markets that hinder pricing of risk or impede the effective pooling of risks. To the extent that private-market impediments or inefficiencies are the source of any difficulties for small business financing, policymakers may focus on changes that reduce these constraints. In this case, no one policy prescription would likely work for all, and no one definition of small business would be appropriate. As discussed in this report, credit needs and borrowing sources differ widely among small businesses.
Risks of Lending to Small Businesses
Lending to small businesses is generally considered riskier and more costly than lending to larger firms. Small businesses tend to be much more affected by swings in the economy and have a much higher failure rate than larger operations.11 In addition, lenders historically have had difficulty determining the creditworthiness of applicants for some small business loans. The heterogeneity across small firms, together with widely varying uses of borrowed funds, has impeded the development of general standards for assessing applications for small business loans and has made evaluating such loans relatively expensive.
Lending to small businesses is further complicated by the "informational opacity" of many such firms. Obtaining reliable information on the creditworthiness of a small business is often difficult because little, if any, public information exists about the performance of most small businesses. Small businesses rarely have publicly traded equity or debt securities, and public information on such firms is typically sparse. Many small businesses also lack detailed balance sheets and other financial information often used by lenders in making underwriting decisions.
The cost to the lender does not end with the decision to grant a loan. Small business lenders typically have had to monitor the credit arrangement with individual borrowers. For very small firms, a close association between the finances of the business and those of the owner may increase loan-monitoring costs.
Historically, the relatively elevated costs of evaluating small business applications and the ongoing costs of monitoring firm performance have made loans to small businesses less attractive for some lenders, especially because, when expressed as a percentage of the (small) dollar amount of the proposed loan, these non-interest costs are often quite high relative to loans to middle-market or large corporate borrowers. Financial institutions, especially commercial banks, are believed to have an advantage in dealing with information problems. Through interactions with a firm that uses its financial services, the lending institution can obtain additional information about the firm's activities, ownership, financial characteristics, and prospects that is important in deciding whether to extend credit.12 Lenders can use information gathered over time through long-term relationships with business owners and other members of the local community to monitor the health of the business and to build appropriate incentives into loan agreements.13 The role of relationship lending will likely continue to be significant, even as developments such as automated banking, credit scoring, and bank consolidation influence the competitive structure of the banking industry.14
Credit Use
Up-to-date and comprehensive information about the universe of small businesses is sparse, and most evidence about financing needs and sources is derived largely from surveys. Researchers have learned a great deal about the financing of small businesses from various data sources and studies, particularly from the SSBF. This survey, which was conducted most recently for year-end 2003, provides the most comprehensive and up-to-date information available on small business use of financial services and providers.15
The 2003 SSBF gathered data from interviews with 4,240 small businesses between June 2004 and January 2005. The firms were selected to be representative of for-profit, nonfarm, nonfinancial small businesses operating in the United States in December 2003. The survey gathered details on the characteristics of each business and its top three owners, the firm's income statement and balance sheet, and the use and sources of financial services. It also obtained information about the firm's recent experiences in borrowing and applying for credit, the use of trade credit, and capital infusions. The previous survey had been conducted for fiscal year 1998 using a sample of 3,561 firms.
Data from the 2003 SSBF describe patterns of credit use by small businesses. Although this information is influenced by both demand and supply factors, it is nonetheless very useful in developing a picture of the demand for credit by small businesses. The data reveal patterns at both the aggregate and the firm levels.16
Although recent economic developments may have altered small business behavior from that reported in the 2003 SSBF, past surveys suggest that the 2003 results should still provide a good picture of current small business behavior because patterns in the use of credit by small businesses change slowly. When significant differences exist between the 1998 and the 2003 data, these differences are discussed to highlight potentially important trends in the use of credit by small businesses.
Types of Traditional Credit Used
Most small businesses use traditional types of credit, including loans taken down under lines of credit, mortgages used for business purposes, equipment loans, motor vehicle loans, capital leases, and "other loans." In 2003, 60.4 percent of small businesses used one of these traditional forms of credit (table A.2). This incidence is slightly higher than the 55 percent that reported using traditional forms of credit in 1998.
Among all small businesses in 2003, several patterns in credit use are apparent from the figures in table A.2. Larger firms were more likely than smaller firms to use at least one of the traditional forms of credit. A large majority (94 percent) of firms with between 100 and 499 employees used credit, whereas about two-fifths of firms with fewer than two employees did. Among firms that used a traditional credit product, use increased with firm size. The median credit-using firm with between 100 and 499 employees had four credit lines, loans, or leases with a total outstanding balance of more than $870,000 (table 2). These figures are substantially higher than those for the median credit-using firm with fewer than two employees, which had one credit line, loan, or lease with a combined balance of $17,000.
| Category of firm | Any | Credit line | Mortgage loan | Vehicle loan | Equipment loan | Capital lease | Other credit | |||||||
|---|---|---|---|---|---|---|---|---|---|---|---|---|---|---|
| Number | Balance | Number | Balance | Number | Balance | Number | Balance | Number | Balance | Number | Balance | Number | Balance | |
| All firms | 2 | 38,983 | 1 | 15,030 | 1 | 108,487 | 1 | 20,000 | 1 | 20,663 | 1 | 8,080 | 1 | 40,400 |
| Number of employees1 | ||||||||||||||
| 0-1 | 1 | 17,000 | 1 | 5,000 | 1 | 83,000 | 1 | 17,500 | 1 | 15,600 | 1 | 3,600 | 1 | 17,000 |
| 2-4 | 1 | 24,000 | 1 | 12,000 | 1 | 79,200 | 1 | 16,000 | 1 | 6,200 | 1 | 5,560 | 1 | 18,712 |
| 5-9 | 2 | 41,600 | 1 | 19,840 | 1 | 96,000 | 1 | 20,000 | 1 | 21,000 | 1 | 6,800 | 1 | 38,800 |
| 10-19 | 3 | 102,300 | 1 | 33,000 | 1 | 215,000 | 2 | 28,000 | 1 | 36,000 | 1 | 14,800 | 1 | 100,000 |
| 20-49 | 3 | 190,900 | 1 | 36,560 | 1 | 283,200 | 2 | 33,960 | 1 | 62,000 | 1 | 20,000 | 1 | 140,800 |
| 50-99 | 3 | 464,728 | 1 | 90,200 | 1 | 600,000 | 3 | 51,200 | 1 | 156,728 | 2 | 65,000 | 1 | 310,000 |
| 100-499 | 4 | 873,000 | 1 | 130,000 | 2 | 937,643 | 2 | 78,896 | 2 | 506,546 | 2 | 69,000 | 2 | 900,000 |
| Standard Industrial Classification | ||||||||||||||
| Construction and mining (10-19) | 2 | 40,000 | 1 | 10,400 | 1 | 78,000 | 1 | 25,000 | 2 | 43,000 | 1 | 20,000 | 1 | 39,000 |
| Manufacturing (20-39) | 2 | 60,000 | 1 | 20,000 | 1 | 181,000 | 1 | 20,000 | 1 | 39,000 | 1 | 15,000 | 1 | 80,000 |
| Transportation (40-49) | 2 | 70,000 | 1 | 18,120 | 1 | 65,000 | 2 | 30,000 | 1 | 69,000 | 2 | 38,000 | 1 | 42,000 |
| Wholesale trade (50-51) | 2 | 70,000 | 1 | 26,000 | 1 | 105,000 | 1 | 20,441 | 1 | 16,000 | 2 | 14,839 | 1 | 84,000 |
| Retail trade (52-59) | 2 | 50,000 | 1 | 20,073 | 1 | 133,600 | 1 | 20,000 | 1 | 12,331 | 1 | 5,940 | 1 | 50,000 |
| Insurance and real estate (60-69) | 2 | 75,120 | 1 | 20,000 | 1 | 164,838 | 1 | 15,200 | 1 | 15,000 | 1 | 5,000 | 1 | 91,146 |
| Business services (70-79) | 2 | 27,759 | 1 | 10,600 | 1 | 100,000 | 1 | 17,188 | 1 | 16,582 | 1 | 10,374 | 1 | 20,078 |
| Professional services (80-89) | 2 | 28,680 | 1 | 15,793 | 1 | 121,529 | 1 | 18,000 | 1 | 12,228 | 1 | 6,000 | 1 | 30,000 |
Note. Data are weighted to adjust for differences in sampling and response rates and reflect population rather than sample measures.
1. Number of owners working in the business plus number of full- and part-time workers. Return to table
Source. 2003 Survey of Small Business Finances.
Although these data reveal a strong association between firm size and the extent of borrowing, they cannot measure how much of the association may be due to relatively greater capital needs of larger firms and how much may be due to the greater difficulty that smaller firms have in obtaining credit. The relative demand for credit likely increases with firm size because credit needs tend to expand with the scope of operations and inventories that a firm needs to hold. Size also tends to be associated with various characteristics of the firm that could affect its ability to gain access to credit from external sources. For example, larger firms tend to have more assets for collateral, are likely to be more diversified, and frequently have longer performance histories.
The share of small firms in each industry that used credit was highest for firms in transportation (79.1 percent), construction and mining (70.7 percent), and manufacturing (70 percent). It was noticeably lower in the service sectors (56.4 percent in business services and 54.1 percent in professional services), which rely less on inventories or machinery (table A.2).
Different patterns of credit use among various firms exist not just for all credit lines, loans, and leases but for the individual products in this group as well. Patterns for each product are discussed below. Much of the data illustrating differences come from the 2003 SSBF and are presented in the appendix. Specifically, table A.2 reports the percentage of each firm type that used each of the traditional credit products, and table A.8 reports the share of total outstanding balances in each of the traditional credit products by firm type.17 In addition, table 2 shows the median balances outstanding for each credit product. Figures from each of these three tables are cited in the discussion of specific credit products.
Credit Lines
As was true in 1998, credit lines were the most common traditional form of credit used by small businesses in 2003. Between 1998 and 2003, use of credit lines increased. In 1998, 28 percent of firms reported using credit lines; in 2003, more than one-third of all firms reported doing so. Credit lines accounted for 31.7 percent of the total dollar value of traditional credit outstanding. Among firms with lines of credit, the median firm had one line of credit with a credit limit of $50,000 and a balance of $15,030.
Substantial variation exists in the use of credit lines across industries. Credit lines were most important to firms involved in wholesale trade. In this industry, 49.4 percent of small firms used credit lines, which accounted for 55.3 percent of the value of all traditional credit outstanding at these firms. Firms in the manufacturing industry and the construction and mining industry were also frequent users of lines of credit. Figures for the share of firms that used lines of credit and their share of traditional credit outstanding were 47.8 percent and 44.2 percent in manufacturing, and 44.6 percent and 27.3 percent in construction and mining. Heavy use by firms in these industries may be explained by the need to maintain large inventories, which is expensive and generally requires financing. In contrast, among professional services firms, for which inventory may not be as important, only 29.4 percent of firms used lines of credit, a share that accounted for 21 percent of all outstanding traditional credit.
The use of credit lines was less common among younger firms than among older firms. Among firms with fewer than five years under current ownership, 30.2 percent used credit lines, compared with 39.3 percent of firms with twenty-five or more years under current ownership. At the same time, however, the share of traditional credit accounted for by firms with open lines did not vary much with firm age. Credit lines accounted for about 30 percent of outstanding credit at both the youngest firms (those in operation fewer than five years) and the oldest firms (those in operation twenty-five years or more). Comparing firms with credit lines, the credit limit of the average firm with fewer than five years under current ownership was less than half the credit limit of older firms. The balances on the credit lines of these younger firms were also noticeably lower than those at the older firms, though the difference was not as large as the difference between the credit limits.
Credit-line use increased with firm size: Smaller small firms used this type of credit less frequently than larger small firms. This difference may reflect the lower credit needs of smaller firms, a reduced ability of young and small firms to obtain credit due to the greater information opacity, or the higher risks and costs associated with lending to such firms.
The SSBF data on credit lines provide additional insight into the demand and availability of small business credit. Table 3 shows the ratio of credit-line balance to credit limit for each firm type--that is, the percentage of available credit that each firm used in 1998 and 2003. These percentages increased somewhat for most categories of small businesses between 1998 and 2003, perhaps because of an increased demand for credit in 2003. However, in 2003, most types of small businesses reported using less than half of their available credit lines. Thus, while credit lines were used somewhat more intensively in 1998 than in 2003, most firms with credit lines apparently had additional credit available from unused lines.
| Category of firm | 1998 | 2003 |
|---|---|---|
| All firms | 38.6 | 45.5 |
| Number of employees1 | ||
| 0-1 | 37.1 | 48.7 |
| 2-4 | 41.1 | 40.7 |
| 5-9 | 50.5 | 50.8 |
| 10-19 | 34.3 | 38.3 |
| 20-49 | 29.9 | 41.4 |
| 50-99 | 43.4 | 46.0 |
| 100-499 | 39.6 | 48.4 |
| Standard Industrial Classification | ||
| Construction and mining (10-19) | 29.7 | 33.2 |
| Manufacturing (20-39) | 40.1 | 45.2 |
| Transportation (40-49) | 39.7 | 47.0 |
| Wholesale trade (50-51) | 29.2 | 47.2 |
| Retail trade (52-59) | 58.2 | 56.0 |
| Insurance and real estate (60-69) | 38.9 | 39.9 |
| Business services (70-79) | 47.6 | 50.0 |
| Professional services (80-89) | 27.9 | 31.0 |
| Years under current ownership | ||
| 0-4 | 46.8 | 53.6 |
| 5-9 | 47.5 | 46.5 |
| 10-14 | 39.2 | 50.1 |
| 15-19 | 32.1 | 44.7 |
| 20-24 | 30.3 | 43.3 |
| 25 or more | 39.9 | 39.9 |
| Organizational form | ||
| Proprietorship | 33.7 | 40.5 |
| Partnership | 39.1 | 38.0 |
| S corporation | 41.9 | 46.1 |
| C corporation | 35.9 | 47.7 |
Note. Data are weighted to adjust for differences in sampling and response rates and reflect population rather than sample measures.
1. Number of owners working in the business plus number of full- and part-time workers. Return to table
Source. 2003 Survey of Small Business Finances.
Motor Vehicle Loans
Motor vehicle loans continue to be the second most commonly used type of traditional credit. In 1998, 20 percent of firms reported one or more motor vehicle loans. By 2003, more than one-fourth of all firms had reported outstanding motor vehicle loans. These loans, however, accounted for only 5.1 percent of the total amount of traditional credit outstanding because motor vehicle loans are small compared with the other types of credit. Of firms with motor vehicle loans, the median firm had one such loan with a balance of $20,000.
Motor vehicle loans were most frequently used in the construction and mining industry (43.9 percent) and in the transportation industry (42.9 percent), where these loans accounted for 14.4 and 11.5 percent of outstanding balances respectively. The median firm in the transportation industry that used this type of loan had two motor vehicle loans outstanding with a combined balance of $30,000, which was more than 50 percent larger than the median amount in any industry other than construction and mining.
Mortgage Loans
Approximately 13.3 percent of all firms had mortgage loans for business purposes, making this the third most commonly used type of credit. In terms of dollar amount, mortgage loans were the largest form of credit, accounting for 39 percent of traditional credit outstanding. These figures do not represent a significant change from the results of the 1998 survey, which showed that mortgages were used by 13.2 percent of small businesses and accounted for 35 percent of outstanding credit. Among the 13 percent of firms with mortgages, the median firm had one mortgage with a balance of $108,000.
The proportion of firms with mortgage loans used for business purposes increased with firm size. Only 5.6 percent of firms with fewer than two employees reported outstanding mortgages, whereas more than one-fourth of firms with 100 to 499 employees did so. In contrast, the proportion of traditional credit accounted for by mortgages fell with firm size. By organizational form, partnerships were the most likely to have outstanding mortgages, which accounted for nearly 68.3 percent of all outstanding credit.
Mortgage loans were the most important form of finance in the insurance and real estate industry. Mortgages were used by almost one-fourth of the small firms in the industry, and they accounted for 70.1 percent of the outstanding credit balances. Among firms in the industry that used mortgages, the median outstanding mortgage balance was $165,000, which was about $60,000 more than the median outstanding mortgage for all firms.
Capital Leases
Capital leases, which are leases on equipment that are often provided by the manufacturer of the equipment or a subsidiary, were used somewhat less frequently in 2003 than in 1998. Between 1998 and 2003, the share of small businesses that used leases fell from 10.3 percent to 8.7 percent. The lease share of total outstanding traditional credit also fell from 5.8 percent in 1998 to 3.2 percent in 2003. Among firms that used capital leases in 2003, the median firm had one capital lease with an outstanding balance of roughly $8,000.
Capital leases, which include automobile and equipment leases, were most heavily used in transportation industries. These leases were used by 9.3 percent of firms in transportation, a share that accounted for more than 20 percent of total outstanding credit. The median transportation firm had two leases, and the median outstanding balance of $69,000 was almost twice that for any other industry. Even though leases were somewhat more common for firms in the manufacturing (10.9 percent) and professional services (13.5 percent) industries, their share of traditional credit outstanding was only a modest 2.6 percent in manufacturing and 3.2 percent in professional services. Of the firms in these industries with a lease, the median firm had a single lease.
Equipment Loans and Other Types of Credit
Equipment loans were used by 10.3 percent of all firms and accounted for 7.2 percent of outstanding credit. Among firms that had at least one equipment loan, the median firm had one such loan with a balance of $21,000.
Not surprisingly, equipment loans were most significant in industries that rely heavily on equipment: construction and mining (12.6 percent of balances), manufacturing (15.2 percent), and transportation (18.4 percent). They were also somewhat important in wholesale trade, in which they accounted for 11.3 percent of outstanding loan balances, but in all other major industries, equipment loans accounted for less than 10 percent of outstanding balances.
Finally, unspecified other types of credit were used by 10.1 percent of small businesses and accounted for 13.7 percent of outstanding credit. The median firm with at least one "other" loan had one such loan outstanding with a balance of $40,000. Most of these loans were unsecured term loans. Approximately equal proportions of these loans were made by financial intermediaries or by family and friends.
Alternatives to Traditional Credit
Small business owners may turn to alternative forms of credit if they find themselves unable to obtain traditional forms or if they find the terms of these other products more favorable. Three such alternatives--credit cards, trade credit, and owner loans--can be examined using data from the 1998 and 2003 SSBFs. Widely used, these alternative forms of credit may be important both in financing small businesses and, as substitute products, in influencing the demand for traditional credit by small firms. According to the 2003 SSBF, 60.4 percent of small firms used a credit line, loan, or lease, but almost 89 percent used an alternative form of credit. Nearly 93 percent of small firms used either a traditional type of credit, a credit card, trade credit, or an owner loan.
Credit Cards
Credit cards can serve as a convenient alternative to paying expenses by cash or check if a business pays balances on time and in full each month. They can also substitute for traditional forms of credit when balances are carried month to month. Survey evidence suggests that credit cards are used primarily for convenience and that, despite a large increase in the use of credit cards between 1998 and 2003, small businesses have not substantially increased their use of credit cards as an alternative to traditional forms of credit.
Credit cards used for business purposes can be issued to the firm itself or to the owners of the firm, who may also use their personal credit cards for business expenses. Table 4 shows the percentage of small businesses that used personal credit cards, business credit cards, or either personal or business credit cards to pay for business expenses in 1998 and 2003. The use of credit cards by small businesses increased substantially between 1998 and 2003. In 2003, more than 77 percent of small businesses used either a business or a personal credit card to pay for business expenses--an increase of 9 percentage points over the 1998 percentage of firms using credit cards.
| Category of firm | 1998 | 2003 | ||||||
|---|---|---|---|---|---|---|---|---|
| Any1 | Personal | Business | Paid balance2 | Any1 | Personal | Business | Paid balance2 | |
| All firms | 68.0 | 46.0 | 34.1 | 76.3 | 77.3 | 46.7 | 48.1 | 70.7 |
| Number of employees3 | ||||||||
| 0-1 | 59.0 | 45.6 | 20.0 | 75.2 | 69.5 | 48.6 | 32.0 | 69.6 |
| 2-4 | 65.3 | 47.1 | 28.8 | 72.5 | 76.4 | 48.1 | 45.7 | 65.9 |
| 5-9 | 73.4 | 45.4 | 43.2 | 76.5 | 81.0 | 47.8 | 56.8 | 68.5 |
| 10-19 | 80.0 | 51.5 | 50.8 | 78.5 | 85.0 | 45.6 | 59.7 | 79.4 |
| 20-49 | 81.9 | 41.7 | 56.9 | 88.5 | 81.5 | 34.4 | 61.7 | 85.2 |
| 50-99 | 75.2 | 31.3 | 58.6 | 94.1 | 81.9 | 34.6 | 63.5 | 93.9 |
| 100-499 | 76.8 | 23.7 | 62.5 | 97.5 | 82.9 | 32.2 | 71.4 | 92.4 |
| Standard Industrial Classification | ||||||||
| Construction and mining (10-19) | 65.3 | 40.8 | 33.4 | 80.5 | 76.9 | 44.7 | 52.1 | 75.1 |
| Manufacturing (20-39) | 73.8 | 48.7 | 39.3 | 73.2 | 81.7 | 47.1 | 54.8 | 71.6 |
| Transportation (40-49) | 72.2 | 44.1 | 45.5 | 79.9 | 74.6 | 41.4 | 51.8 | 70.8 |
| Wholesale trade (50-51) | 75.1 | 45.8 | 46.3 | 80.8 | 81.3 | 46.7 | 54.4 | 76.2 |
| Retail trade (52-59) | 59.4 | 41.0 | 29.9 | 70.6 | 75.1 | 47.9 | 45.0 | 64.8 |
| Insurance and real estate (60-69) | 68.7 | 41.5 | 36.3 | 88.3 | 72.6 | 47.4 | 43.0 | 85.2 |
| Business services (70-79) | 64.4 | 47.0 | 28.3 | 70.2 | 76.3 | 45.2 | 47.0 | 66.4 |
| Professional services (80-89) | 76.8 | 53.9 | 36.2 | 80.5 | 80.0 | 48.8 | 47.1 | 71.7 |
| Years under current ownership | ||||||||
| 0-4 | 66.4 | 46.0 | 28.7 | 68.9 | 73.7 | 45.2 | 46.6 | 67.5 |
| 5-9 | 72.5 | 48.7 | 38.2 | 74.0 | 77.3 | 44.6 | 49.7 | 63.4 |
| 10-14 | 68.2 | 46.6 | 34.3 | 79.1 | 80.9 | 49.8 | 48.7 | 72.2 |
| 15-19 | 67.7 | 43.7 | 37.5 | 78.7 | 79.5 | 48.5 | 52.3 | 71.9 |
| 20-24 | 66.5 | 46.2 | 34.2 | 84.1 | 79.6 | 46.9 | 50.7 | 74.9 |
| 25 or more | 64.6 | 42.8 | 32.5 | 80.9 | 75.2 | 46.6 | 43.1 | 78.6 |
| Organizational form | ||||||||
| Proprietorship | 62.3 | 49.6 | 21.9 | 71.7 | 73.0 | 52.3 | 35.1 | 66.6 |
| Partnership | 59.6 | 37.0 | 30.4 | 71.9 | 73.0 | 41.7 | 46.9 | 70.9 |
| S corporation | 77.4 | 44.2 | 47.3 | 80.0 | 83.4 | 43.5 | 61.6 | 70.4 |
| C corporation | 73.9 | 42.3 | 49.7 | 82.3 | 79.7 | 39.6 | 58.9 | 81.9 |
Note. Data are weighted to adjust for differences in sampling and response rates and reflect population rather than sample measures.
1. Percentage of firms that used either a personal or business credit card. Return to table
2. Percentage of firms using either a personal or business credit card that paid off their credit card balances each month. Return to table
3. Number of owners working in the business plus number of full- and part-time workers. Return to table
Source. 2003 Survey of Small Business Finances.
In the past five years, the use of business credit cards has grown faster than the use of personal credit cards, probably because of aggressive marketing by credit card companies. In 1998, 34.1 percent of small businesses used business credit cards; by 2003, this figure had increased to 48.1 percent. During the same period, the use of personal credit cards increased less than 1 percentage point. Business use was on par with personal use by 2003: 48.1 percent of surveyed firms reported using business credit cards, and 46.7 percent reported using personal credit cards. The use of each of these credit card types differs by size of firm. Business use of personal credit cards decreased as firm size increased, whereas the use of business credit cards increased with firm size. In 2003, only the smallest businesses, those with fewer than five employees, used personal credit cards more than business credit cards. This difference may indicate that small firms have more difficulty than larger firms in obtaining business credit cards and therefore use personal cards as a substitute.
In 2003, businesses that used either personal or business credit cards on average charged $3,100 of new business expenses each month. On personal cards, monthly charges averaged $1,200, whereas on business cards monthly charges averaged $1,900. In 1998, new charges to personal or business credit cards averaged $2,200, with $1,000 charged to personal credit cards and $1,200 charged to business credit cards. Hence, most of the growth in the average charges to credit cards is due to increased use of business credit cards. Despite this increased use, the majority (70.7 percent) of these firms reported that they paid their credit card balance in full each month. Such behavior suggests that most firms used credit cards for convenience and not as a substitute for traditional credit products. Smaller and younger firms, which are most likely to have difficulty obtaining traditional forms of credit, were more likely to carry balances on their credit cards. For example, roughly 70 percent of firms with fewer than ten employees paid their balances in full each month, compared with more than 90 percent of firms with fifty or more employees.
Trade Credit
Trade credit arises when a business purchases goods or services for which payment is delayed. Like credit cards, firms can use trade credit either as a form of credit or as a convenient alternative to paying cash each time a purchase is made. In 2003, 60.1 percent of small businesses used trade credit, about the same proportion that used credit lines, loans, or capital leases but much smaller than the proportion of firms that used credit cards (table A.10). The use of trade credit was virtually unchanged between 1998 and 2003.
Trade credit is generally extended for an intermediate period (30-60 days), at which point payment is due. When payment is not made by the due date, financing charges are applied, and trade credit becomes an alternative method of financing business expenses. Trade credit can be a very costly form of credit for firms that do not make timely payment. According to the 2003 SSBF, 41 percent of firms that used trade credit paid after the due date. Frequently, suppliers will offer cash discounts (typically 1 percent to 2 percent of the purchase price) for early payment, normally five, ten, or fifteen days after delivery. According to the same data from the SSBF, 53 percent of firms that used trade credit were offered such cash discounts by one or more of their suppliers. Of these firms that were offered cash discounts, 80.2 percent took advantage of the discounts by making quick payment.
As shown in table A.10, trade credit was used more extensively by larger firms (more than 85 percent of small businesses with between 100 and 499 employees used trade credit in 2003) and by corporations (more than 70 percent of S and C corporations used trade credit, compared with less than 50 percent of proprietorships).
The substitution of trade credit for traditional types of credit shows a different pattern than the overall use of trade credit. Larger small businesses paid off trade credit after the due date more frequently than smaller firms. This behavior indicates that larger small businesses used trade credit more frequently than smaller firms as a form of credit and not just as a convenient way to pay for transactions. Younger firms were also less likely to take advantage of cash discounts for early payment when discounts were offered by suppliers.
Loans from Owners
Members of partnerships and owners of corporations may rely on themselves as an alternative source of credit by making personal loans to their businesses.18 Though perhaps not feasible for all small businesses, as some business owners may have insufficient wealth, this form of finance represents another alternative to the traditional forms of credit.
In some instances, owner loans may serve different functions than traditional credit loans. For example, an owner may form a corporation and pay herself a salary. At the end of the year, the owner forgoes the salary in lieu of a loan to the firm. Such behavior generally occurs in firms with cash-flow problems or in the initial stages of a firm's existence, before the venture becomes profitable. Loans from owners are different from the other types of credit in that owner loans have elements of both credit and equity. Specifically, in cases of firm liquidation, creditors have senior claims to equity holders, so owners with loans to the firm are more likely to receive money from the liquidation of the firm than owners without such loans.
Small business owners made loans to 30.3 percent of small businesses organized as either partnerships or corporations in 2003. As shown in the last column of table A.10, these loans were used more often by small corporations (more than 30 percent of S and C corporations had owner loans in 2003) than by partnerships (25.2 percent). Among firms that used owner loans, both the number of loans per firm and the size of the principal of those loans increased with firm size, possibly as a result of the greater capital needs of larger firms.
Owner loans were somewhat more likely to be used by younger firms than by older firms, a possible indication of another instance in which younger firms tend to rely on alternatives to traditional credit products. The use of owner loans was almost unchanged between 1998 (28 percent of small firms had one or more owner loans) and 2003 (30 percent).
Summary of Credit Use
The use of credit products exhibited several clear patterns. Among small businesses, larger firms were more likely than smaller firms to use each of the traditional credit types. However, whether this pattern reflects a greater need for credit at larger firms or whether lenders are simply more willing to extend credit to larger firms is unclear.
The relationship between firm age and credit use is similar to the relationship between size and use in that younger firms use fewer credit products. At the same time, however, the use of some traditional credit products declines with firm age. Specifically, leases and other loans were more likely to be used by younger firms, whereas lines of credit, vehicle loans, and equipment loans were more likely to be used by older firms. Several factors may explain the similarities and differences in the relationship between size and credit use and between firm age and credit use. The similarities are likely due to a correlation between firm size and age. The differences are likely related to the greater informational opacity of younger and smaller firms. This characteristic might make evaluating creditworthiness more difficult for lenders, which could reduce the supply of some types of credit available to small and young firms.
Patterns of credit use by small businesses observed in data from the 1998 and 2003 SSBFs were similar. The most significant differences in the use of traditional credit products involved the increased use of lines of credit, which could be due to in part to some institutions relying more heavily on credit scoring to evaluate certain loan applications (discussed in a later chapter). Among the alternatives to traditional credit products, only credit cards, specifically business credit cards, showed notable increases, although the percentage of firms carrying balances month to month on their cards was low and approximately constant over the two surveys.
Credit Application Experience
In some cases, small businesses may have wanted to use more credit than was reflected on the survey but were unable to obtain it. The analysis in this section looks at the experience of firms that sought to obtain credit but had their applications denied.
As shown in table A.9, 21.4 percent of small firms applied for new credit between 2000 and 2003.19 Larger firms applied for new credit with greater frequency than smaller or older firms. More than 41 percent of firms with between 100 and 499 employees applied for new credit over this period, more than three times the 13.5 percent of firms with fewer than two employees.
Success also varied with firm size. Larger firms were more likely than smaller firms to have their loans approved. More than 90 percent of firms with 100 to 499 employees that applied once for credit had their application approved, and 90.6 percent of such firms that applied more than once had all their applications approved. These approval rates are higher than those for firms with fewer than two employees: 89.4 percent of such firms that applied once for credit, and 67 percent of those that applied multiple times, had all their loans approved.
Although application rates did not vary much with firm age, younger firms were less likely to have one or more of their applications for credit approved. Of the firms with fewer than five years under current ownership, 84.5 percent of those that applied once for credit had their application approved, and 48 percent of such firms that applied more than once had all of their applications approved. Firms with twenty-five years or more under current ownership were more successful at applying for credit, with 86.8 percent of the single-application firms being approved and 80.1 percent of the multiple-application firms having all applications approved.
In addition to self-reported application experiences, the SSBF obtained business credit scores for surveyed businesses from Dun and Bradstreet.20 The credit-score data support the hypothesis that smaller and younger firms may be riskier than other firms. Younger and smaller firms have lower (that is, more risky) credit scores than older and larger firms. For example, firms with fewer than five years under current ownership had an average credit score of 44; those with more than twenty-five years under current ownership had an average score of 61. And firms with fewer than four employees had an average score of 48, while those with more than fifty employees had an average score of 58. Moreover, firms that applied for credit and had at least one application denied had an average credit score of 32, much lower than the average score--56--for those firms that applied for credit and had all of their applications approved.
Thus, the evidence regarding loan application experiences of small businesses and the finding that smaller and younger firms have their loan applications approved less frequently are consistent with the conventional wisdom that these firms are riskier, have shorter credit histories or less collateral to pledge as security, and are more informationally opaque.
Unfortunately, one cannot tell from the survey data whether the firms that had credit applications denied were able to obtain financing from other sources. Even so, unless all denied credit applications were approved elsewhere, the data on the application experience of firms indicate that the demand for credit by some small businesses may have been higher than suggested by the credit-utilization data. Because smaller and younger firms have their applications denied more frequently than their larger and older peers, the difference between credit demand and ultimate use should be greater at smaller firms.
Besides the firms that were denied credit, some firms that may have wanted additional credit may not have applied because they expected that their applications would be denied. The 2003 SSBF asked respondents whether they had forgone applying for needed credit because of the expectation of denial. According to those results, in 2003, only 18 percent of small businesses responded affirmatively to this question, down from the 23 percent that did so in 1998. These data indicate a pattern similar to that observed in the data on application denial rates; younger and smaller firms were more likely to forgo applying for credit.21 The expectation of denial was particularly strong among the youngest firms, those with fewer than five years under current ownership: More than 26 percent did not apply for credit because they expected to be denied. These data suggest that the demand for credit at smaller and younger small businesses may have been higher than the data on credit use suggest. However, firms that expected denial may not have been shut out of the market. Firms that reported not having applied for needed credit at some point in the previous three years actually applied for credit nearly twice as often as firms that did not expect their applications to be turned down.
Providers of Credit Lines, Loans, and Leases to Small Businesses
In this section, the providers of small business credit are examined. These providers include commercial banks, savings institutions, credit unions, finance companies, nonfinancial firms, and individuals such as a family member or a friend. Because commercial banks are the leading source of credit to small businesses, this analysis focuses largely on their activity. The section examines the relationship between bank size and small business lending, and it discusses the industrywide structure of small business lending activity. These issues provide insight into the availability of credit to small businesses. The section also presents a more modest analysis of small business lending by savings institutions, which account for substantially less small business credit than commercial banks.
Overview
According to the 2003 SSBF, more than 60 percent of small businesses had outstanding credit lines, loans, or leases, an increase from the 55 percent of such businesses reporting outstanding credit in 1998. Commercial banks provided credit lines, loans, or leases to 41.1 percent of small firms, a proportion that corresponds to about 68 percent of the small firms that obtained a traditional form of credit from any source (table A.4). In addition, 5.5 percent of small businesses obtained traditional credit from a savings bank or a savings and loan association, and 3.9 percent obtained it from a credit union. In total, depository institutions supplied credit to more than three-fourths of the businesses that reported outstanding credit.
Nondepository sources, which include nondepository financial suppliers and nonfinancial suppliers, provided credit to about one-third of small businesses in 2003, an increase from the nearly 27 percent of firms that used nondepositories in 1998. The key sources among nondepository financial suppliers were finance companies (22.2 percent of firms) and leasing companies (4.3 percent). Family and individuals (6.5 percent) were the most important nonfinancial source of credit.
Commercial banks were, by a wide margin, the most common source of virtually every credit product included in the survey. They supplied more small businesses with lines of credit, mortgage loans, and equipment loans than any other type of provider. They were also the second most common supplier of motor vehicle loans and "other" loans.22
Finance companies were the most important sources of motor vehicle loans and leases, whereas family and friends were the most important sources of other loans.
In terms of the aggregate dollars outstanding, commercial banks provided 56.8 percent of the outstanding amount of lines of credit, loans, and leases used by small businesses (table A.5). Banks accounted for the largest dollar share of credit lines, mortgages, equipment loans, and other loans. Finance companies, the largest nonbank suppliers, accounted for 16.2 percent of aggregate dollars outstanding. Although most of these loans were for motor vehicles, motor vehicle loans extended by finance companies accounted for only 2.5 percent of aggregate dollars, whereas mortgages and lines of credit extended by such companies each accounted for about 4 percent of aggregate dollars. Thrifts and credit unions accounted for 6.9 percent of aggregate dollars outstanding, and most of the outstanding dollars were associated with mortgage loans. Altogether, depository institutions provided nearly two-thirds of the outstanding balances of loans, lines, and leases used by small businesses.
Lending by Depository Institutions
Beyond survey data, an important source of information on the small business lending activities of commercial banks and savings institutions is the small business loan data collected by the Federal Reserve and other regulatory agencies on the midyear Reports of Condition and Income (Call Reports) and midyear Thrift Financial Reports (TFRs).23 These data, which have been collected as of June 30 since 1993, include information on outstanding small commercial and industrial loans and loans secured by nonfarm, nonresidential properties.24 The number of loans and amount outstanding are collected for loans with original amounts of $100,000 or less, more than $100,000 through $250,000, and more than $250,000 through $1 million.25
These data are used to estimate the amount of credit extended to small firms because loan size is often used as a proxy for the size of the firm receiving credit. However, this approach to measuring small business lending introduces two sources of inaccuracy in the measurement of the number and dollar amount of loans to small businesses. First, the data likely include loans equal to or less than $1 million extended to large firms, and second, the data exclude loans of more than $1 million made to small firms.26
The latter source of inaccuracy probably has a greater net effect and results in an undercounting of small business lending. According to the 2003 SSBF, only about 3.5 percent of credit-line extensions to small businesses were associated with commitments greater than $1 million. However, these relatively few loan extensions accounted for roughly 66 percent of the dollar value of credit-line commitments to small businesses. Although a large share of the value of small business loans may be excluded from Call Report and TFR data, these loans are not typical of the credit obtained by the majority of small firms.27
Commercial Banks
Commercial banks are the leading providers of credit to small firms.28 Lending to small businesses involves unique challenges that banks are particularly well suited to meet. Of particular significance, information on the financial condition, performance, and prospects of small firms is not readily available, so lending is often based heavily on information gathered through established relationships, which banks and their staff frequently have with small firms and their owners.
Bank Size
The relationship between bank size and the extent to which banks engage in small business lending may have implications for the availability of credit to small firms. Substantial consolidation in the banking industry over the past twenty years has dramatically reduced the number of banks, increasing the importance of large banks and the concentration of industry assets.29 For example, more than 4,200 bank mergers involving acquired assets in excess of $4.2 trillion were completed between 1994 and 2006.30 Even though more than 1,700 new banks were granted charters over this period, the total number of bank organizations fell nearly one-fourth, to 6,229 (table 5).
| Year (as of June 30) |
Number | Total assets held by insured U.S. commercial banks (billions of dollars) | Share of domestic commercial banking assets held by the largest organizations (percent) | ||||
|---|---|---|---|---|---|---|---|
| Commercial banking organizations1 | Insured U.S. commercial banks | Top 10 | Top 25 | Top 50 | Top 100 | ||
| 1994 | 8,102 | 10,552 | 3,311 | 27.5 | 45.7 | 60.2 | 71.2 |
| 1998 | 6,930 | 8,810 | 4,286 | 35.1 | 54.2 | 67.6 | 75.6 |
| 2002 | 6,455 | 7,800 | 5,590 | 45.2 | 61.0 | 71.1 | 77.5 |
| 2006 | 6,229 | 7,327 | 7,920 | 49.7 | 64.3 | 73.7 | 79.1 |
Note. Includes insured U.S. domestically chartered banks excluding credit card institutions.
1. Commercial banking organizations include bank holding companies and independent banks. Return to table
Source. Call Reports (June 30), various years, and the National Information Center database.
One merger-related structural development that has raised concerns about the availability of credit to small businesses stems from the fact that large banks tend to be proportionately less committed than smaller banks to small business lending. As seen in table 6, the average banking organization with $1 billion or less in total assets held almost 20 percent of its portfolio as small business loans in June 2006.31 In contrast, organizations with assets between $1 billion and $10 billion held 13.7 percent of their assets as small business loans, and the largest organizations--those with assets greater than $10 billion--held 6.7 percent of their assets as such loans.
| Asset class | Number of banking organizations2 | Small business loans to assets | Microloan holdings to assets |
|---|---|---|---|
| $250 million or less | 4,553 | 19.1 | 6.5 |
| $250 million to $1 billion1 | 1,273 | 18.6 | 3.3 |
| $1 billion to $10 billion1 | 338 | 13.7 | 2.0 |
| More than $10 billion | 65 | 6.7 | 1.1 |
| All organizations | 6,229 | 18.6 | 5.5 |
Note. Small business loans are business loans of $1 million or less; microloans, a subset of small business loans, are for $100,000 or less. U.S. commercial banking organizations are insured U.S. domestically chartered banks excluding credit card institutions and U.S. branches and agencies of foreign banks.
1. Banks with assets of $1 billion are included in the $250 million to $1 billion size class, and banks with assets of $10 billion are included in the $1 billion to $10 billion size class. Return to table
2. Banking organizations include bank holding companies and independent banks. Return to table
Source. Call Reports (June 30) and the National Information Center database.
The pattern for holdings of microloans, which are defined as business loans of $100,000 or less, is even clearer, with smaller banks maintaining a larger share of their asset portfolios in such loans. The smallest banks tend to be proportionately more invested in the smallest business loans for two primary reasons. First, many small banks operate as "community" banks, which provide banking services to particular local areas. As a result, the banks are likely to accumulate knowledge of their local markets, which is often important in making risky, relationship-dependent small business loans. Difficulties in evaluating and monitoring loans likely become more severe as firms, and therefore loans, decrease in size. Second, bank regulations limit the amount that a bank can lend to a single borrower--to 25 percent of the bank's capital--so small banks are likely limited from making loans larger than a fairly modest amount. Small banks can also maintain a more diversified portfolio by making many smaller loans, rather than fewer larger loans.
Even though the largest banking organizations tend to be proportionately less active in small business lending, these banks are still significant providers of small business loans. Banking organizations with assets greater than $10 billion accounted for 1 percent of all commercial banking organizations in June 2006 but held 75.9 percent of the banking assets in the industry (table 7). These large organizations held a much smaller, but nonetheless substantial, share of small business loans, as 44.7 percent of small business loans and 48.9 percent of microloans were held by banking organizations with more than $10 billion in assets.
| Asset class | Share of banking organizations2 | Share of industry assets | Share of holdings | |
|---|---|---|---|---|
| Small business loans | Microloans | |||
| 2002 | ||||
| $250 million or less | 80.8 | 8.0 | 19.8 | 27.4 |
| $250 million to $1 billion1 | 14.6 | 7.7 | 17.4 | 15.3 |
| $1 billion to $10 billion1 | 3.7 | 11.6 | 17.2 | 12.7 |
| More than $10 billion | .9 | 72.7 | 45.6 | 44.6 |
| 2006 | ||||
| $250 million or less | 73.1 | 5.4 | 16.0 | 21.3 |
| $250 million to $1 billion1 | 20.4 | 7.4 | 19.3 | 15.8 |
| $1 billion to $10 billion1 | 5.4 | 11.3 | 20.1 | 14.1 |
| More than $10 billion | 1.0 | 75.9 | 44.7 | 48.9 |
Note. Small business loans are business loans of $1 million or less; microloans, a subset of small business loans, are for $100,000 or less. U.S. commercial banking organizations are insured U.S. domestically chartered banks excluding credit card institutions and U.S. branches and agencies of foreign banks. Details may not sum to totals because of rounding.
1. Banks with assets of $1 billion are included in the $250 million to $1 billion size class, and banks with assets of $10 billion are included in the $1 billion to $10 billion size class. Return to table
2. Banking organizations include bank holding companies and independent banks. Return to table
Source. Call Reports (June 30) and the National Information Center database.
Despite their declining numbers and a fall in their share of industry assets, small banks continue to account for a sizable share of small business loans. In 2006, banks with assets of $250 million or less accounted for 73.1 percent of all banking organizations but only 5.4 percent of all banking assets. However, they held 16 percent of all small business loans and 21.3 percent of microloans.
The share of small business loans held by organizations with assets greater than $10 billion fell slightly between 2002 and 2006, but the share of business microloans for these institutions increased from 44.6 to 48.9 percent. In 1997, the share of microloans held by banking organizations with assets greater than $10 billion was only 30 percent. The growth in the share of business microloans since 1997 reflects the increasing importance of large banking organizations in providing the smallest loans, an activity that has often been, and continues to be, conducted by small banks. Increased use of sophisticated technological and analytical tools, particularly credit-scoring techniques, may have contributed to the rise in the share of microloans held and originated by large banking organizations. The largest banks may also have expertise in credit card programs and may have leveraged this experience to provide business credit cards that typically have low balances (Brevoort and Hannan, 2006). And depending on how the mergers were handled, the acquisition of small banks may have contributed as well (Hancock, Peek, and Wilcox, 2005).
The lending shares of the smallest banks--those with assets of $250 million or less--decreased between 2002 and 2006. Some of this decrease was due to the reduction in the share of banking organizations and bank assets that, because of bank consolidation, occurred for this class of institutions. The decrease in the share of small loans at the smallest banks was comparable to the increase experienced by banks with assets between $250 million and $10 billion.
Numerous research studies directly analyze the relationship between consolidation activity and the availability of credit to small firms.32 Although mergers and acquisitions sever existing bank-firm relationships and may introduce some short-term uncertainty (Berger and Udell, 1995), the results of the research generally suggest that overall they have not reduced credit availability.
One issue that has been addressed is the effect of mergers on the small business lending activities of the banks directly involved in those mergers. The results of these studies generally indicate that deals involving at least one large bank tend to reduce small business loans as a share of assets, whereas deals between two small banks tend to increase small business loans as a share of assets (for example, Critchfield and others, 2004; Avery and Samolyk, 2000, 2004; Samolyk and Richardson, 2003; Peek and Rosengren, 1998; and Strahan and Weston, 1998).
Both results are relevant to assessing the influence of consolidation on the availability of small business credit from banks and savings institutions. On the one hand, more than 95 percent of the bank assets acquired between 1994 and 2006 belonged to banks with at least $1 billion in total assets. Therefore, a large majority of the banking assets that have changed hands have been purchased in deals in which a decline in small business loans, as a share of assets, typically takes place at the consolidated bank.
On the other hand, even though relatively few assets have been purchased in mergers of small institutions, deals involving target banks with total assets of $250 million or less accounted for nearly three-fourths of all transactions completed between 1994 and 2006. About 30 percent of these deals involved an acquirer that had assets of $250 million or less, and roughly 30 percent involved an acquirer with assets between $250 million and $1 billion. Even though relatively few assets have been acquired in a deal typically associated with an increase in small business lending ratios, nearly three-fifths of all deals have occurred with small- or medium-sized acquirers; and therefore, after merger activity, many banks have had an overall increase in the share of their asset portfolios dedicated to small business lending.
Another issue that has been studied is the "external" effect of mergers--that is, what happens to small business lending at banks that compete directly with recently merged institutions. Evidence suggests that banks competing with recent merger participants tend to increase their lending (Berger and others, 1998; and Berger, Goldberg, and White, 2001). Two other empirical findings suggest that a growing amount of credit may be supplied by banks that compete with recently merged banks. First, consolidation increases the likelihood of new entry into a market (Berger and others, 2004; Seelig and Critchfield, 2003; and Keeton, 2000). Second, younger banks tend to make more small business loans than similar, but more mature, institutions (DeYoung, Goldberg, and White, 1999). These two empirical findings suggest that a common response to merger activity is greater entry of new banks, which tend to be active lenders to small businesses.
From the perspective of small firms, the effect of banking consolidation on credit availability may not be especially substantial given that the size of the banks operating in a market appears not to affect the availability of credit. Small businesses in areas with few small banks are no more credit-constrained than small businesses in areas with many small banks (Jayaratne and Wolken, 1999). In addition, the likelihood that a small business will borrow from a bank of a given size is roughly proportional to the local presence of banks of that size, although some evidence shows that small banks are more likely to make very small loans (Berger, Rosen, and Udell, 2001). In sum, the potential gap in credit availability to small businesses due to bank consolidation by the largest banks is usually attenuated by competition from small and medium-sized banks, by the entry of new banks, and by the substitution of credit extended by nonbank financial institutions for that extended by commercial banks (Ou, 2005; Craig and Hardee, 2007).33
Industry Structure
As large banks have acquired other institutions, especially other large ones, the number of banks has declined, and the size of the largest banks has increased. These developments may enable the leading (that is, most active) lenders to account for a growing share of all small business lending.
The structure of the relevant market for small business loans can be observed by examining patterns at the local level. Such analysis is particularly important because changes in concentration could affect the level of competition for small business lending, which, in turn, could influence the cost of borrowing and the quantity of credit demanded. In this section, the distribution of small business loan holdings at the industry level is analyzed to assess the importance of the leading small business lenders in the overall provision of small business credit.
Data on industry structure have several implications for the availability of credit to small businesses. First, the share of small business lending activity attributable to the most active lenders is smaller than the share of assets held by those banks, indicating that the numerous relatively less active lenders, many of which are small banks, remain a key source of credit for small firms. The second important finding is that, though the share of small business lending attributable to the leading banks has increased, particularly with respect to microloans, an industry in which the dominant providers of credit to small businesses are a relatively few large banking organizations does not appear to be developing.
Table 8 indicates that the leading small business loan holders account for a small share of loans relative to the share of total assets they hold. For instance, in 2006, the ten leading holders of small business loans held 24.4 percent of all such loans and 47.8 percent of all banking assets. Similar differences between the share of small business loans and the share of total assets are observed among the 25, 50, and 100 leading small business loan holders.
| Leading banking organizations1 | Share held by leading holders of small business loans | Share held by leading holders of microloans | ||
|---|---|---|---|---|
| Small business loans | Assets | Microloans | Assets | |
| 2002 | ||||
| Top 10 | 24.3 | 39.3 | 28.2 | 42.7 |
| Top 25 | 36.9 | 58.8 | 38.7 | 56.1 |
| Top 50 | 45.5 | 67.0 | 45.2 | 65.6 |
| Top 100 | 53.7 | 75.5 | 51.4 | 73.9 |
| 2006 | ||||
| Top 10 | 24.4 | 47.8 | 33.3 | 46.3 |
| Top 25 | 35.5 | 60.4 | 42.6 | 60.9 |
| Top 50 | 43.6 | 70.0 | 49.1 | 69.3 |
| Top 100 | 51.2 | 75.7 | 54.7 | 74.3 |
Note. Small business loans are business loans of $1 million or less; microloans, a subset of small business loans, are for $100,000 or less. U.S. commercial banking organizations are insured U.S. domestically chartered banks excluding credit card institutions and U.S. branches and agencies of foreign banks. For each category of loan activity, leading banking organizations account for the greatest share of that category.
1. Banking organizations include bank holding companies and independent banks. Return to table
Source. Call Reports (June 30), and the National Information Center database.
These data also show that the shares of small business loans held by the most active small business lenders have remained constant or declined somewhat since 2002, even though the share of banking assets for these firms has continued to grow. So while half of the outstanding small business loans are accounted for by the 100 most active small business bank lenders, their share has declined somewhat over the past few years.
Although large banking organizations are proportionately less active in small business lending than smaller banks, the leading small business lenders nonetheless typically include the largest banking organizations. For example, as was also true in 2002, nine of the ten banks with the largest holdings of small business loans are among the twenty-five largest banking organizations in the industry.
Local Lending Patterns
To address some key issues associated with the availability of credit to small businesses, one must shift the analysis from lending at the industry level. In particular, analysis of bank structure within smaller geographic areas is likely to capture more accurately the relevant market conditions that face small firms seeking credit and that influence the level of competition in the market for small business loans.
Data from the SSBFs indicate that a small business tends to obtain loans, leases, and lines of credit from a provider that is located near it.34 Although the median distance increased somewhat between 1993 and 2003, as shown in table A.11, it remained quite small. In 2003, the median distance between a small business and its lender was 11 miles, and in 66 percent of all business-lending relationships, the lender was located within 30 miles of the firm's headquarters. For depository institutions and banks, the major suppliers of small business credit, lenders were located even closer--the median distance was 4 miles, and 83 percent of lenders were located within 30 miles of the firm's headquarters. This proximity offers small firms convenient access to their lenders. Also, banks have traditionally preferred to extend loans to small businesses near their branches. The importance of relationships in small business lending suggests that credit providers concentrate their lending activities in geographic areas with which they are familiar (Berger and Udell, 1998; Brevoort and Hannan, 2006; Critchfield and others, 2004; and Scott, Dunkelberg, and Dennis, 2003).
The dependence of small firms on local lending institutions may be decreasing, however. As shown in table A.11, between 1993 and 2003, the median distance to small business lenders increased from 9 miles to 11 miles, and the percentage of lenders within 30 miles of the firm's headquarters fell from 71 percent to 66 percent. At commercial banks, the median distance increased from 3 miles to 4 miles, and the percentage of lenders within 30 miles fell from 88 percent to 83 percent.
One of the reasons for this shift is that technological and analytical innovations such as credit scoring may allow banks to make small business loans efficiently in areas where they have no physical presence and about which they have limited knowledge. Credit scoring is an automated process that uses information about an applicant to generate a numeric score that indicates the predicted future performance (that is, the probability of delinquency or default) of a loan to that applicant. Lenders can use credit scores to determine quickly and easily whether an application should be rejected or approved or whether the applicant's local market or business should receive a more thorough evaluation.
Although credit scoring may increase the ability of banks that are unfamiliar with a given area to make small business loans in that area, it is unlikely that such lenders would be willing to extend credit to the full range of potential small commercial borrowers. Because a credit score does not incorporate much of the unique information obtained via traditional small business lending methods, it may be an appropriate tool only for evaluating the creditworthiness of the least risky or least opaque small business borrowers. It is unclear how many small businesses are potential candidates for credit-scored loans and how many require their applications to be processed more traditionally.35
Local Market Concentration
Conventional economic theory predicts, and empirical evidence suggests, that highly concentrated markets exhibit less competition, which results in higher prices and the provision of less credit. However, it is worth noting that some theories predict that a less competitive lending environment, to the extent that it promotes longer-term relationships, may increase credit availability to at least some firms by allowing local banks more flexibility in structuring loan programs over time (for example, Peterson and Rajan, 1995). Long-term relationships, which facilitate loans to many small businesses, may be more difficult to maintain in highly competitive markets because businesses that are earning good profits will likely seek out the lender offering the most favorable, low-cost loan terms. A bank in a less competitive market might offer a below-market interest rate on a loan to help a new business or an ongoing firm experiencing hard times with the expectation that the bank will receive above-market returns on loans when the business is operating successfully. To date, tests of these theories have produced mixed results.36
Data from the annual Summary of Deposits, which reports the location and deposit level of every commercial bank, savings bank, and savings and loan branch as of June 30, are used to examine bank market structure and competition in local areas.37 The primary measure used by antitrust authorities to assess market concentration is the deposit-based Herfindahl-Hirschman Index (HHI), which is computed as the sum of the squared market shares (that is, the shares of total deposits) of each firm in a market. These measures are shown in table 9, along with information on the number of banks and banking offices.38
| Year | MSA | Rural county | ||||||
|---|---|---|---|---|---|---|---|---|
| Number of banks | HHI50 | Number of offices | Population per office | Number of banks | HHI50 | Number of offices | Population per office | |
| 1994 | 28.59 | 1,655 | 157.75 | 3,819 | 5.22 | 3,867 | 9.15 | 2,640 |
| 1995 | 27.64 | 1,660 | 156.87 | 3,830 | 5.23 | 3,837 | 9.25 | 2,647 |
| 1996 | 26.77 | 1,678 | 157.97 | 3,792 | 5.22 | 3,828 | 9.31 | 2,645 |
| 1997 | 26.60 | 1,668 | 160.33 | 3,733 | 5.25 | 3,821 | 9.45 | 2,624 |
| 1998 | 26.60 | 1,700 | 163.10 | 3,677 | 5.30 | 3,813 | 9.57 | 2,582 |
| 1999 | 26.69 | 1,663 | 165.29 | 3,658 | 5.31 | 3,800 | 9.69 | 2,567 |
| 2000 | 27.14 | 1,649 | 167.86 | 3,636 | 5.35 | 3,772 | 9.78 | 2,554 |
| 2001 | 27.27 | 1,632 | 170.45 | 3,586 | 5.39 | 3,748 | 10.23 | 2,411 |
| 2002 | 26.95 | 1,613 | 171.77 | 3,592 | 5.40 | 3,736 | 10.27 | 2,409 |
| 2003 | 27.01 | 1,610 | 175.25 | 3,578 | 5.41 | 3,728 | 10.29 | 2,409 |
| 2004 | 27.10 | 1,609 | 180.45 | 3,542 | 5.45 | 3,723 | 10.34 | 2,407 |
| 2005 | 27.20 | 1,628 | 186.25 | 3,494 | 5.48 | 3,704 | 10.45 | 2,395 |
| 2006 | 28.01 | 1,594 | 193.11 | n.a. | 5.54 | 3,660 | 10.56 | n.a. |
Note. U.S. commercial banking organizations are insured U.S. domestically chartered banks excluding credit card institutions and U.S. branches and agencies of foreign banks. MSA refers to metropolitan statistical area (2003 definition; excludes micropolitan area), and HHI 50 refers to the deposit-based Herfindahl-Hirschman Index with 50 percent thrift inclusion (for details, refer to text). Rural county refers to any county not in an MSA. Offices are those with deposits greater than or equal to zero.
n.a. Not available. Return to table
Source. Summary of Deposits, Annual Report on Deposits and Savings Account by Home and Branch Offices, National Information Center, and the Bureau of Economic Analysis.
The data show that in 2006, 28 banks with 193 offices provided banking services in the average metropolitan statistical area (MSA). The average level of the HHI with 50 percent thrift inclusion was 1594.39 Rural areas are more highly concentrated with respect to the deposits and, on average, have fewer banks and banking offices. In 2006, on average, rural markets had about 5.5 banks with 10.6 offices. The average rural market HHI with 50 percent thrift inclusion was 3660.
Comparing these statistics with those of earlier years, we find that despite the significant amount of consolidation in the banking industry, local banking markets do not appear to have become less competitive. Generally, in both rural and MSA markets, the number of banks and offices has remained constant or increased somewhat, whereas the HHIs have either remained constant or decreased somewhat. Modest deconcentration, in conjunction with a small increase in the number of banks, suggests that the availability of credit from commercial banking organizations is not likely to have declined in recent years.
Savings Institutions
Savings institutions, defined as savings banks and savings and loan associations, provide much less credit to small businesses than do commercial banks. The primary lines of business for these institutions, often referred to as thrifts, tend to involve providing financial services, such as residential mortgage loans, savings accounts, and NOW accounts, to households.40 As of June 30, 2006, the value of small business loans held by savings institutions was slightly more than one-tenth of the value held by banks. Savings institutions held $63 billion in small business loans and $19.7 billion in microloans, compared with $549.8 billion and $115.7 billion, respectively, held by commercial banks.
These differences between banks and savings institutions reflect both the disparity in overall size between the two groups of institutions and the lower proportion of small business lending conducted by the typical savings institution. In 2006, roughly $9.8 trillion in total assets were held by commercial banks and savings institutions, with the latter holding about 20 percent of the total, or $1.9 trillion (table 10). Overall, in 2006, the average thrift held roughly 8.3 percent of its asset portfolio in small business loans and 1.8 percent in microloans (table 11). In contrast, the average commercial bank held roughly 18.6 percent of its portfolio in small business loans and 5.5 percent in microloans (table 6). These substantial differences in small business lending activity between banks and thrifts clearly indicate that the typical savings institution has been much less active than the typical commercial bank in providing credit to small firms.41
| Year | Insured U.S. savings institutions | Total assets (billions of dollars) | Share of domestic assets held (percent) | |||
|---|---|---|---|---|---|---|
| Top 10 | Top 25 | Top 50 | Top 100 | |||
| 1994 | 2,135 | 999 | 21.3 | 33.0 | 44.1 | 56.5 |
| 1998 | 1,643 | 1,034 | 30.2 | 45.6 | 56.8 | 67.1 |
| 2002 | 1,417 | 1,291 | 39.9 | 53.3 | 65.8 | 74.8 |
| 2006 | 1,232 | 1,905 | 48.9 | 64.2 | 75.7 | 82.8 |
Note. Insured U.S. savings institutions includes insured U.S. domestically chartered savings banks and savings and loan associations excluding credit card institutions.
Source: Call Reports (June 30), Thrift Financial Reports (June 30), and the National Information Center database.
| Asset class | Number of savings institutions | Small business loan holdings to assets | Microloan holdings to assets |
|---|---|---|---|
| $250 million or less | 703 | 8.7 | 2.2 |
| $250 million to $1 billion1 | 375 | 8.9 | 1.4 |
| $1 billion to $10 billion1 | 121 | 6.0 | .7 |
| More than $10 billion | 33 | 3.1 | 2.2 |
| All organizations | 1,232 | 8.3 | 1.8 |
Note. Small business loans are business loans of $1 million or less; microloans, a subset of small business loans, are for $100,000 or less. Insured U.S. savings institutions are insured U.S. domestically chartered savings banks and savings and loan associations excluding credit card institutions.
1. Banks with assets of $1 billion are included in the $250 million to $1 billion size class, and banks with assets of $10 billion are included in the $1 billion to $10 billion size class. Return to table
Source. Call Reports (June 30), Thrift Financial Reports (June 30), and the National Information Center database.
Among savings institutions, the most active, or leading, lenders to small businesses were not necessarily the largest institutions in terms of assets. The share of small business lending attributable to the 100 leading thrifts in 2006--63.5 percent--was greater than the share of assets held by those institutions--55.4 percent (table 12). In addition, the 100 largest savings institutions accounted for 82.8 percent of industry assets--a much larger share than was accounted for by the 100 leading loan holders. Among the groups of the 25 and 50 leading loan holders, the relationship between the share of assets and the share of the small business loans held by the savings institutions in those groups is similar to that among the top 100 leading thrift lenders to small businesses. Across the different groups, the top lenders to small businesses consistently held substantially fewer assets than the same number of the largest thrifts.
| Leading savings institutions | Share held by leading holders of small business loans | Share held by leading holders of microloans | ||
|---|---|---|---|---|
| Small business loans | Assets | Microloans | Assets | |
| 2002 | ||||
| Top 10 | 26.2 | 33.7 | 42.9 | 30.8 |
| Top 25 | 36.1 | 40.1 | 51.5 | 36.7 |
| Top 50 | 45.8 | 46.6 | 60.1 | 43.3 |
| Top 100 | 57.8 | 55.1 | 69.1 | 48.3 |
| 2006 | ||||
| Top 10 | 34.2 | 35.2 | 70.4 | 34.3 |
| Top 25 | 43.8 | 42.1 | 76.4 | 39.6 |
| Top 50 | 52.5 | 47.8 | 80.6 | 43.7 |
| Top 100 | 63.5 | 55.4 | 85.4 | 48.6 |
Note. Small business loans are business loans of $1 million or less; microloans, a subset of small business loans, are for $100,000 or less. Insured U.S. savings institutions are insured U.S. domestically chartered savings banks and savings and loan associations excluding credit card institutions.
Source. Call Reports (June 30), Thrift Financial Reports (June 30), and the National Information Center database.
A comparison of the shares of small business lending by thrifts for 2002 with such data for 2006 indicates that the leading savings institutions in terms of small business activity have been accounting for an increasing share of the small business loans and microloans held by savings institutions while the share of industry assets for these institutions has remained relatively constant. This finding suggests that although some thrifts have increasingly specialized in small business lending, they are not predominantly the largest institutions.
Special Issues
This section examines some developments in small business credit markets that have affected the delivery and availability of credit to small businesses and are likely to continue doing so: credit scoring, securitization of small business loans, and community reinvestment activities. Credit scoring may substantially influence the availability of credit to some small businesses by increasing the consistency, speed, and accuracy of credit evaluations while lowering the costs of gathering relevant information. The securitization of small business loans is another development that could significantly affect small businesses' access to credit by providing an efficient funding supplement to direct lending. Community reinvestment activities help financial institutions meet the financing needs of small businesses by focusing on underserved communities.
Credit Scoring
Credit scoring is an automated process by which information about an applicant is used to generate a numeric score that indicates the predicted future performance (that is, the probability of delinquency or default) of a loan to that applicant. An applicant's credit score can be used in various ways, such as determining whether a loan should be approved, denied, or reviewed further, and what the appropriate risk-based interest rate should be on a loan that is made. Currently, scores are used primarily for deciding whether or not to approve a loan application and whether or not to conduct additional analysis; to a lesser extent, they are used for setting loan terms. Scores can also be used for periodic reevaluation of existing loans and for loan monitoring.42 Smaller loans to small businesses are more likely to be automatically approved or denied solely on the basis of credit scores, and larger loans are more likely to receive at least some traditional analysis. However, of those institutions that use credit scores in the origination of small business loans, most use them in conjunction with some traditional analysis regardless of the size of the loan (Cowan and Cowan, 2006).
Two key assumptions underlie credit-scoring models and link the past behavior of former applicants to the prospective behavior of current applicants with similar characteristics at the time of application. First, past performance is viewed as a reliable predictor of future behavior. Second, scoring models assume that, on average, applicants with similar backgrounds and characteristics will perform similarly on their loans.43
Credit scoring potentially increases the consistency and speed of credit evaluations while lowering the costs of gathering relevant information. Much of the information used in generating credit scores can be easily obtained from credit bureaus at relatively low cost. The use of credit scoring can eliminate variation in the way risks are assessed across loan officers or by a single loan officer over time, both of which can be important issues for lenders. Also, because credit-scoring procedures are automated, loan decisions can be rendered in minutes or hours rather than in days or weeks (Avery and others, 1996; and Board of Governors, 2007).44 Credit scoring may also increase a lender's ability to accurately predict loan performance, which could improve the ability to allocate financial resources efficiently and increase social welfare. Using credit scores to set risk-based prices is a promising way that this possible benefit may be realized.
Credit scoring has been used for more than thirty years in underwriting consumer loans but only since the early to mid-1990s in small business lending. Some of the main reasons for the slower implementation of scoring in small business lending are the heterogeneity of individual lending institutions; the heterogeneity of commercial credits, including size and purpose of loan, type of project, and other terms; the lack of standardized loan documentation; and the absence of historical databases required to establish consistent statistical relationships between small business characteristics and loan repayment behavior (Mester, 1997). Over the past decade, the fourth obstacle to implementation has been partly removed, as several developers have constructed sufficiently large databases of small business loan histories to build credit-scoring systems (Berger and Frame, 2005). Today, roughly half of commercial banks use some form of credit scoring in the origination of some of their business loans, and there are general indications that credit scoring may be providing small businesses with more borrowing opportunities (Cowan and Cowan, 2006).
A significant finding in the development of these scoring systems is that information about the owner, particularly with respect to credit history, independent of any financial information on the firm, is a powerful predictor of the performance of small business loans (Mester, 1997; and Berger and Frame, 2005).45 This discovery is important for two reasons. First, if the owner's credit record is a primary predictor of small business loan performance, much of the heterogeneity across commercial credits and loan documentation can be discounted, and the complexity of evaluating applications for small business loans is greatly reduced. Second, data on the owner's credit history, credit scores, and financial standing can often be easily and relatively inexpensively obtained from national credit bureaus and other sources. As a result, in some instances, small business lending may no longer require institutions to have thorough knowledge of the local business environment. Nearly all lenders should be able to obtain much of the information needed to adequately evaluate certain small business loan applications at relatively low cost.
Ready access to the information used for making credit-scored loans, combined with the fact that credit-scoring models are inexpensive to use, suggests that the use of credit scoring should reduce the costs of some small business lending, which could lead to lower prices and increase the amount of credit available to small businesses. The reliance on the credit record of the small business owner suggests that small business credit availability may increase as a result of credit scoring for another reason. Many small firms with financing needs lack a lengthy operating history, and so underwriters are unable to approve loans on the basis of traditional evaluation methods. However, if lenders use credit-scoring models based on the personal credit record of the owner, then applications, even for newly established firms, can be analyzed.
Except for a few banks that have developed proprietary models, most organizations use scoring models obtained from outside vendors (Cowan and Cowan, 2006). The biggest provider of small business credit-scoring models, Fair Isaac Corporation, estimates that a large majority of the leading small business lenders use its credit-scoring systems.46 The reliance by such a large proportion of the industry on one vendor's model has raised concerns that, if the model performs poorly, the resulting problems could be widespread.47
An important issue that has not been resolved is how small business credit-scoring models perform relative to traditional reviews of such loans. Many small business lenders assert that their portfolios of loans that were made using credit scoring have performed well relative to portfolios of older loans made with more traditional methods (Matthews, 2001). An extensive performance record is still evolving. The first small business credit-scoring models were developed during the economic expansion of the 1990s. Banks, regulators, and builders of credit-scoring models remain somewhat concerned that such models will not perform as well during a major economic slowdown.48 However, users of the models generally report that, after their adoption, the riskiness of the small business portfolio either remains about the same or declines and the quality of the credit decision increases (Cowan and Cowan, 2006).
Although publicly available data regarding credit scoring's effect on the availability of small business credit are limited, much of the information in existing studies is based on two sources. The first is a telephone survey conducted by the Federal Reserve Bank of Atlanta in January 1998. The survey attempted to discover from the lead banks of nearly all the 200 largest U.S. banking organizations whether they used credit scoring for small business lending and, if so, how they used it. Roughly half the contacted banks responded to the survey. Of those respondents, about two-thirds reported using some scoring technique for small business loan originations. The available evidence from the study, which focused on large banks, is limited, but it is nonetheless consistent with proponents' claims that the use of scoring models may increase the availability of credit to some small businesses.
The second source of information on the use of credit scoring by commercial banks is a survey sponsored by the U.S. Small Business Administration (SBA) in 2006. The study surveyed a nationally representative sample of commercial banks and completed 327 interviews. Roughly 53 percent of the surveyed banks reported using some scoring technique in the origination of small business loans. The study found that after adopting credit scoring, banks of all sizes generally increased their investment in small business loans relative to total loans over time, a finding that is generally consistent with the hypothesis that the use of scoring models may increase the availability of credit to some small businesses (Cowan and Cowan, 2006).
Akhavein, Frame, and White (2001), using data from the Federal Reserve Bank of Atlanta's survey, found that, among the largest banking organizations in the industry, the larger banking organizations tended to adopt small business credit scoring before their smaller peers. In addition, anecdotal evidence and discussions with bankers indicate that, across all banks in the industry, bank size is positively correlated with the likelihood that a bank will adopt credit scoring. A primary reason that large banks have adopted credit scoring more quickly is that the costs associated with implementing a scoring model can be more easily absorbed. Large banks are also more likely to benefit from any economies of scale that may be associated with scoring-based lending because they have the resources to make a large volume of loans. Smaller banks may be less willing to adopt credit scoring because they may consider the impersonal nature of credit scoring to be inconsistent with the relationship-based approach to small business lending that many community banks adopt.
However, bank size and economies of scale may not be the only factors that affect the adoption of scoring models today. About 70 percent of banks that use small business credit scoring rely solely on the personal credit scores of the owner as opposed to models developed exclusively for small businesses (Cowan and Cowan, 2006). Generally, such scores can be purchased from third-party vendors at relatively low prices. Cowan and Cowan (2006) also find that adoption of credit-scoring models depends less on size per se. Rather, adoption increases with the intensity of lending (as defined by total loans to assets) and decreases with the ratio of small business loans to total loans.49
Credit scoring has also been found to be associated with higher levels of small business lending. Frame, Srinivasan, and Woosley (2001) found that, within their sample of ninety-nine large banking organizations, the use of credit scoring was associated with an increase of 8.4 percent, on average, in the asset-portfolio share of business loans with an origination amount equal to or less than $100,000. In addition, the propensity of banks in the sample to use credit scoring is not explained by either the portfolio share or the level of microloans. The authors caution that their results show the relationship between credit scoring and small business lending only for the organizations included in their study and that they cannot be generalized more broadly. Several other studies based largely on the same data also found that credit scoring is associated with increases in the amount of small business loans equal to or less than $100,000 originated by large banking organizations (Frame, Padhi, and Woosley, 2001; and Padhi, Woosley, and Srinivasan, 1999).
Berger, Frame, and Miller (2005) conducted the most recent analysis of lending data and credit-scoring information based on the 1998 credit-scoring survey. They found some interesting results. The authors concluded that the adoption of credit scoring is associated with expanded credit availability, higher prices (loan rates), and greater risk for lenders to small businesses for loans of $100,000 or less. Over time, credit scoring was also found to be associated with expanding quantities of small business loans at rising average prices and increasing credit risk. Moreover, credit scoring appears to have this effect only when scores, and not other information, are used to make the decision whether or not to extend credit. Credit scoring does not appear to increase the availability of credit between $100,000 and $250,000, but it lowers the risk for this size group of loans. Thus, for these larger small business loans, scoring may help improve the accuracy of evaluating creditworthiness and may reduce underwriting costs.
The finding that credit scoring is associated with different prices and levels of risk suggests that credit scoring increases the ability of banks to charge prices that more closely match the riskiness of applicants. As it becomes easier to use credit scoring to implement risk-based pricing, some borrowers who might not qualify for standard-rate loans underwritten through a more traditional process may be able to receive credit at a higher, more appropriate rate. In addition, some businesses that would qualify for standard-rate, traditionally underwritten loan products could find that their credit scores indicate that they should be asked to pay lower interest rates that better reflect their underlying credit risk. Although these outcomes are possible, Cowan and Cowan (2006) report that as of 2006, only 35 percent of banks that use small business credit scoring use the score for risk-based pricing.
Another issue that has drawn attention is the relationship between credit scoring and fair lending. Proponents of credit-scoring models believe that the use of these models reduces the likelihood that borrowers may be treated differently or unfairly in the lending process because the credit scores are based on objective and consistent criteria that do not include information on the race, gender, or age of the borrower.50 Others have expressed concerns that credit scoring might have disparate effects on groups of entrepreneurs, such as women or minorities, who might be distinguishable by demographic characteristics, or that models may not well represent businesses in certain communities.
To date, there is little quantitative evidence to determine whether such concerns are valid. Nonetheless, several studies have found that credit-scoring models are associated with greater levels of business loans of $100,000 or less in low- and moderate-income (LMI) areas. Padhi, Woosley, and Srinivasan (1999) studied microloan originations in urban census tracts in six southeastern states.51 The authors found that within their sample of large banking organizations, credit scoring had a significantly positive effect on the amount of small business credit extended in low-income communities and a mixed effect in moderate-income communities. Frame, Padhi, and Woosley (2001) analyzed microlending in all census tracts in the same six southeastern states. They found that credit scoring is associated with increased lending in LMI census tracts, and they estimated the increase to be $16.4 million per census tract. The authors also concluded that credit scoring increases the probability that a large banking organization will make microloans in a given LMI census tract. More recently, Frame, Padhi, and Woosley (2004), drawing on data from the Federal Reserve Bank of Atlanta's survey, studied the variation in small business loans less than $100,000 originated in 1997 by banks in each U.S. census tract. They reported that small business credit scoring is associated with increased levels of approximately the same magnitude in low- and moderate-income tracts as in middle- and upper-income tracts.
The increase in lending by banks engaged in credit scoring suggests that these models are expanding the availability of credit to small businesses. Nonetheless, concerns have been raised that the continued adoption of credit-scoring techniques may reduce the availability of credit for small firms that find it hard to qualify for loans based only on a formal credit score. At this time, it is unclear how often creditworthy firms that would not qualify for credit-scored products would be able to obtain financing from a lender that relied on traditional methods of loan evaluation. Even though lending to such firms may be riskier and entail higher costs, community banks and other local lenders are likely to continue to provide this valuable service to many small firms that would not qualify for credit-scored loans, especially if loans are priced appropriately.
Results from a recent SBA survey may mitigate these concerns. Credit scoring is growing in importance in small business lending, and most research finds evidence consistent with an increase in credit availability. At the same time, in 2006, only 53 percent of the surveyed banks used scoring in any form. Moreover, among scoring banks, most institutions did not rely on credit scores alone for loan origination but used scoring in combination with traditional underwriting techniques. In 2006, 17 percent of scoring banks reported approving loans on the basis of credit scores alone if the loan request was $50,000 or less. Only 3 percent of scoring banks would grant automatic loan approval on the basis of credit scores for loans between $50,000 and $100,000. And relationships continued to be the dominant factor in the decision to lend to small businesses, regardless of whether a bank used credit scoring or not (Cowan and Cowan, 2006).
Securitization of Small Business Loans
The securitization of small business loans is a development that could substantially influence the availability of credit. Potential benefits exist for lenders, borrowers, and investors. However, the obstacles to securitizing small business loans are large. Securitization has so far remained modest and is unlikely to substantially increase over the next several years (Temkin and Kormendi, 2003).
Process of Securitization
Securitization is the process of packaging individual loans and other debt instruments, converting the package into a security, and enhancing the credit status or rating to further the security's sale to third-party investors (Kendall and Fishman, 1998). This process has become an efficient funding supplement to direct lending in markets for certain financial assets--notably residential mortgages, credit card receivables, and automobile loans.
Active secondary markets in these assets can benefit all parties. Lenders profit from scale economies or from originating and servicing loans without having to add all of the loans to their own balance sheets. They can therefore improve their return on capital by substituting off-balance-sheet, fee-based sources of income for riskier capital-intensive direct lending. This practice results in added liquidity and potentially greater balance sheet diversity. Borrowers whose loans are eligible for securitization typically enjoy lower financing costs. Investors in the securities, while still earning attractive returns, receive greater liquidity and lower risk than they would by investing directly in the individual loans. Overall, risk is allocated more efficiently.
Successful securitization requires that the costs of pooling individual loans and administering the securities collateralized by the loans be less than the spread between the average contract rate on the underlying loans and the yield investors demand on the securities. Besides various costs for administration, costs stem from obtaining a high credit rating to reassure investors of the reliability of a security's cash flow. High ratings are often obtained through the provision of "credit enhancements" to the security's purchaser by the originator or others. These enhancements sometimes involve an agreement by the originator or other party to absorb, through the portion of the pool held by them, specified first dollar losses of the pool before any loss falls on the investors in the securitized pool.
Securitization generally has thrived in markets in which the costs of acquiring and communicating information to investors about loans and borrowers are low. These conditions usually occur as a result of standardized loan-underwriting criteria; advances in information technology, which make estimating default probabilities and prepayment patterns easier under various economic conditions; and experience in developing and selling loan pools in the secondary market. Most small business loans cannot readily be grouped into large pools that credit agencies and investors can easily analyze: Loan terms and conditions are not homogeneous, underwriting standards vary across originators, and information on historical loss rates is typically limited. The information problems associated with small business loans can be overcome or offset to a degree by some form of credit enhancement mechanism, as in the case of the Small Business Administration's 7(a) loans.52 However, the more loss protection needed to sell the securities, the smaller are both the net proceeds from the sale of the securities and the incentive for lenders to securitize their loans. Small business loans are an asset for which the high transaction costs of providing credit enhancements have made many potential securitizations unprofitable.
A significant step in encouraging the development of markets for securitized small business loans has been the removal of certain regulatory impediments. The Riegle Community Development and Regulatory Improvement Act of 1994 extended to issuers of securities backed by small business loans (and commercial mortgages) some of the regulatory accommodation provided by the Secondary Mortgage Market Enhancement Act of 1984 to issuers of residential-mortgage-backed securities. The benefits include the elimination of state-level investment restrictions and securities registration requirements and the establishment of favorable federal regulatory treatment. Investment restrictions for federally regulated banks, thrifts, and credit unions and for state-chartered thrifts, insurance companies, and pension funds were relaxed as well. Also, risk-based capital requirements for depository institutions that securitize loans but retain "recourse" on subordinated classes of securities were reduced.
A remaining impediment to the development of markets for securitized small business loans has been the lack of more-uniform standards for underwriting and loan documentation. However, the use of credit-scoring systems in the origination of small business loans could address this problem, at least to some extent, by providing a credible, low-cost measure of the expected performance of small business loans. As a result, the information gap associated with small business lending could be closed and the volume of securitizations could increase, although to date this scenario has not occurred to any large extent.53
Securitization Activity
Most of the small business loans that have been securitized involved the guaranteed portion of loans made under the Small Business Administration's 7(a) Guaranty Loan program. Over the past several years, sales of 7(a) loans in the secondary market have increased at about the same rate as the growth in 7(a) loans. In 2006, the latest year for which data are available, new secondary-market dollar volume for 7(a) loans rose to a record high of $4.6 billion. The sales accounted for about 45 percent of the guaranteed portion of the $14.5 billion of new 7(a) loans made during 2006 (U.S. Small Business Administration, various years; and Secondary Market Reports, various years). These securitizations have been fairly common because they do not involve the risk and information impediments typically associated with the securitization of small business loans. SBA 7(a) loans tend to be highly standardized because the underlying loans are often backed by similar types of collateral and loan documentation. In addition, the originators are SBA "preferred lenders" and are perceived to have clear and rigorous underwriting standards that are consistently applied. Perhaps most important, the SBA provides a guarantee if loan payments are missed, and so packages of these loans carry much less credit risk than the typical small business loan. Securitizations of the unguaranteed portion of SBA 7(a) loans have been much less common, equaling roughly 10 percent of such credit. Without an SBA guarantee, it is apparently much more difficult to offer packages of SBA loans to investors at a rate that is sufficiently profitable to the lender.
Regulatory constraints may have also contributed to the fairly limited volume of securitizations of the unguaranteed portion of 7(a) loans. Before 1997, only nonbanks could be involved with such securitizations. In 1997, however, banks were allowed to securitize the unguaranteed portion of 7(a) loans on an interim basis, and in 1999, that power was granted in a final rule. The rule also requires banks that securitize 7(a) loans to maintain a low delinquency level to ensure that securitized loans are of high quality. The SBA accomplishes this goal by performing quarterly examinations of lenders, and if loan quality falls sufficiently, then the lender loses its preferred lender status, which enables banks to fund SBA loans without the SBA's involvement. The SBA normally conducts loan quality examinations biennially.
Finally, the market for securitizations of conventional, or non-SBA, loans has been marked by the most severe impediments. Between 1994 and 2001, roughly $4 billion in non-SBA guaranteed loans were securitized (Board of Governors, 2002). Since then, the market has grown somewhat each year; at most $5.6 billion in loans were securitized in 2006.54 Although the volume has grown, it is still small relative to the total amount of small business loans that could be securitized. As of June 2006, banks held roughly $550 billion of small business loans outstanding. The SSBF suggests that in 2003 banks held about 57 percent of such loans. If we assume that in 2006 banks held the same percentage of outstanding small business loans as they did in 2003, then the estimated total amount of these loans in 2006 was roughly $965 billion.55 A small portion of these were SBA-guaranteed loans.56 Even though many of these loans would probably be unsuitable for securitization, the relative magnitudes of all small business loans made and those that have been securitized indicate that securitization of conventional small business loans has been modest. Hence, there is little evidence, on balance, to suggest that the securitization of non-SBA loans will become an important component of small business financing in the foreseeable future.
Community Reinvestment Activities
Community reinvestment activities help financial institutions meet the financing needs of small businesses. Although their effect on credit availability is still difficult to measure, these efforts have become better known since 1996, when the supervisory agencies of federal financial institutions began to collect, analyze, and make public geographically coded data on small business loans under the Community Reinvestment Act (CRA). These data are starting to show the efforts of financial institutions in helping to meet credit needs for very small, start-up firms and undercapitalized small businesses located in low- and moderate-income areas, often viewed as disadvantaged in credit markets.
Community Reinvestment Act
Small business lending in low- and moderate-income areas may be influenced by financial institution obligations under the CRA. The CRA does not require that banks lend to small businesses, but it reaffirms that federally insured financial institutions have continuing and affirmative obligations to help meet the credit needs of the communities they serve, including low- and moderate-income neighborhoods. Under the CRA, the bank regulatory agencies regularly review institutions' performance in this endeavor and prepare publicly available written evaluations, which include ratings. The CRA requires that supervisory agencies consider a financial institution's CRA performance when evaluating an institution's application for expansion or relocation of depository facilities through branching, mergers, or acquisitions. Decisions on these applications are made public.
Although much of the small business lending of financial institutions occurring in low- and moderate-income areas cannot be directly attributed to CRA, bankers and community representatives indicate that some of it is the result of individual banks responding to their CRA obligation. Some lending activity also results from interaction with community representatives and government agencies familiar with CRA and the possible roles that financial institutions can play in community development and reinvestment.
Bank-Controlled Financing Vehicles
Banks can promote the extension of capital to small business in many ways. Beyond lending programs that are part of a bank's normal operating process, banks often develop or work with specially created entities focused on this objective. Some of these entities operate wholly within a bank's legal structure, some are partnerships with other service providers, and still others are stand-alone organizations in which banks invest.
Bank-Owned or Bank-Affiliated Community Development Corporations
A common type of community reinvestment intermediary used by banks to help finance small firms and minority businesses is the bank-owned or bank-affiliated community development corporation (CDC). Under certain conditions, bank holding companies, national- and state-chartered commercial banks, and savings institutions may make equity investments in small businesses through a CDC or a limited liability company. Generally, these entities can make debt and equity investments in small businesses when the firms are located in low- or moderate-income areas and the jobs created and services provided benefit primarily low- and moderate-income persons. Although most CDCs operate at the local level, some are statewide in their focus. For example, the Indiana Community Business Credit Corporation (ICBCC) is a for-profit, multibank CDC that provides supplemental financing to expanding small businesses.
Bank members submit applications to the ICBCC and must be willing to provide first-position financing for at least 50 percent of the loan amount. Depending on the availability of other funding sources, the ICBCC may lend up to the balance needed for such purposes as acquisition of fixed assets or working capital. There are currently thirty-two financial institution members. Since its inception in 1986, the ICBCC has made $48 million in loans to 111 companies for small business development projects worth more than $232 million.
Consortium Lending Organizations and Loan Pools
Another common form of intermediary is the consortium lending organization that specializes in financing young or start-up small and minority businesses. By participating in such consortiums, banks can leverage the amount of capital devoted to small business finance and mitigate the risks and costs of lending to small firms. These loan consortiums are usually organized in corporate form and may be nonprofit or for-profit organizations. Although many are organized primarily by banks, they often have nonbank participants such as insurance companies, utilities, other corporations, religious institutions, and other institutional investors. Other loan consortiums are quasi-public arms of state, regional, or local governments.
One example is the California Economic Development Lending Initiative (CEDLI), a for-profit, multibank consortium CDC created in 1995, which gives financial and technical assistance to small businesses and nonprofit economic development groups throughout California. CEDLI makes small business loans, often to minority- and women-owned businesses that do not meet the underwriting criteria of banks or government programs. It has also financed community-based economic development corporations and small business assistance centers in urban and rural areas of California and helps finance real-estate-based loans for projects sponsored by community organizations serving local needs.
CEDLI works through various partnership arrangements with member banks, nonprofit groups, and public-sector programs. Through its co-lending program, member banks can provide financing to small businesses that do not meet standard underwriting criteria and, with CEDLI's loan participation arrangement, can reduce their risk exposure. Membership currently includes forty-five financial institutions and four private corporations. Investments totaling $153 million have been made in 643 small businesses and community organizations throughout California, primarily to small businesses or community organizations in low- or moderate-income communities. CEDLI's bank partners have matched these investments with more than $357 million in co-lending.
Partnerships with Nonprofit Organizations
Because many institutions do not have the expertise or cannot bear the development costs of special small business finance programs, especially those focusing on reinvestment areas, many banks have created or assisted intermediaries that support small businesses in their communities. Indeed, a major development in bank reinvestment programs has been formal and informal working partnerships among banks, regional or neighborhood nonprofit organizations, and community-based development corporations. These organizations identify prospective borrowers, provide loan counseling, serve as experienced developers in low-income and minority areas, and assist banks in marketing loan programs. They have also been effective in helping reduce the high transaction costs often associated with lending to very small firms. These organizations also frequently package financial resources for small firms from several public and private sources. Overall, these types of partnerships enable banks to make small business loans that might not otherwise have been financially feasible.
One example of this kind of arrangement is the Renasant Center for IDEAs, a business incubator opened in 2006 in Tupelo, Mississippi, with resources from city, county, state, and federal governments. Renasant Bank entered into a novel five-year agreement to provide a significant share of the center's operating funds in exchange for naming rights--an arrangement not unlike the way many public sports arenas are branded. In addition to providing facilities, business mentoring, and information technology assistance, the center offers training, financing, and networking opportunities for new businesses. Before the end of its first year of operation, the facility housed five new businesses and was more than one-third occupied.
Government-Sponsored Vehicles
Support for small business development has been a priority of policymakers for several decades, and federal, state, and local agencies have sponsored programs that assist in channeling capital to small business. At the federal level, the agency with the most direct role in this objective is the Small Business Administration (SBA), which was created by the Congress in 1953 to help entrepreneurs form successful small enterprises. More recently, the Department of the Treasury's Community Development Financial Institutions Fund was established to support growth and revitalization of low- and moderate-income communities. These agencies provide vehicles that enable depository financial institutions to leverage funds provided to small businesses and increase access to capital for entrepreneurs.
U.S. Small Business Administration Programs
The SBA provides financing to young and growing small firms through channels such as the 7(a) Guaranty Loan program, small business investment companies and the Microloan program, SBA 504 certified development companies, and a program specializing in disaster recovery assistance.57
7(a) Guaranty Loan program. One of the primary SBA programs is the 7(a) Guaranty Loan program, which provides lenders with a credit-enhancing mechanism (a loan guaranty) for extending credit to small businesses unable to secure conventional financing. By lending to borrowers that meet the agency's underwriting and eligibility criteria, the risk to lenders is significantly reduced. The SBA provides a guaranty of as much as 85 percent for loans less than or equal to $150,000 and a guaranty of as much as 75 percent for loans greater than $150,000; the maximum loan amount is $2,000,000. However, under the SBA Express Loan program, which requires less loan documentation, only 50 percent of the loan is guaranteed, and the maximum loan amount is $350,000. These loans average about $60,000. In fiscal year 2006, the SBA guaranteed more than 97,000 7(a) loans totaling $14.5 billion to more than 80,000 small businesses. This activity accounts for about 90 percent of the number of SBA loans and 70 percent of the total value of SBA lending activity.
Small business investment companies (SBICs) and the Microloan program. The SBIC program was initiated in 1957 to provide debt and equity capital to young and growing companies. Although the venture capital market has matured, the SBIC program remains important because many small, growing firms find it difficult to obtain equity financing from venture capital companies. Banks and bank holding companies can own and operate SBICs, which are licensed and regulated by the SBA. SBICs can be organized as separate subsidiaries of one institution or of multiple institutions and other private investors or can be controlled by private interests not affiliated with financial institutions. To obtain capital, SBICs often sell long-term debentures that are guaranteed by the SBA. The proceeds of these debentures are used to provide longer-term financing for small businesses, often in conjunction with the issuance of equity interests in the small business to the SBIC. In fiscal year 2006, SBICs financed 1,488 firms, resulting in $477 million of funding. The average SBIC financing was slightly more than $320,000.
The SBA's Microloan program provides very small loans to start-up, newly established, or growing small business concerns. Under the program, the SBA makes funds available to nonprofit community-based lenders (intermediaries), which, in turn, make loans to eligible borrowers in amounts up to a maximum of $35,000. In 2006, nearly 2,400 of these loans were funded, and the average loan size was about $13,000.
SBA 504 certified development companies. Banks often work with certified development companies to leverage funds for small business financing. These entities are generally nonprofit corporations specializing in small business finance and are certified by the SBA to participate in the agency's Section 504 financing program. The SBA 504 program is intended to help small businesses expand and to create jobs by providing certified development companies with the ability to issue SBA-guaranteed long-term debentures to fund small firms. To obtain certification from the SBA, the applying entity must meet certain requirements, such as a board membership that represents government, private lending institutions, and community and business organizations.
Certified development companies provide longer-term financing to growing small businesses, usually for real estate development, plant, or equipment needs. They also offer technical assistance to small businesses and develop financing packages. A typical package is a combination of at least three sources of funds: 50 percent must be funded by a private financial institution, 40 percent is funded by issuance of an SBA-guaranteed debenture, and 10 percent comes from business-owner equity or independent capital funds provided by the certified development company. Usually, the financial institution retains a first lien on collateral but risks only 40 percent of the loan package. In fiscal year 2006, 9,720 of these loans, with a value of $5.7 billion, were funded.
Disaster recovery assistance. The SBA has a long-standing program to assist businesses recovering from disasters. In fiscal year 2005, the SBA funded 41,651 loans totaling $1.3 billion for this purpose. Damage caused by Hurricanes Katrina, Rita, and Wilma in the fall of 2005 substantially increased demand for these loans. As a result, during fiscal year 2006, the SBA funded more than 138,000 disaster assistance loans totaling $8.8 billion. The overwhelming majority of these loans were in the Gulf Coast region.
Community Development Financial Institutions
Community development financial institutions (CDFIs) develop a range of strategies and products to fulfill their primary mission of community development. They are certified by the U.S. Department of the Treasury and have access to the CDFI Fund, which has made $820 million in investments in CDFIs. As of April 1, 2007, there were 786 CDFIs in the United States. These institutions can be banks, credit unions, loan funds, venture capital funds, or other financial service providers with community development as their primary objective. In an effort to measure the effect of CDFIs, the CDFI Data Project, an industry collaborative that ensures access to and use of data to improve business practices and attract resources to the CDFI field, surveyed 496 members for fiscal year 2005 and found that $4.3 billion in financing had been provided during that year. Although housing is the dominant investment area for CDFIs, 13 percent of the dollar amount of outstanding CDFI financing went to small enterprises, and another 2 percent went to microenterprises, for a total of $836 million in overall financing outstanding. In fiscal year 2005 alone, CDFIs provided financing to more than 9,000 businesses.
Banks can support the capitalization of CDFIs through the Bank Enterprise Award program, which provides incentives for regulated commercial banks and savings institutions to invest in CDFIs and to increase their lending and provision of financial services in distressed communities. Banks and thrifts receiving awards in fiscal year 2006 provided $318 million in financial support or technical assistance directly to CDFIs. This amount included a $70 million increase in their loan, deposit, and technical assistance to CDFIs and a $245 million increase in loans and investments in distressed communities.
Emerging Trends
Numerous trends in the community development field either are just beginning to significantly influence the delivery of capital to small businesses by financial institutions or have the potential to do so in the near future. Some of these trends are due primarily to actions of financial services firms themselves--for example, the proliferation of financial literacy and outreach programs. Others are due to the actions of government--such as the New Markets Tax Credit--to stimulate more lending. Still other new efforts are focused on new hybrid partnerships among banks and nonbank entities such as local microloan funds. Following is a brief discussion of the effect of these three factors.
Education Programs and Outreach
Data from the Census Bureau indicate that, between 1997 and 2002, the number of minority-owned businesses grew from about 3.2 million to more than 4.1 million. In addition, the Census Bureau estimates that, during this five-year period, the number of women-owned businesses increased 20 percent, to 6.5 million enterprises. These gains have occurred at the same time that financial institutions have intensified efforts at outreach and education, especially for nontraditional customers, an indication that the rapid increases in the number of minority- and women-owned businesses may result, in part, from increased access to appropriate financing to fund the start-up and growth of businesses.
More and more financial institutions and their partners are finding it in their self-interest to engage in training and education initiatives that increase opportunity and success for business ownership to anyone with a viable business concept. The Consumer Bankers Association reports that 74 percent of its 2004 survey respondents offer small business development training either directly or through partners (Consumer Bankers Association, 2004). One example of a bank-sponsored program is the SunTrust Small Business Resource Center in Washington, D.C. The center, created in 1995, assisted nearly 200 small business owners last year. In partnership with Southeastern University, it also hosted forty-one small business classes in 2006.
New Markets Tax Credit
The New Markets Tax Credit (NMTC), a part of the Community Renewal Tax Relief Act of 2000, has spurred investment of new private capital in vehicles known as community development entities (CDEs). Investors take a 39 percent tax credit on investments in CDEs, which then make loans and equity investments in low- and moderate-income communities. CDFIs are pre-qualified as CDEs, and other entities can become qualified to participate in this program. The U.S. Government Accountability Office reports that CDEs used their NMTC allocations to make investments totaling $3.1 billion through fiscal year 2005. Businesses used 21 percent of this amount, or more than $650 million, for fixed assets or working capital (U.S. Government Accountability Office, 2007). Although the law does not specify that beneficiaries of the NMTC should be small businesses, it does require that a project be located in a low-income area. That requirement, and the role played by CDEs in the process, increases the likelihood (to an extent greater than would be the case for general business lending) that small businesses will be the beneficiaries of this financing.
Community-Based Microenterprise Loan Funds
A number of institutions are targeting very small firms and start-up businesses, and many are working at the neighborhood level or focusing on minority business development. Many banks are offering new programs featuring loans less than $100,000, including some as small as $1,000 to $5,000 for very small businesses. They are increasingly targeting minority businesses and are continuing to use public-sector programs, such as loan guarantees, to make small business loans. Community-based nonprofit organizations often work with financial institutions to deliver financing, technical assistance, training, and other services to microbusinesses. Such organizations also develop their own funds from which to make direct loans to meet the needs of their target markets, which are often low- and moderate-income individuals or areas and women. For example, Accion San Diego, a part of the Accion USA Network (the largest microlending program in the country), provides financing to small businesses in that city. From 1994 through March 2007, Accion San Diego disbursed more than $10 million through more than 2,000 loans made to more than 1,200 microentrepreneurs.
Appendix: The 2003 Survey of Small Business Finances
The 2003 Survey of Small Business Finances collected information about the types and sources of financing used by small businesses in 2003. Interviews were conducted with 4,240 firms selected to provide a representative sample of all small businesses in the United States. The 2003 survey was sponsored by the Board of Governors. In it, small businesses are defined as enterprises that were operating under current ownership during December 2003 and at the time of the interview had fewer than 500 employees and owners working in the firm, excluding agricultural enterprises, financial institutions, not-for-profit institutions, government entities, and subsidiaries controlled by other corporations. For details about the survey, see Mach and Wolken (2006) or visit www.federalreserve.gov/pubs/oss/oss3/nssbftoc.htm for more information. The survey solicited information about the characteristics of each firm and its top three owners (for example, ages of firm and owners, industrial classification, and type of business organization), the firm's income statement and balance sheet, and details of the use and sources of financial services. The survey also obtained information about the firm's recent borrowing and credit application experience, the use of trade credit, and capital infusions. The 2003 SSBF is the most comprehensive source of data available on small businesses' use of financial services. Highlights of the 2003 survey and some comparisons with data from 1993 and 1998 are presented in the tables in this appendix.58
| Category of firm | Number in sample1 | Percentage of population2 | MEMO 1998 percentage of population2 |
|---|---|---|---|
| All firms | 4,240 | 100.0 | 100.0 |
| Number of employees3 | |||
| 0-1 | 640 | 20.6 | 21.9 |
| 2-4 | 1,167 | 40.0 | 41.5 |
| 5-9 | 632 | 20.2 | 19.6 |
| 10-19 | 389 | 10.6 | 8.8 |
| 20-49 | 566 | 6.0 | 5.6 |
| 50-99 | 444 | 1.7 | 1.6 |
| 100-499 | 402 | 1.0 | 1.2 |
| Fiscal year sales (thousands of dollars) | |||
| Less than 25 | 430 | 14.6 | 16.3 |
| 25-49 | 289 | 9.9 | 9.4 |
| 50-99 | 350 | 11.6 | 14.3 |
| 100-249 | 598 | 19.8 | 21.9 |
| 250-499 | 459 | 14.3 | 13.3 |
| 500-999 | 441 | 12.2 | 10.2 |
| 1,000-2,499 | 532 | 10.0 | 8.1 |
| 2,500-4,999 | 338 | 3.6 | 3.3 |
| 5,000-9,999 | 319 | 2.3 | 1.6 |
| 10,000 or more | 483 | 1.7 | 1.6 |
| Assets at year-end (thousands of dollars) | |||
| Less than 25 | 934 | 31.3 | 35.0 |
| 25-49 | 372 | 12.5 | 12.8 |
| 50-99 | 447 | 13.5 | 14.2 |
| 100-249 | 573 | 15.9 | 15.7 |
| 250-499 | 401 | 10.0 | 9.0 |
| 500-999 | 361 | 7.1 | 6.0 |
| 1,000-2,499 | 439 | 5.8 | 4.3 |
| 2,500-4,999 | 279 | 1.9 | 1.6 |
| 5,000 or more | 434 | 2.0 | 1.4 |
| Organizational form | |||
| Proprietorship | 1,347 | 44.5 | 49.4 |
| Partnership | 344 | 8.7 | 7.0 |
| S corporation | 1,548 | 31.0 | 23.9 |
| C corporation | 1,001 | 15.7 | 19.8 |
| Standard Industrial Classification | |||
| Construction and mining (10-19) | 440 | 11.8 | 11.9 |
| Manufacturing (20-39) | 499 | 7.1 | 8.3 |
| Transportation (40-49) | 171 | 3.8 | 3.7 |
| Wholesale trade (50-51) | 288 | 5.9 | 7.1 |
| Retail trade (52-59) | 821 | 18.4 | 18.9 |
| Insurance and real estate (60-69) | 262 | 7.2 | 6.5 |
| Business services (70-79) | 934 | 25.1 | 24.8 |
| Professional services (80-89) | 823 | 20.6 | 18.5 |
| Years under current ownership | |||
| 0-4 | 686 | 20.6 | 22.4 |
| 5-9 | 822 | 22.1 | 22.8 |
| 10-14 | 666 | 16.0 | 19.1 |
| 15-19 | 596 | 12.6 | 12.9 |
| 20-24 | 512 | 10.8 | 8.8 |
| 25 or more | 957 | 17.9 | 14.0 |
| Census region of main office | |||
| Northeast | 756 | 19.8 | 18.9 |
| New England | 247 | 6.0 | 5.2 |
| Middle Atlantic | 509 | 13.8 | 13.7 |
| Midwest | 1,015 | 21.1 | 21.8 |
| East North Central | 652 | 14.2 | 14.6 |
| West North Central | 363 | 6.9 | 7.2 |
| South | 1,386 | 34.7 | 32.7 |
| South Atlantic | 747 | 18.9 | 16.9 |
| East South Central | 231 | 5.3 | 5.5 |
| West South Central | 408 | 10.5 | 10.4 |
| West | 1,083 | 24.4 | 26.6 |
| Mountain | 344 | 7.6 | 6.6 |
| Pacific | 739 | 16.8 | 20.0 |
| Urbanization at main office | |||
| Urban | 3,350 | 79.4 | 79.9 |
| Rural | 890 | 20.6 | 20.1 |
| Number of offices | |||
| One | 3,235 | 85.9 | 87.8 |
| Two | 474 | 9.4 | 8.6 |
| Three or more | 531 | 4.6 | 3.6 |
| Sales area | |||
| Primarily within the U.S. | 3,995 | 95.4 | 95.5 |
| International or global | 245 | 4.6 | 4.5 |
| Owners' participation | |||
| Owner managed | 3,794 | 94.0 | 92.5 |
| Hired | 387 | 5.7 | 7.5 |
| Race, ethnicity, and sex of majority owners | |||
| Nonwhite or Hispanic | 484 | 13.0 | 14.6 |
| Non-Hispanic white | 3,697 | 86.4 | 85.4 |
| White | 3,853 | 90.7 | 90.5 |
| Black | 119 | 3.7 | 4.2 |
| Asian or Pacific Islander | 170 | 4.2 | 4.5 |
| American Indian or Alaska Native | 58 | 1.3 | .8 |
| Hispanic | 149 | 4.1 | 5.6 |
| Non-Hispanic | 4,032 | 95.6 | 94.4 |
| Female | 783 | 22.3 | 24.3 |
| Male | 2,923 | 64.6 | 72.0 |
| Ownership equally divided by sex | 475 | 12.8 | 3.7 |
Note. Details may not sum to totals because of rounding.
1. Numbers are unweighted. Return to table
2. Percentages are weighted to adjust for differences in sampling and response rates and reflect population rather than sample measures. Return to table
3. Number of owners working in the business plus number of full- and part-time workers. Return to table
Source. 1998 and 2003 Surveys of Small Business Finances.
| Category of firm | Any traditional type | Credit line | Mortgage loan | Vehicle loan | Equipment loan | Capital lease | Other traditional type |
|---|---|---|---|---|---|---|---|
| All firms | 60.4 | 34.3 | 13.3 | 25.5 | 10.3 | 8.7 | 10.1 |
| Number of employees1 | |||||||
| 0-1 | 42.1 | 19.3 | 5.6 | 17.4 | 4.3 | 4.0 | 7.0 |
| 2-4 | 53.9 | 27.2 | 12.6 | 22.0 | 5.2 | 6.6 | 7.1 |
| 5-9 | 72.7 | 43.1 | 15.8 | 30.8 | 13.6 | 11.6 | 13.3 |
| 10-19 | 77.4 | 50.2 | 19.2 | 35.9 | 21.1 | 12.1 | 16.5 |
| 20-49 | 82.7 | 57.5 | 21.4 | 36.2 | 26.3 | 16.0 | 15.7 |
| 50-99 | 87.4 | 68.0 | 18.5 | 36.5 | 27.6 | 22.9 | 16.5 |
| 100-499 | 93.8 | 82.3 | 27.9 | 35.9 | 32.6 | 27.9 | 18.6 |
| Fiscal year sales (thousands of dollars) | |||||||
| Less than 25 | 29.4 | 12.3 | 5.3 | 10.2 | 1.8 | 1.9 | 6.0 |
| 25-49 | 45.6 | 14.1 | 8.8 | 17.3 | 2.5 | 5.8 | 8.9 |
| 50-99 | 49.5 | 24.1 | 10.1 | 23.0 | 7.4 | 3.6 | 5.3 |
| 100-249 | 59.9 | 29.2 | 13.2 | 21.9 | 8.0 | 9.1 | 9.1 |
| 250-499 | 70.7 | 39.8 | 19.1 | 27.9 | 10.0 | 10.4 | 12.5 |
| 500-999 | 80.0 | 47.8 | 15.6 | 38.7 | 16.7 | 12.8 | 14.4 |
| 1,000-2,499 | 76.4 | 56.6 | 18.9 | 35.5 | 21.4 | 13.1 | 12.5 |
| 2,500-4,999 | 79.9 | 65.2 | 14.6 | 37.2 | 19.0 | 15.1 | 15.0 |
| 5,000-9,999 | 90.4 | 65.6 | 22.3 | 49.4 | 28.4 | 16.3 | 14.0 |
| 10,000 or more | 90.7 | 83.8 | 16.3 | 33.3 | 23.2 | 20.9 | 18.1 |
| Assets at year-end (thousands of dollars) | |||||||
| Less than 25 | 39.0 | 16.2 | 4.3 | 16.2 | 3.3 | 5.2 | 6.1 |
| 25-49 | 57.2 | 31.0 | 6.8 | 23.5 | 6.5 | 8.3 | 5.5 |
| 50-99 | 66.2 | 32.8 | 13.8 | 26.9 | 9.1 | 9.4 | 13.4 |
| 100-249 | 67.2 | 37.1 | 16.3 | 31.4 | 12.5 | 7.9 | 10.3 |
| 250-499 | 78.0 | 48.5 | 22.4 | 32.3 | 17.6 | 12.3 | 12.9 |
| 500-999 | 79.0 | 55.7 | 23.8 | 30.5 | 16.5 | 12.0 | 19.7 |
| 1,000-2,499 | 82.1 | 62.2 | 27.3 | 39.5 | 24.6 | 12.5 | 12.2 |
| 2,500-4,999 | 88.1 | 64.8 | 27.6 | 34.5 | 26.7 | 20.6 | 21.4 |
| 5,000 or more | 80.3 | 66.6 | 28.7 | 28.0 | 17.9 | 15.9 | 14.0 |
| Organizational form | |||||||
| Proprietorship | 52.4 | 24.2 | 11.1 | 21.5 | 6.9 | 5.5 | 9.5 |
| Partnership | 57.1 | 28.7 | 20.5 | 20.4 | 10.4 | 8.9 | 6.2 |
| S corporation | 70.0 | 43.8 | 15.4 | 31.3 | 11.9 | 11.7 | 12.4 |
| C corporation | 66.2 | 47.2 | 11.3 | 28.2 | 16.6 | 12.0 | 9.7 |
| Standard Industrial Classification | |||||||
| Construction and mining (10-19) | 70.7 | 44.6 | 13.6 | 43.9 | 16.5 | 6.3 | 7.5 |
| Manufacturing (20-39) | 70.0 | 47.8 | 18.0 | 27.3 | 17.5 | 10.9 | 10.5 |
| Transportation (40-49) | 79.1 | 36.5 | 9.5 | 42.9 | 16.0 | 9.3 | 20.0 |
| Wholesale trade (50-51) | 62.6 | 49.4 | 13.1 | 30.1 | 7.1 | 7.8 | 9.6 |
| Retail trade (52-59) | 58.9 | 32.8 | 14.7 | 19.7 | 9.2 | 7.3 | 14.0 |
| Insurance and real estate (60-69) | 59.2 | 28.8 | 23.1 | 21.1 | 4.0 | 5.3 | 5.4 |
| Business services (70-79) | 56.4 | 28.4 | 11.2 | 25.0 | 7.9 | 7.4 | 10.1 |
| Professional services (80-89) | 54.1 | 29.4 | 10.1 | 17.3 | 10.2 | 13.5 | 8.1 |
| Years under current ownership | |||||||
| 0-4 | 61.8 | 30.2 | 13.2 | 21.2 | 7.0 | 11.0 | 15.4 |
| 5-9 | 59.9 | 30.2 | 11.7 | 24.9 | 11.1 | 7.1 | 12.8 |
| 10-14 | 60.4 | 35.1 | 14.6 | 28.0 | 10.8 | 10.4 | 7.7 |
| 15-19 | 61.4 | 40.0 | 12.5 | 28.8 | 11.4 | 9.4 | 7.5 |
| 20-24 | 58.1 | 33.9 | 13.7 | 25.2 | 12.6 | 8.4 | 5.4 |
| 25 or more | 60.2 | 39.3 | 14.5 | 26.9 | 10.4 | 6.3 | 7.7 |
| Urbanization at main office | |||||||
| Urban | 60.2 | 33.7 | 12.2 | 24.9 | 9.4 | 9.4 | 10.1 |
| Rural | 61.5 | 36.2 | 17.6 | 27.9 | 13.7 | 6.0 | 10.4 |
| Number of offices | |||||||
| One | 58.1 | 31.8 | 12.9 | 24.9 | 9.7 | 7.7 | 9.0 |
| Two | 70.4 | 45.5 | 13.2 | 27.4 | 11.5 | 14.1 | 18.5 |
| Three or more | 82.7 | 56.8 | 21.0 | 33.9 | 18.4 | 17.2 | 14.8 |
| Sales area | |||||||
| Primarily within the U.S. | 60.8 | 34.4 | 13.5 | 25.7 | 10.4 | 8.7 | 10.1 |
| International or global | 51.8 | 32.2 | 8.4 | 22.6 | 8.6 | 8.7 | 11.5 |
Note. Data are weighted to adjust for differences in sampling and response rates and reflect population rather than sample measures.
1. Number of owners working in the business plus number of full- and part-time workers. Return to table
Source. 2003 Survey of Small Business Finances.
| Category of firm | Any non-traditional type | Loan from owner1 | Credit card | Trade credit | MEMO Traditional or non-traditional type |
|
|---|---|---|---|---|---|---|
| Personal | Business | |||||
| All firms | 88.8 | 30.3 | 46.7 | 48.1 | 60.1 | 92.9 |
| Number of employees2 | ||||||
| 0-1 | 77.9 | 25.7 | 48.6 | 32.0 | 35.7 | 83.8 |
| 2-4 | 88.6 | 27.0 | 48.1 | 45.7 | 55.9 | 93.3 |
| 5-9 | 93.4 | 33.3 | 47.8 | 56.8 | 71.6 | 96.5 |
| 10-19 | 95.2 | 31.3 | 45.6 | 59.7 | 80.4 | 97.3 |
| 20-49 | 97.6 | 36.0 | 34.4 | 61.7 | 85.0 | 99.8 |
| 50-99 | 97.1 | 32.9 | 34.6 | 63.5 | 88.5 | 98.3 |
| 100-499 | 96.4 | 28.4 | 32.2 | 71.4 | 85.4 | 98.9 |
| Fiscal year sales (thousands of dollars) | ||||||
| Less than 25 | 74.2 | 22.3 | 48.1 | 25.7 | 27.7 | 79.2 |
| 25-49 | 80.7 | 33.5 | 51.7 | 34.1 | 40.2 | 89.2 |
| 50-99 | 85.1 | 34.9 | 46.5 | 41.0 | 46.3 | 91.4 |
| 100-249 | 91.5 | 28.0 | 49.9 | 48.2 | 61.0 | 94.5 |
| 250-499 | 92.9 | 27.7 | 49.4 | 54.9 | 70.0 | 96.3 |
| 500-999 | 96.1 | 27.7 | 44.1 | 62.5 | 82.2 | 98.4 |
| 1,000-2,499 | 96.7 | 36.3 | 40.9 | 63.6 | 79.3 | 98.7 |
| 2,500-4,999 | 97.8 | 38.7 | 39.7 | 61.9 | 87.6 | 100.0 |
| 5,000-9,999 | 92.5 | 26.9 | 30.8 | 63.3 | 83.6 | 99.5 |
| 10,000 or more | 98.3 | 30.0 | 35.8 | 68.9 | 89.8 | 99.9 |
| Assets at year-end (thousands of dollars) | ||||||
| Less than 25 | 81.0 | 23.8 | 47.3 | 35.9 | 38.4 | 85.5 |
| 25-49 | 89.2 | 28.1 | 47.4 | 48.1 | 57.6 | 93.5 |
| 50-99 | 92.0 | 28.1 | 51.4 | 47.4 | 64.8 | 95.4 |
| 100-249 | 91.4 | 31.5 | 43.8 | 53.4 | 68.1 | 96.0 |
| 250-499 | 94.7 | 34.1 | 43.8 | 61.3 | 76.2 | 98.9 |
| 500-999 | 91.5 | 37.8 | 47.7 | 53.6 | 76.2 | 96.7 |
| 1,000-2,499 | 97.7 | 31.8 | 50.5 | 64.7 | 84.5 | 99.0 |
| 2,500-4,999 | 98.5 | 30.2 | 35.5 | 61.9 | 86.0 | 99.1 |
| 5,000 or more | 91.8 | 34.6 | 33.6 | 55.8 | 85.2 | 98.5 |
| Organizational form | ||||||
| Proprietorship | 82.3 | … | 52.3 | 35.1 | 46.9 | 88.3 |
| Partnership | 86.6 | 25.2 | 41.7 | 46.9 | 58.5 | 93.8 |
| S corporation | 95.7 | 31.3 | 43.5 | 61.6 | 71.2 | 97.4 |
| C corporation | 94.9 | 31.1 | 39.6 | 58.9 | 76.1 | 96.8 |
| Standard Industrial Classification | ||||||
| Construction and mining (10-19) | 92.3 | 28.3 | 44.7 | 52.1 | 80.5 | 95.0 |
| Manufacturing (20-39) | 95.5 | 39.8 | 47.1 | 54.8 | 76.0 | 97.0 |
| Transportation (40-49) | 84.9 | 28.3 | 41.4 | 51.8 | 60.7 | 96.9 |
| Wholesale trade (50-51) | 91.8 | 34.1 | 46.7 | 54.4 | 72.1 | 94.1 |
| Retail trade (52-59) | 88.8 | 38.2 | 47.9 | 45.0 | 67.4 | 91.4 |
| Insurance and real estate (60-69) | 81.3 | 17.7 | 47.4 | 43.0 | 45.9 | 89.8 |
| Business services (70-79) | 87.3 | 27.4 | 45.2 | 47.0 | 52.5 | 91.5 |
| Professional services (80-89) | 88.8 | 26.2 | 48.8 | 47.1 | 46.8 | 93.5 |
| Years under current ownership | ||||||
| 0-4 | 84.7 | 34.4 | 45.2 | 46.6 | 47.8 | 91.0 |
| 5-9 | 88.6 | 28.9 | 44.6 | 49.7 | 61.0 | 93.1 |
| 10-14 | 91.9 | 30.5 | 49.8 | 48.7 | 63.0 | 94.3 |
| 15-19 | 88.5 | 32.1 | 48.5 | 52.3 | 62.3 | 92.6 |
| 20-24 | 88.8 | 28.1 | 46.9 | 50.7 | 62.8 | 92.1 |
| 25 or more | 91.4 | 27.2 | 46.6 | 43.1 | 67.0 | 94.5 |
| Urbanization at main office | ||||||
| Urban | 88.6 | 31.9 | 46.4 | 49.6 | 58.4 | 93.0 |
| Rural | 89.7 | 23.0 | 47.8 | 42.6 | 66.6 | 92.8 |
| Number of offices | ||||||
| One | 88.1 | 30.2 | 46.9 | 46.4 | 58.0 | 92.1 |
| Two | 93.1 | 29.0 | 44.6 | 56.9 | 71.8 | 97.8 |
| Three or more | 93.6 | 32.9 | 45.9 | 62.9 | 74.9 | 99.4 |
| Sales area | ||||||
| Primarily within the U.S. | 88.8 | 29.7 | 46.3 | 48.2 | 60.4 | 92.9 |
| International or global | 88.6 | 40.7 | 53.6 | 46.0 | 53.3 | 92.9 |
Note. Data are weighted to adjust for differences in sampling and response rates and reflect population rather than sample measures.
1. By definition, owner proprietorships cannot have loans from owners, since in these cases, business and owner are one. Consequently, the statistics produced for this column have a different denominator than the other columns in this table. Return to table
2. Number of owners working in the business plus number of full- and part-time workers. Return to table
… Not applicable. Return to table
Source. 2003 Survey of Small Business Finances.
Table A.4. Percentage of small businesses using various suppliers of traditional types of credit, by type of credit, 2003
| Type of credit | Any supplier | Financial supplier | |||||||||
|---|---|---|---|---|---|---|---|---|---|---|---|
| Any | Depository institution | Nondepository institution | |||||||||
| Any | Commercial bank | Savings institution | Credit union | Any | Finance company | Brokerage | Leasing company | Other | |||
| Any | 60.4 | 57 | 46.4 | 41.1 | 5.5 | 3.9 | 26.6 | 22.2 | 0.8 | 4.3 | 2.3 |
| Credit line | 34.3 | 33.9 | 32.4 | 29.5 | 2.8 | .9 | 2.9 | 2.1 | .4 | .1 | .4 |
| Mortgage loan | 13.3 | 12.3 | 10.8 | 9.1 | 1.9 | .3 | 1.9 | .6 | .1 | .0 | 1.2 |
| Vehicle loan | 25.5 | 25.1 | 13.1 | 9.9 | 1.1 | 2.5 | 14.8 | 14.5 | .0 | .3 | .1 |
| Equipment loan | 10.3 | 9.0 | 5.1 | 4.3 | .5 | .4 | 4.4 | 3.4 | .2 | 1.0 | .1 |
| Capital lease | 8.7 | 7.7 | 1.1 | 1.0 | .1 | .0 | 6.8 | 4.6 | .0 | 2.8 | .0 |
| Other credit | 10.1 | 4.8 | 3.4 | 3.1 | .2 | .2 | 1.4 | .6 | .1 | .2 | .6 |
Note. Data are weighted to adjust for differences in sampling and response rates and reflect population rather than sample measures.
Source: 2003 Survey of Small Business Finances.
| Type of credit | Any | Family and individuals | Other businesses | Government |
|---|---|---|---|---|
| Any | 10.4 | 6.5 | 2.9 | 1.1 |
| Credit line | .8 | .1 | .6 | .1 |
| Mortgage loan | 1.5 | .9 | .2 | .4 |
| Vehicle loan | .4 | .2 | .2 | .0 |
| Equipment loan | 1.5 | .5 | .8 | .1 |
| Capital lease | 1.1 | .0 | 1.0 | .0 |
| Other credit | 5.9 | 4.9 | .5 | .5 |
Note. Data are weighted to adjust for differences in sampling and response rates and reflect population rather than sample measures.
Source: 2003 Survey of Small Business Finances.
Table A.5. Distribution of the total outstanding dollar amount of traditional types of credit used by small businesses, by type of credit and supplier, 2003
| Type of credit | Any supplier | Commercial bank | Nonbank | |||
|---|---|---|---|---|---|---|
| Any | Depository institution | Financial nondepository | Nonfinancial supplier | |||
| Any | 100.0 | 56.8 | 43.2 | 6.9 | 27.9 | 8.5 |
| Credit line | 31.7 | 25.2 | 6.5 | 1.1 | 4.9 | .5 |
| Mortgage loan | 39.0 | 20.3 | 18.7 | 4.8 | 11.4 | 2.6 |
| Vehicle loan | 5.1 | 2.0 | 3.0 | .4 | 2.6 | .1 |
| Equipment loan | 7.2 | 3.4 | 3.8 | .3 | 3.1 | .5 |
| Capital lease | 3.2 | .2 | 3.0 | .0 | 2.8 | .1 |
| Other credit | 13.7 | 5.6 | 8.1 | .2 | 3.1 | 4.8 |
Note. Outstanding dollar amount measured at date of interview. Interviews took place between June 2004 and February 2005. Data are weighted to adjust for differences in sampling and response rates and reflect population rather than sample measures. Details may not sum to totals because of rounding.
Source. 2003 Survey of Small Business Finances.
| Type of credit | Any supplier | Financial supplier | |||||
|---|---|---|---|---|---|---|---|
| Any | Depository institution | ||||||
| Any | Commercial bank | Nonbank depository | |||||
| Any | Savings institution | Credit union | |||||
| Any | 100.0 | 91.5 | 63.7 | 56.8 | 6.9 | 6.3 | .5 |
| Credit line | 31.7 | 31.3 | 26.4 | 25.2 | 1.1 | 1.1 | .0 |
| Mortgage loan | 39.0 | 36.5 | 25.1 | 20.3 | 4.8 | 4.6 | .1 |
| Vehicle loan | 5.1 | 5.0 | 2.4 | 2.0 | .4 | .1 | .3 |
| Equipment loan | 7.2 | 6.8 | 3.7 | 3.4 | .3 | .3 | .0 |
| Capital lease | 3.2 | 3.1 | .2 | .2 | .0 | .0 | .0 |
| Other credit | 13.7 | 8.9 | 5.8 | 5.6 | .2 | .1 | .1 |
Note. Outstanding dollar amount measured at date of interview. Interviews took place between June 2004 and February 2005. Data are weighted to adjust for differences in sampling and response rates and reflect population rather than sample measures. Details may not sum to totals because of rounding.
Source. 2003 Survey of Small Business Finances.
| Type of credit | Financial nondepository supplier | Nonfinancial supplier | |||||||
|---|---|---|---|---|---|---|---|---|---|
| Any | Finance company | Brokerage | Leasing company | Other | Any | Family and individuals | Other businesses | Government | |
| Any | 27.9 | 16.2 | 1.0 | 3.1 | 7.5 | 8.5 | 3.2 | 4.4 | 0.8 |
| Credit line | 4.9 | 4.4 | .3 | .1 | .1 | .5 | .0 | .4 | .0 |
| Mortgage loan | 11.4 | 4.4 | .5 | .0 | 6.5 | 2.6 | .7 | 1.3 | .5 |
| Vehicle loan | 2.6 | 2.5 | .0 | .0 | .0 | .1 | .0 | .1 | .0 |
| Equipment loan | 3.1 | 2.1 | .1 | .8 | .0 | .5 | .2 | .2 | .0 |
| Capital lease | 2.8 | .7 | .0 | 2.1 | .0 | .1 | .0 | .1 | .0 |
| Other credit | 3.1 | 2.0 | .2 | 0 | .9 | 4.8 | 2.2 | 2.2 | .3 |
Note. Outstanding dollar amount measured at date of interview. Interviews took place between June 2004 and February 2005. Data are weighted to adjust for differences in sampling and response rates and reflect population rather than sample measures. Details may not sum to totals because of rounding.
Source. 2003 Survey of Small Business Finances.
Table A.6. Percentage of small businesses using traditional types of credit from selected suppliers, by selected category of firm, 2003
| Category of firm | Any supplier | Financial institution | ||||
|---|---|---|---|---|---|---|
| Any | Depository institution | |||||
| Any | Commercial bank | Savings institution | Credit union | |||
| All firms | 60.4 | 57.2 | 46.4 | 41.1 | 5.5 | 3.9 |
| Number of employees1 | ||||||
| 0-1 | 42.1 | 38.2 | 25.8 | 20.5 | 2.4 | 4.2 |
| 2-4 | 53.9 | 50.6 | 38.1 | 33.5 | 5.0 | 3.5 |
| 5-9 | 72.7 | 69.1 | 59.0 | 53.2 | 6.6 | 4.2 |
| 10-19 | 77.4 | 75.3 | 68.7 | 62.1 | 8.4 | 3.8 |
| 20-49 | 82.7 | 80.0 | 73.6 | 66.5 | 9.9 | 3.8 |
| 50-99 | 87.4 | 86.7 | 80.0 | 77.8 | 4.8 | 3.4 |
| 100-499 | 93.8 | 93.4 | 89.7 | 85.6 | 8.2 | 3.6 |
| Fiscal year sales (thousands of dollars) | ||||||
| Less than 25 | 29.4 | 26.5 | 20.2 | 17.4 | 1.9 | 2.6 |
| 25-49 | 45.6 | 42.0 | 27.0 | 20.2 | 4.1 | 4.7 |
| 50-99 | 49.5 | 45.1 | 33.3 | 27.0 | 3.8 | 4.6 |
| 100-249 | 59.9 | 56.3 | 43.1 | 36.7 | 5.4 | 3.8 |
| 250-499 | 70.7 | 65.4 | 51.7 | 45.1 | 7.6 | 4.2 |
| 500-999 | 80.0 | 78.1 | 67.1 | 62.1 | 6.7 | 4.6 |
| 1,000-2,499 | 76.4 | 74.7 | 67.4 | 63.7 | 8.4 | 3.8 |
| 2,500-4,999 | 79.9 | 78.2 | 74.2 | 71.9 | 7.4 | 1.3 |
| 5,000-9,999 | 90.4 | 89.3 | 82.0 | 76.5 | 7.1 | 4.5 |
| 10,000 or more | 90.7 | 89.8 | 83.9 | 79.4 | 6.4 | 3.3 |
| Assets at year-end (thousands of dollars) | ||||||
| Less than 25 | 39.0 | 34.9 | 21.7 | 17.5 | 2.5 | 2.8 |
| 25-49 | 57.2 | 55.0 | 43.4 | 36.6 | 5.3 | 3.7 |
| 50-99 | 66.2 | 60.5 | 51.7 | 46.6 | 4.6 | 6.0 |
| 100-249 | 67.2 | 65.0 | 54.6 | 49.4 | 5.0 | 4.1 |
| 250-499 | 78.0 | 74.0 | 59.8 | 54.6 | 8.2 | 3.3 |
| 500-999 | 79.0 | 78.0 | 72.4 | 64.8 | 11.2 | 6.7 |
| 1,000-2,499 | 82.1 | 81.1 | 76.4 | 70.3 | 10.3 | 3.2 |
| 2,500-4,999 | 88.1 | 85.5 | 77.5 | 72.9 | 6.7 | 3.3 |
| 5,000 or more | 80.3 | 79.9 | 72.5 | 68.2 | 14.4 | .4 |
| Organizational form | ||||||
| Proprietorship | 52.4 | 48.2 | 36.2 | 30.3 | 4.3 | 4.6 |
| Partnership | 57.1 | 53.7 | 45.1 | 38.4 | 8.2 | 3.2 |
| S corporation | 70.0 | 67.3 | 56.4 | 51.4 | 6.5 | 3.2 |
| C corporation | 66.2 | 64.4 | 56.1 | 52.4 | 5.3 | 3.5 |
| Standard Industrial Classification | ||||||
| Construction and mining (10-19) | 70.7 | 68.8 | 56.5 | 49.5 | 7.0 | 5.7 |
| Manufacturing (20-39) | 70.0 | 66.7 | 59.8 | 54.7 | 5.4 | 4.2 |
| Transportation (40-49) | 79.1 | 75.4 | 54.8 | 49.8 | 6.7 | 8.6 |
| Wholesale trade (50-51) | 62.6 | 61.4 | 55.2 | 53.4 | 3.9 | 4.4 |
| Retail trade (52-59) | 58.9 | 54.6 | 47.9 | 43.2 | 5.8 | 2.5 |
| Insurance and real estate (60-69) | 59.2 | 55.6 | 45.1 | 38.5 | 10.2 | 3.4 |
| Business services (70-79) | 56.4 | 52.9 | 40.4 | 33.9 | 5.0 | 4.3 |
| Professional services (80-89) | 54.1 | 50.9 | 38.2 | 34.3 | 3.6 | 2.6 |
| Years under current ownership | ||||||
| 0-4 | 61.8 | 56.3 | 43.7 | 37.1 | 5.1 | 5.4 |
| 5-9 | 59.9 | 56.0 | 43.7 | 38.2 | 5.1 | 3.5 |
| 10-14 | 60.4 | 57.4 | 47.1 | 43.2 | 3.9 | 4.6 |
| 15-19 | 61.4 | 60.0 | 49.7 | 43.8 | 6.9 | 2.3 |
| 20-24 | 58.1 | 55.4 | 42.8 | 39.3 | 5.8 | 2.3 |
| 25 or more | 60.2 | 58.5 | 51.8 | 46.3 | 6.7 | 4.0 |
| Urbanization at main office | ||||||
| Urban | 60.2 | 56.8 | 45.2 | 40.1 | 5.3 | 3.7 |
| Rural | 61.5 | 58.4 | 50.7 | 44.6 | 6.1 | 4.7 |
| Number of offices | ||||||
| One | 58.1 | 54.8 | 44.1 | 38.8 | 5.3 | 3.7 |
| Two | 70.4 | 67.0 | 55.1 | 49.9 | 7.8 | 4.3 |
| Three or more | 82.7 | 80.4 | 70.8 | 65.9 | 4.0 | 6.7 |
| Sales area | ||||||
| Primarily within the U.S. | 60.8 | 57.5 | 46.9 | 41.5 | 5.5 | 3.9 |
| International or global | 51.8 | 49.5 | 35.9 | 31.8 | 4.6 | 3.1 |
Note. Data are weighted to adjust for differences in sampling and response rates and reflect population rather than sample measures.
1. Number of owners working in the business plus number of full- and part-time workers. Return to table
Source. 2003 Survey of Small Business Finances.
| Category of firm | Financial nondepository supplier | Nonfinancial supplier | |||||||
|---|---|---|---|---|---|---|---|---|---|
| Any | Finance company | Brokerage | Leasing Company | Other | Any | Family and individuals | Other businesses | Government | |
| All firms | 26.6 | 22.2 | 0.8 | 4.3 | 2.3 | 10.4 | 6.5 | 2.9 | 1.1 |
| Number of employees1 | |||||||||
| 0-1 | 17.6 | 14.3 | .4 | 2.1 | 1.8 | 7.4 | 4.0 | 2.4 | 1.1 |
| 2-4 | 21.5 | 18.4 | .4 | 2.6 | 2.1 | 8.1 | 5.3 | 2.4 | .3 |
| 5-9 | 33.4 | 26.5 | 1.6 | 6.0 | 3.1 | 14.4 | 9.0 | 3.6 | 1.4 |
| 10-19 | 37.7 | 31.4 | 1.0 | 7.5 | 3.2 | 14.7 | 10.2 | 3.9 | 2.1 |
| 20-49 | 39.1 | 34.3 | 1.8 | 6.9 | 2.2 | 13.4 | 7.7 | 3.1 | 2.9 |
| 50-99 | 48.8 | 43.2 | 1.3 | 13.3 | 1.0 | 13.0 | 4.6 | 5.5 | 2.8 |
| 100-499 | 49.7 | 40.8 | 2.8 | 14.1 | 1.4 | 18.5 | 10.9 | 4.9 | 4.6 |
| Fiscal year sales (thousands of dollars) | |||||||||
| Less than 25 | 8.5 | 7.3 | .3 | .2 | 1.3 | 6.0 | 5.2 | .9 | .0 |
| 25-49 | 17.5 | 14.2 | .8 | .9 | 2.1 | 9.7 | 6.4 | 2.8 | .4 |
| 50-99 | 18.2 | 15.3 | .3 | 2.6 | 1.8 | 8.4 | 5.1 | 2.8 | .4 |
| 100-249 | 24.3 | 20.3 | .1 | 3.7 | 2.1 | 10.5 | 6.6 | 1.9 | 1.7 |
| 250-499 | 29.9 | 23.5 | .7 | 5.5 | 4.4 | 14.5 | 8.4 | 4.3 | 1.8 |
| 500-999 | 40.8 | 34.1 | 1.6 | 7.1 | 2.4 | 12.9 | 8.4 | 4.0 | 1.7 |
| 1,000-2,499 | 36.2 | 29.0 | 1.4 | 8.4 | 2.9 | 9.9 | 4.8 | 4.6 | 0.3 |
| 2,500-4,999 | 46.4 | 43.8 | 2.4 | 5.0 | 1.2 | 11.6 | 6.9 | 1.8 | 2.9 |
| 5,000-9,999 | 57.6 | 52.3 | 1.6 | 8.1 | .7 | 10.8 | 6.1 | 3.5 | 1.0 |
| 10,000 or more | 49.4 | 40.1 | 4.7 | 14.5 | 2.0 | 13.4 | 7.2 | 5.6 | 3.0 |
| Assets at year-end (thousands of dollars) | |||||||||
| Less than 25 | 17.2 | 14.1 | .5 | 2.1 | 1.4 | 8.4 | 5.1 | 2.4 | .9 |
| 25-49 | 19.5 | 18.0 | .0 | 1.3 | 1.2 | 6.1 | 3.4 | 2.0 | .4 |
| 50-99 | 26.4 | 22.6 | .6 | 3.8 | 3.4 | 12.2 | 9.5 | 0.8 | 1.1 |
| 100-249 | 26.9 | 22.3 | 1.0 | 4.4 | 1.5 | 10.2 | 5.0 | 4.3 | 1.4 |
| 250-499 | 38.5 | 28.5 | .7 | 10.2 | 2.4 | 14.6 | 9.3 | 4.7 | .3 |
| 500-999 | 36.3 | 31.4 | 2.5 | 5.4 | 3.6 | 14.1 | 11.7 | 2.4 | .6 |
| 1,000-2,499 | 47.4 | 39.3 | 2.0 | 8.6 | 5.5 | 12.9 | 6.9 | 4.4 | 1.8 |
| 2,500-4,999 | 45.1 | 41.7 | 2.7 | 10.0 | 5.5 | 17.2 | 6.1 | 5.9 | 8.9 |
| 5,000 or more | 45.7 | 37.6 | 1.3 | 7.8 | 5.9 | 11.6 | 5.7 | 4.6 | 2.4 |
| Organizational form | |||||||||
| Proprietorship | 21.2 | 18.0 | .8 | 2.0 | 2.5 | 9.7 | 6.7 | 2.4 | .2 |
| Partnership | 23.8 | 18.4 | 1.1 | 4.4 | 3.0 | 9.4 | 3.7 | 4.8 | 1.5 |
| S corporation | 33.9 | 27.5 | .8 | 7.3 | 2.5 | 11.9 | 7.1 | 2.9 | 2.1 |
| C corporation | 29.0 | 25.6 | .9 | 4.7 | 1.2 | 10.3 | 6.1 | 3.3 | 1.3 |
| Standard industrial classification | |||||||||
| Construction and mining (10-19) | 37.3 | 32.5 | .0 | 4.8 | 3.6 | 8.6 | 3.4 | 2.8 | 2.3 |
| Manufacturing (20-39) | 27.4 | 21.8 | 1.3 | 6.1 | .5 | 16.9 | 10.6 | 3.8 | 2.4 |
| Transportation (40-49) | 42.3 | 36.4 | .1 | 6.6 | 1.2 | 15.4 | 13.1 | 1.6 | 1.7 |
| Wholesale trade (50-51) | 29.9 | 26.5 | 1.7 | 3.2 | 2.8 | 7.8 | 5.2 | 2.1 | .6 |
| Retail trade (52-59) | 21.1 | 16.8 | .7 | 4.2 | 2.4 | 11.5 | 7.6 | 2.5 | 1.6 |
| Insurance and real estate (60-69) | 24.2 | 16.7 | 1.1 | 2.4 | 6.2 | 5.9 | 3.5 | 2.3 | .2 |
| Business services (70-79) | 24.8 | 21.1 | 1.1 | 3.3 | 2.1 | 10.7 | 7.1 | 2.8 | .8 |
| Professional services (80-89) | 24.4 | 20.6 | .7 | 5.1 | 1.1 | 9.5 | 5.3 | 3.9 | .2 |
| Years under current ownership | |||||||||
| 0-4 | 24.2 | 19.4 | 1.0 | 4.3 | 1.3 | 15.3 | 9.4 | 3.9 | 2.1 |
| 5-9 | 27.6 | 22.5 | .8 | 4.6 | 2.8 | 11.4 | 7.9 | 2.8 | .9 |
| 10-14 | 28.0 | 23.7 | 1.0 | 4.9 | 1.8 | 9.3 | 4.3 | 3.5 | 1.0 |
| 15-19 | 29.4 | 25.3 | 1.0 | 3.4 | 2.8 | 8.2 | 5.1 | 2.9 | .4 |
| 20-24 | 27.4 | 22.4 | .7 | 4.8 | 3.6 | 7.4 | 4.7 | 2.2 | .6 |
| 25 or more | 24.5 | 21.4 | .5 | 3.6 | 2.4 | 8.2 | 5.4 | 1.8 | 1.2 |
| Urbanization at main office | |||||||||
| Urban | 27.2 | 22.5 | 1.0 | 4.5 | 2.3 | 10.8 | 6.5 | 3.1 | 1.2 |
| Rural | 24.3 | 20.8 | .2 | 3.3 | 2.3 | 9.1 | 6.3 | 2.0 | .7 |
| Number of offices | |||||||||
| One | 25.4 | 21.7 | .7 | 3.4 | 2.4 | 9.5 | 5.9 | 2.9 | .7 |
| Two | 33.5 | 24.3 | 2.0 | 9.2 | 1.7 | 17.6 | 11.5 | 2.4 | 4.2 |
| Three or more | 35.0 | 26.9 | 1.3 | 10.5 | 2.6 | 12.4 | 7.4 | 4.1 | 1.7 |
| Sales area | |||||||||
| Primarily within the U.S. | 26.7 | 22.2 | .7 | 4.2 | 2.4 | 10.4 | 6.4 | 3.0 | 1.1 |
| International or global | 25.6 | 22.1 | 2.3 | 4.8 | 1.2 | 11.3 | 8.8 | 1.8 | .9 |
Note. Data are weighted to adjust for differences in sampling and response rates and reflect population rather than sample measures.
1. Number of owners working in the business plus number of full- and part-time workers. Return to table
Source. 2003 Survey of Small Business Finances.
| Category of firm | Commercial bank | Nonbank | All traditional types | |||
|---|---|---|---|---|---|---|
| Any | Financial depository | Financial nondepository | Nonfinancial | |||
| All firms | 56.8 | 43.2 | 6.9 | 27.9 | 8.5 | 100.0 |
| Number of employees1 | ||||||
| 0-1 | 63.1 | 36.9 | 11.5 | 20.8 | 4.6 | 100.0 |
| 2-4 | 40.8 | 59.2 | 10.7 | 44.7 | 3.8 | 100.0 |
| 5-9 | 70.5 | 29.5 | 5.6 | 18.5 | 5.4 | 100.0 |
| 10-19 | 65.8 | 34.2 | 10.9 | 16.7 | 6.6 | 100.0 |
| 20-49 | 53.1 | 46.9 | 10.2 | 26.8 | 9.8 | 100.0 |
| 50-99 | 55.7 | 44.3 | 2.2 | 38.2 | 3.9 | 100.0 |
| 100-499 | 57.4 | 42.6 | 1.4 | 21.8 | 19.5 | 100.0 |
| Fiscal year sales (thousands of dollars) | ||||||
| Less than 25 | 46.5 | 53.5 | 29.9 | 15.6 | 8.0 | 100.0 |
| 25-49 | 57.9 | 42.1 | 19.3 | 17.0 | 5.8 | 100.0 |
| 50-99 | 22.5 | 77.5 | 6.7 | 67.8 | 2.9 | 100.0 |
| 100-249 | 39.0 | 61.0 | 35.8 | 14.2 | 11.1 | 100.0 |
| 250-499 | 61.7 | 38.3 | 16.1 | 15.5 | 6.7 | 100.0 |
| 500-999 | 57.8 | 42.2 | 6.1 | 27.3 | 8.8 | 100.0 |
| 1,000-2,499 | 60.6 | 39.4 | 7.3 | 27.5 | 4.6 | 100.0 |
| 2,500-4,999 | 59.2 | 40.8 | 5.1 | 31.6 | 4.0 | 100.0 |
| 5,000-9,999 | 59.1 | 40.9 | 3.1 | 32.9 | 4.9 | 100.0 |
| 10,000 or more | 57.5 | 42.5 | 1.0 | 27.6 | 13.8 | 100.0 |
| Assets at year-end (thousands of dollars) | ||||||
| Less than 25 | 36.3 | 63.7 | 20.6 | 32.0 | 11.1 | 100.0 |
| 25-49 | 55.8 | 44.2 | 15.8 | 22.7 | 5.6 | 100.0 |
| 50-99 | 59.9 | 40.1 | 7.8 | 17.2 | 15.2 | 100.0 |
| 100-249 | 48.8 | 51.2 | 4.5 | 40.5 | 6.3 | 100.0 |
| 250-499 | 49.3 | 50.7 | 14.9 | 24.9 | 10.9 | 100.0 |
| 500-999 | 60.2 | 39.8 | 7.4 | 21.8 | 10.6 | 100.0 |
| 1,000-2,499 | 50.6 | 49.4 | 10.8 | 33.9 | 4.7 | 100.0 |
| 2,500-4,999 | 70.9 | 29.1 | 4.4 | 18.8 | 5.9 | 100.0 |
| 5,000 or more | 58.5 | 41.5 | 4.3 | 27.9 | 9.4 | 100.0 |
| Organizational form | ||||||
| Proprietorship | 45.9 | 54.1 | 10.7 | 36.0 | 7.4 | 100.0 |
| Partnership | 43.9 | 56.1 | 16.6 | 36.1 | 3.4 | 100.0 |
| S corporation | 62.4 | 37.6 | 4.9 | 24.3 | 8.4 | 100.0 |
| C corporation | 60.6 | 39.4 | 2.8 | 25.0 | 11.6 | 100.0 |
| Standard Industrial Classification | ||||||
| Construction and mining (10-19) | 56.7 | 43.3 | 7.8 | 31.1 | 4.5 | 100.0 |
| Manufacturing (20-39) | 70.9 | 29.1 | 3.6 | 13.8 | 11.8 | 100.0 |
| Transportation (40-49) | 29.9 | 70.1 | 2.4 | 52.0 | 15.7 | 100.0 |
| Wholesale trade (50-51) | 69.3 | 30.7 | 1.3 | 17.3 | 12.1 | 100.0 |
| Retail trade (52-59) | 54.1 | 45.9 | 5.8 | 34.5 | 5.6 | 100.0 |
| Insurance and real estate (60-69) | 55.7 | 44.3 | 8.7 | 32.7 | 2.9 | 100.0 |
| Business services (70-79) | 58.1 | 41.9 | 12.7 | 22.4 | 6.8 | 100.0 |
| Professional services (80-89) | 61.2 | 38.8 | 5.3 | 12.4 | 21.1 | 100.0 |
| Years under current ownership | ||||||
| 0-4 | 60.9 | 39.1 | 11.6 | 15.2 | 12.3 | 100.0 |
| 5-9 | 50.1 | 49.9 | 6.5 | 32.3 | 11.0 | 100.0 |
| 10-14 | 59.2 | 40.8 | 11.1 | 24.9 | 4.8 | 100.0 |
| 15-19 | 60.3 | 39.7 | 9.2 | 25.7 | 4.8 | 100.0 |
| 20-24 | 61.8 | 38.2 | 3.2 | 30.7 | 4.3 | 100.0 |
| 25 or more | 56.2 | 43.8 | 3.2 | 31.4 | 9.2 | 100.0 |
| Urbanization at main office | ||||||
| Urban | 56.7 | 43.3 | 6.8 | 28.6 | 7.9 | 100.0 |
| Rural | 57.3 | 42.7 | 7.2 | 24.4 | 11.0 | 100.0 |
| Number of offices | ||||||
| One | 54.2 | 45.8 | 9.5 | 29.1 | 7.1 | 100.0 |
| Two | 71.8 | 28.2 | 9.8 | 10.9 | 7.5 | 100.0 |
| Three or more | 52.6 | 47.4 | 2.3 | 34.5 | 10.6 | 100.0 |
| Sales area | ||||||
| Primarily within the U.S. | 56.1 | 43.9 | 7.1 | 28.3 | 8.4 | 100.0 |
| International or global | 70.9 | 29.1 | 1.5 | 18.1 | 9.4 | 100.0 |
Note. Data are weighted to adjust for differences in sampling and response rates and reflect population rather than sample measures. Details may not sum to totals because of rounding.
1. Number of owners working in the business plus number of full- and part-time workers. Return to table
Source. 2003 Survey of Small Business Finances.
| Category of firm | Credit line | Mortgage loan | Vehicle loan | Equipment loan | Capital lease | Other traditional type | Any traditional type |
|---|---|---|---|---|---|---|---|
| All firms | 31.7 | 39.0 | 5.1 | 7.2 | 3.2 | 13.7 | 100.0 |
| Number of employees1 | |||||||
| 0-1 | 24.5 | 51.2 | 10.5 | 2.6 | 1.1 | 10.0 | 100.0 |
| 2-4 | 16.1 | 65.5 | 5.6 | 4.8 | 1.0 | 7.0 | 100.0 |
| 5-9 | 47.3 | 32.0 | 7.0 | 5.2 | 1.0 | 7.6 | 100.0 |
| 10-19 | 19.3 | 46.0 | 5.0 | 5.5 | 1.3 | 22.8 | 100.0 |
| 20-49 | 29.9 | 42.6 | 5.9 | 7.9 | 2.5 | 11.1 | 100.0 |
| 50-99 | 42.7 | 23.0 | 2.8 | 6.3 | 14.1 | 11.2 | 100.0 |
| 100-499 | 38.5 | 21.6 | 3.4 | 13.3 | 1.3 | 22.0 | 100.0 |
| Fiscal year sales (thousands of dollars) | |||||||
| Less than 25 | 10.4 | 46.6 | 7.1 | 1.8 | .8 | 33.2 | 100.0 |
| 25-49 | 8.3 | 47.5 | 11.6 | 1.0 | 1.8 | 29.7 | 100.0 |
| 50-99 | 7.1 | 78.3 | 8.9 | 2.9 | 1.0 | 1.8 | 100.0 |
| 100-249 | 16.2 | 56.2 | 10.2 | 5.2 | 2.5 | 9.6 | 100.0 |
| 250-499 | 14.6 | 55.1 | 6.8 | 3.8 | 1.1 | 18.6 | 100.0 |
| 500-999 | 15.4 | 49.2 | 10.1 | 11.4 | 1.5 | 12.4 | 100.0 |
| 1,000-2,499 | 38.4 | 40.5 | 5.1 | 6.5 | 1.2 | 8.4 | 100.0 |
| 2,500-4,999 | 29.2 | 47.9 | 4.4 | 8.1 | 2.9 | 7.6 | 100.0 |
| 5,000-9,999 | 17.9 | 42.1 | 4.1 | 6.7 | 16.2 | 13.0 | 100.0 |
| 10,000 or more | 49.7 | 21.0 | 2.2 | 8.4 | 1.0 | 17.7 | 100.0 |
| Assets at year-end (thousands of dollars) | |||||||
| Less than 25 | 25.3 | 33.7 | 22.1 | 6.1 | 4.1 | 8.8 | 100.0 |
| 25-49 | 24.5 | 31.9 | 26.2 | 3.8 | 4.3 | 9.3 | 100.0 |
| 50-99 | 24.0 | 35.3 | 16.8 | 4.5 | 3.3 | 16.1 | 100.0 |
| 100-249 | 18.0 | 53.8 | 12.1 | 5.6 | 1.9 | 8.5 | 100.0 |
| 250-499 | 23.2 | 30.6 | 8.6 | 22.8 | 1.9 | 12.8 | 100.0 |
| 500-999 | 21.6 | 31.1 | 8.7 | 9.0 | 1.5 | 28.0 | 100.0 |
| 1,000-2,499 | 17.8 | 47.5 | 4.2 | 6.9 | 13.3 | 10.3 | 100.0 |
| 2,500-4,999 | 27.9 | 38.7 | 5.6 | 9.0 | 2.0 | 16.8 | 100.0 |
| 5,000 or more | 42.3 | 37.5 | 1.3 | 5.2 | .7 | 13.0 | 100.0 |
| Organizational form | |||||||
| Proprietorship | 14.7 | 36.5 | 10.0 | 4.6 | 16.8 | 17.3 | 100.0 |
| Partnership | 15.6 | 68.3 | 2.2 | 2.9 | .6 | 10.5 | 100.0 |
| S corporation | 41.4 | 28.2 | 5.8 | 8.2 | 1.8 | 14.6 | 100.0 |
| C corporation | 34.3 | 37.8 | 3.9 | 9.2 | 1.6 | 13.1 | 100.0 |
| Standard Industrial Classification | |||||||
| Construction and mining (10-19) | 27.3 | 22.5 | 14.4 | 12.6 | 1.3 | 22.0 | 100.0 |
| Manufacturing (20-39) | 44.2 | 20.0 | 3.5 | 15.2 | 2.6 | 14.6 | 100.0 |
| Transportation (40-49) | 11.2 | 31.5 | 11.5 | 18.4 | 21.2 | 6.3 | 100.0 |
| Wholesale trade (50-51) | 55.3 | 18.1 | 3.8 | 11.3 | 1.1 | 10.3 | 100.0 |
| Retail trade (52-59) | 41.4 | 32.5 | 2.8 | 2.8 | 1.1 | 19.4 | 100.0 |
| Insurance and real estate (60-69) | 21.8 | 70.1 | .9 | .3 | .2 | 6.7 | 100.0 |
| Business services (70-79) | 31.0 | 46.1 | 5.6 | 3.7 | 1.8 | 11.8 | 100.0 |
| Professional services (80-89) | 21.0 | 35.2 | 6.4 | 9.7 | 3.2 | 24.5 | 100.0 |
| Years under current ownership | |||||||
| 0-4 | 31.2 | 40.3 | 4.8 | 8.1 | 1.8 | 13.8 | 100.0 |
| 5-9 | 32.8 | 33.7 | 4.5 | 7.4 | 1.5 | 20.0 | 100.0 |
| 10-14 | 37.8 | 29.0 | 7.1 | 6.4 | 1.6 | 18.0 | 100.0 |
| 15-19 | 35.9 | 30.8 | 7.2 | 9.9 | 1.8 | 14.4 | 100.0 |
| 20-24 | 18.9 | 66.5 | 3.7 | 5.8 | .8 | 4.3 | 100.0 |
| 25 or more | 32.7 | 38.3 | 4.6 | 6.6 | 8.5 | 9.3 | 100.0 |
| Urbanization at main office | |||||||
| Urban | 32.9 | 37.8 | 4.4 | 6.7 | 3.7 | 14.5 | 100.0 |
| Rural | 26.0 | 45.1 | 8.1 | 9.8 | 1.0 | 10.0 | 100.0 |
| Number of offices | |||||||
| One | 29.0 | 41.7 | 7.7 | 7.1 | 1.6 | 12.9 | 100.0 |
| Two | 51.6 | 22.5 | 3.7 | 7.7 | 1.7 | 12.8 | 100.0 |
| Three or more | 25.3 | 43.8 | 2.7 | 7.2 | 5.9 | 15.1 | 100.0 |
| Sales area | |||||||
| Primarily within the U.S. | 31.0 | 39.7 | 5.2 | 7.2 | 3.2 | 13.7 | 100.0 |
| International or global | 47.8 | 24.9 | 3.4 | 7.3 | 2.5 | 13.9 | 100.0 |
Note. Data are weighted to adjust for differences in sampling and response rates and reflect population rather than sample measures. Details may not sum to totals because of rounding.
1. Number of owners working in the business plus number of full- and part-time workers. Return to table
Source. 2003 Survey of Small Business Finances.
| Category of firm | Applied for credit | Applied once | Applied multiple times | Did not apply for fear of denial3 | |||
|---|---|---|---|---|---|---|---|
| Share of all firms | Application approved1 | Share of all firms | All applications approved2 | Some applications approved2 | |||
| All firms | 21.4 | 12.3 | 87.1 | 9.1 | 65.0 | 17.1 | 17.9 |
| Number of employees4 | |||||||
| 0-1 | 13.5 | 8.8 | 89.4 | 4.7 | 67.0 | 17.8 | 17.8 |
| 2-4 | 18.1 | 11.3 | 81.5 | 6.7 | 62.7 | 18.3 | 18.7 |
| 5-9 | 26.2 | 14.5 | 91.2 | 11.6 | 54.4 | 15.9 | 20.0 |
| 10-19 | 29.8 | 14.4 | 88.3 | 15.4 | 66.2 | 23.2 | 17.3 |
| 20-49 | 31.0 | 16.1 | 89.4 | 14.9 | 77.5 | 12.7 | 10.6 |
| 50-99 | 39.2 | 20.0 | 98.5 | 19.1 | 94.8 | 1.9 | 11.3 |
| 100-499 | 41.7 | 15.5 | 91.3 | 26.1 | 90.6 | 7.8 | 9.5 |
| Fiscal year sales (thousands of dollars) | |||||||
| Less than 25 | 8.7 | 6.5 | 82.7 | 2.2 | … | … | 18.9 |
| 25-49 | 13.0 | 8.4 | 78.8 | 4.6 | … | … | 22.3 |
| 50-99 | 18.5 | 13.3 | 79.5 | 5.2 | 29.0 | 53.3 | 18.6 |
| 100-249 | 23.0 | 12.7 | 90.7 | 10.3 | 53.8 | 20.0 | 21.2 |
| 250-499 | 21.9 | 13.6 | 86.5 | 8.3 | 65.9 | 17.8 | 18.6 |
| 500-999 | 31.1 | 16.1 | 91.1 | 15.0 | 71.3 | 16.9 | 17.9 |
| 1,000-2,499 | 29.8 | 15.6 | 87.6 | 14.3 | 74.6 | 11.3 | 11.1 |
| 2,500-4,999 | 26.3 | 12.4 | 90.0 | 13.9 | 85.9 | .8 | 9.1 |
| 5,000-9,999 | 33.7 | 13.4 | 93.0 | 20.4 | 90.2 | 3.5 | 8.6 |
| 10,000 or more | 27.7 | 12.1 | 100.0 | 15.5 | 95.5 | 2.9 | 5.6 |
| Assets at year-end (thousands of dollars) | |||||||
| Less than 25 | 10.5 | 7.8 | 86.2 | 2.7 | 39.4 | 11.6 | 21.8 |
| 25-49 | 16.5 | 10.4 | 87.1 | 6.1 | 52.3 | 20.3 | 17.0 |
| 50-99 | 21.4 | 11.4 | 86.7 | 10.0 | 57.3 | 29.2 | 18.6 |
| 100-249 | 31.1 | 18.8 | 83.1 | 12.3 | 66.7 | 16.1 | 14.1 |
| 250-499 | 29.1 | 17.1 | 89.0 | 12.0 | 63.2 | 18.9 | 18.9 |
| 500-999 | 30.0 | 11.6 | 88.2 | 18.4 | 69.8 | 20.9 | 13.9 |
| 1,000-2,499 | 30.6 | 12.8 | 90.1 | 17.8 | 89.2 | 2.5 | 14.5 |
| 2,500-4,999 | 44.4 | 24.4 | 100.0 | 20.0 | 82.6 | 1.5 | 17.5 |
| 5,000 or more | 26.2 | 12.1 | 94.4 | 14.2 | 75.8 | 23.3 | 7.5 |
| Organizational form | |||||||
| Proprietorship | 17.3 | 9.8 | 90.7 | 7.5 | 62.7 | 22.3 | 18.7 |
| Partnership | 21.6 | 15.3 | 87.7 | 6.3 | 72.8 | 16.6 | 15.4 |
| S corporation | 24.6 | 14.0 | 86.1 | 10.6 | 59.0 | 15.6 | 18.5 |
| C corporation | 26.4 | 14.1 | 81.5 | 12.3 | 77.0 | 10.8 | 15.8 |
| Standard Industrial Classification | |||||||
| Construction and mining (10-19) | 30.1 | 13.3 | 89.4 | 16.7 | 81.9 | 3.6 | 20.7 |
| Manufacturing (20-39) | 27.7 | 17.4 | 77.1 | 10.3 | 74.5 | 15.3 | 18.8 |
| Transportation (40-49) | 28.4 | 14.0 | 75.7 | 14.4 | 62.1 | 21.5 | 13.1 |
| Wholesale trade (50-51) | 14.8 | 9.0 | 93.9 | 5.8 | 57.2 | 18.9 | 16.0 |
| Retail trade (52-59) | 21.3 | 11.3 | 88.4 | 10.0 | 46.9 | 35.4 | 18.8 |
| Insurance and real estate (60-69) | 17.5 | 11.7 | 90.7 | 5.9 | 77.1 | 15.2 | 8.7 |
| Business services (70-79) | 19.2 | 12.8 | 89.2 | 6.4 | 58.7 | 15.2 | 21.8 |
| Professional services (80-89) | 18.8 | 10.8 | 86.3 | 8.0 | 66.5 | 14.0 | 15.1 |
| Years under current ownership | |||||||
| 0-4 | 22.6 | 14.6 | 84.5 | 8.0 | 48.0 | 20.0 | 26.5 |
| 5-9 | 21.6 | 11.1 | 87.3 | 10.5 | 57.0 | 18.4 | 22.1 |
| 10-14 | 22.2 | 12.9 | 85.7 | 9.3 | 66.5 | 22.6 | 18.9 |
| 15-19 | 21.8 | 13.2 | 91.2 | 8.6 | 73.3 | 13.5 | 16.0 |
| 20-24 | 19.5 | 10.9 | 89.9 | 8.6 | 76.3 | 12.2 | 11.3 |
| 25 or more | 19.8 | 10.6 | 86.8 | 9.2 | 80.1 | 12.5 | 7.3 |
| Urbanization at main office | |||||||
| Urban | 20.1 | 11.6 | 85.2 | 8.5 | 59.9 | 17.5 | 19.0 |
| Rural | 26.2 | 14.9 | 92.7 | 11.3 | 79.9 | 15.9 | 13.7 |
| Number of offices | |||||||
| One | 19.9 | 11.3 | 87.2 | 8.6 | 64.6 | 16.3 | 17.9 |
| Two | 28.3 | 17.1 | 83.9 | 11.1 | 54.4 | 29.1 | 21.9 |
| Three or more | 34.7 | 19.5 | 91.4 | 15.2 | 84.9 | 7.7 | 10.2 |
| Sales area | |||||||
| Primarily within the U.S. | 21.5 | 12.4 | 87.4 | 9.2 | 66.3 | 17.4 | 17.6 |
| International or global | 18.1 | 10.2 | 79.1 | 7.9 | 34.0 | 8.5 | 23.8 |
Note. Survey respondents were asked about their credit application experience from 1996 to 1998. Data are weighted to adjust for differences in sampling and response rates and reflect population rather than sample measures.
1. Percent based on small businesses that applied once for credit. Return to table
2. Percent based on small businesses that applied multiple times for credit. Return to table
3. Survey respondents were asked if they had forgone applying for credit at any point in the previous four years (2000-03) for fear of denial. Return to table
4. Number of owners working in the business plus number of full- and part-time workers. Return to table
… Not applicable. Return to table
Source. 2003 Survey of Small Business Finances.
| Category of firm | Used trade credit | Loan from owner2 | |||
|---|---|---|---|---|---|
| Share of all firms | Offered discount | Share of trade credit users that paid after due date | |||
| Share of trade credit users | Took cash discount1 | ||||
| All firms | 60.1 | 53.0 | 80.2 | 41.0 | 30.3 |
| Number of employees3 | |||||
| 0-1 | 35.7 | 37.1 | 85.4 | 33.0 | 25.7 |
| 2-4 | 55.9 | 48.1 | 81.4 | 39.6 | 27.0 |
| 5-9 | 71.6 | 48.4 | 79.6 | 42.3 | 33.3 |
| 10-19 | 80.4 | 70.5 | 75.8 | 44.7 | 31.3 |
| 20-49 | 85.0 | 67.3 | 80.2 | 45.6 | 36.0 |
| 50-99 | 88.5 | 82.4 | 83.3 | 47.1 | 32.9 |
| 100-499 | 85.4 | 83.4 | 81.2 | 45.8 | 28.4 |
| Fiscal year sales (thousands of dollars) | |||||
| Less than 25 | 27.7 | 32.1 | 86.8 | 29.8 | 22.3 |
| 25-49 | 40.2 | 43.1 | 88.4 | 42.8 | 33.5 |
| 50-99 | 46.3 | 35.1 | 89.5 | 35.6 | 34.9 |
| 100-249 | 61.0 | 46.0 | 75.7 | 44.2 | 28.0 |
| 250-499 | 70.0 | 46.4 | 81.2 | 41.3 | 27.7 |
| 500-999 | 82.2 | 59.1 | 75.4 | 41.1 | 27.7 |
| 1,000-2,499 | 79.3 | 68.9 | 80.4 | 45.4 | 36.3 |
| 2,500-4,999 | 87.6 | 77.1 | 80.3 | 36.1 | 38.7 |
| 5,000-9,999 | 83.6 | 79.8 | 80.8 | 38.9 | 26.9 |
| 10,000 or more | 89.8 | 87.0 | 85.0 | 45.1 | 30.0 |
| Assets at year-end (thousands of dollars) | |||||
| Less than 25 | 38.4 | 36.6 | 78.3 | 38.7 | 23.8 |
| 25-49 | 57.6 | 46.4 | 91.0 | 37.8 | 28.1 |
| 50-99 | 64.8 | 43.3 | 85.4 | 40.4 | 28.1 |
| 100-249 | 68.1 | 59.9 | 79.0 | 38.8 | 31.5 |
| 250-499 | 76.2 | 57.1 | 70.8 | 45.9 | 34.1 |
| 500-999 | 76.2 | 68.4 | 75.9 | 46.2 | 37.8 |
| 1,000-2,499 | 84.5 | 68.6 | 82.7 | 41.7 | 31.8 |
| 2,500-4,999 | 86.0 | 77.9 | 84.9 | 47.9 | 30.2 |
| 5,000 or more | 85.2 | 66.0 | 83.5 | 39.6 | 34.6 |
| Organizational form | |||||
| Proprietorship | 46.9 | 43.2 | 89.1 | 40.2 | … |
| Partnership | 58.5 | 48.4 | 76.7 | 43.0 | 25.2 |
| S corporation | 71.2 | 57.6 | 76.1 | 39.7 | 31.3 |
| C corporation | 76.1 | 63.4 | 77.7 | 43.7 | 31.1 |
| Standard Industrial Classification | |||||
| Construction and mining (10-19) | 80.5 | 74.5 | 81.8 | 40.6 | 28.3 |
| Manufacturing (20-39) | 76.0 | 73.5 | 70.2 | 47.8 | 39.8 |
| Transportation (40-49) | 60.7 | 44.0 | 82.3 | 48.0 | 28.3 |
| Wholesale trade (50-51) | 72.1 | 68.4 | 70.5 | 47.4 | 34.1 |
| Retail trade (52-59) | 67.4 | 57.0 | 85.9 | 41.6 | 38.2 |
| Insurance and real estate (60-69) | 45.9 | 33.6 | 75.5 | 22.8 | 17.7 |
| Business services (70-79) | 52.5 | 43.9 | 79.1 | 41.5 | 27.4 |
| Professional services (80-89) | 46.8 | 29.7 | 89.2 | 37.4 | 26.2 |
| Years under current ownership | |||||
| 0-4 | 47.8 | 48.3 | 74.5 | 44.5 | 34.4 |
| 5-9 | 61.0 | 49.3 | 76.7 | 44.4 | 28.9 |
| 10-14 | 63.0 | 49.6 | 80.1 | 39.7 | 30.5 |
| 15-19 | 62.3 | 55.9 | 78.5 | 43.8 | 32.1 |
| 20-24 | 62.8 | 58.0 | 79.5 | 41.5 | 28.1 |
| 25 or more | 67.0 | 59.0 | 88.9 | 33.1 | 27.2 |
| Urbanization at main office | |||||
| Urban | 58.4 | 51.3 | 77.4 | 41.1 | 31.9 |
| Rural | 66.6 | 58.5 | 88.5 | 40.6 | 23.0 |
| Number of offices | |||||
| One | 58.0 | 52.0 | 81.3 | 40.5 | 30.2 |
| Two | 71.8 | 58.0 | 74.5 | 43.3 | 29.0 |
| Three or more | 74.9 | 57.8 | 78.0 | 43.6 | 32.9 |
| Sales area | |||||
| Primarily within the U.S. | 60.4 | 52.7 | 81.2 | 40.5 | 29.7 |
| International or global | 53.3 | 58.8 | 60.0 | 51.2 | 40.7 |
Note. Data are weighted to adjust for differences in sampling and response rates and reflect population rather than sample measures.
1. Percent based on small businesses that were offered a cash discount on trade credit. Return to table
2. By definition, owner proprietorships cannot have loans from owners, since in these cases, business and owner are one. Consequently, the statistics produced for this column have a different denominator than the other columns in this table. Return to table
3. Number of owners working in the business plus number of full- and part-time workers. Return to table
… Not applicable. Return to table
Source. 2003 Survey of Small Business Finances.
| Source | 1993 | 1998 | 2003 | |||||||
|---|---|---|---|---|---|---|---|---|---|---|
| Median distance | Mean distance | Percent less than 30 miles | Median distance | Mean distance | Percent less than 30 miles | Median distance | Mean distance | Percent less than 30 miles | MEMO Percent of suppliers1 | |
| Any source | 9 | 115 | 71.0 | 10 | 237 | 66.0 | 11 | 178 | 66.0 | 100.0 |
| Depository institution | 4 | 42 | 88.0 | 3 | 84 | 87.0 | 4 | 76 | 83.0 | 55.8 |
| Commercial bank | 3 | 41 | 88.0 | 3 | 84 | 87.0 | 4 | 77 | 83.0 | 46.9 |
| Thrift | 5 | 57 | 86.0 | 4 | 106 | 86.0 | 5 | 80 | 80.0 | 5.3 |
| Credit union | 5 | 49 | 86.0 | 5 | 67 | 85.0 | 10 | 56 | 78.0 | 3.6 |
| Nondepository financial2 | 47 | 250 | 41.0 | 252 | 553 | 25.0 | 52 | 357 | 36.0 | 33.4 |
| Nonfinancial other3 | 24 | 175 | 54.0 | 12 | 200 | 64.0 | 10 | 155 | 73.0 | 10.8 |
1. Percentage of loan suppliers in 2003. Return to table
2. Finance, mortgage, insurance, brokerage, and leasing companies. Return to table
3. Family and individuals, government, venture capital, and other business firms. Return to table
References
Acs, Zoltan J. (1999). "The Development and Expansion of Secondary Markets for Small Business Loans," Business Access to Capital and Credit, proceedings of a Federal Reserve System Research Conference, March 8-9, pp. 625-43.
Akhavein, Jalal, W. Scott Frame, and Lawrence J. White (2001). "The Diffusion of Financial Innovations: An Examination of the Adoption of Small Business Credit Scoring by Large Banking Organizations," Working Paper Series 2001-9. Atlanta: Federal Reserve Bank of Atlanta, April.
Avery, Robert B., Raphael Bostic, Paul S. Calem, and Glenn B. Canner (1996). "Credit Risk, Credit Scoring, and the Performance of Home Mortgages (252 KB PDF)," Federal Reserve Bulletin, vol. 82 (July), pp. 621-48.
------------ (2000). "Credit Scoring: Statistical Issues and Evidence from Credit-Bureau Files," Real Estate Economics, vol. 3, pp. 523-47.
Avery, Robert B., and Katherine Samolyk (2000). "Bank Consolidation and the Provision of Banking Services: The Case of Small Commercial Loans," Working Paper Series 2000-01. Washington: Federal Deposit Insurance Corporation, December.
------------ (2004). "Bank Consolidation and Small Business Lending: The Role of Community Banks," Journal of Financial Services Research, vol. 25 (April-June), pp. 291-325.
Berger, Allen N., Seth D. Bonime, Lawrence G. Goldberg, and Lawrence J. White (2004). "The Dynamics of Market Entry: The Effects of Mergers and Acquisitions on Entry in the Banking Industry," Journal of Business, vol. 77 (October), pp. 797-834.
Berger, Allen N., Rebecca S. Demsetz, and Philip E. Strahan (1999). "The Consolidation of the Financial Services Industry: Causes, Consequences, and Implications for the Future," Journal of Banking and Finance, vol. 23 (February), pp. 135-94.
Berger, Allen N., Marco A. Espinosa-Vega, W. Scott Frame, and Nathan H. Miller (2005). "Debt Maturity, Risk, and Asymmetric Information," Journal of Finance, vol. 60 (December), pp. 2895-2923.
Berger, Allen N., and W. Scott Frame (2005). "Small Business Credit Scoring and Credit Availability," Working Paper Series 2005-10. Atlanta: Federal Reserve Bank of Atlanta, May.
Berger, Allen N., W. Scott Frame, and Nathan H. Miller (2005). "Credit Scoring and the Availability, Price, and Risk of Small Business Credit," Journal of Money, Credit, and Banking, vol. 37 (April), pp. 191-222.
Berger, Allen N., Lawrence G. Goldberg, and Lawrence J. White (2001). "The Effects of Dynamic Changes in Bank Competition on the Supply of Small Business Credit," European Finance Review, vol. 5 (1-2), pp. 115-39.
Berger, Allen N., Richard J. Rosen, and Gregory F. Udell (2001). "The Effect of Market Size Structure on Competition: The Case of Small Business Lending (144 KB PDF)," Finance and Economics Discussion Series 2001-63. Washington: Board of Governors of the Federal Reserve System, December.
Berger, Allen N., Anthony Saunders, Joseph M. Scalise, and Gregory F. Udell (1998). "The Effects of Bank Mergers and Acquisitions on Small Business Lending," Journal of Financial Economics, vol. 50 (November), pp. 187-229.
Berger, Allen N., and Gregory F. Udell (1995). "Relationship Lending and Lines of Credit in Small Firm Finance," Journal of Business, vol. 68 (July), pp. 351-82.
------------ (1998). "The Economics of Small Business Finance: The Roles of Private Equity and Debt Markets in the Financial Growth Cycle," Journal of Banking and Finance, vol. 22 (August), pp. 613-73.
------------ (2002). "Small Business Credit Availability and Relationship Lending: The Importance of Bank Organisational Structure," Economic Journal, vol. 112 (February), pp. F32-53.
Bishop, Marcus (2002). "The Next Chapter in Small Business Scoring," The RMA Journal, vol. 84 (February), pp. 48-52.
Bitler, Marianne, Alicia M. Robb, and John D. Wolken (2001). "Financial Services Used by Small Businesses: Evidence from the 1998 Survey of Small Business Finances (136 KB PDF)," Federal Reserve Bulletin, vol. 87 (April), pp. 183-205.
Board of Governors of the Federal Reserve System (2000). Report to the Congress on the Performance and Profitability of CRA-Related Lending. Washington: Board of Governors, July.
------------ (2002). Report to the Congress on the Availability of Credit to Small Businesses (1 MB PDF). Washington: Board of Governors, September.
------------ (2007). Report to the Congress on Credit Scoring and Its Effects on the Availability and Affordability of Credit. Washington: Board of Governors, August.
Board of Governors of the Federal Reserve System and U.S. Securities and Exchange Commission (2000). Report to the Congress on Markets for Small-Business- and Commercial-Mortgage-Related Securities (108 KB PDF). Washington: Board of Governors and SEC, September.
Boot, Arnoud W.A. (2000). "Relationship Banking: What Do We Know?" Journal of Financial Intermediation, vol. 9 (January), pp. 7-25.
Brevoort, Kenneth P., and Tim Hannan, (2006). "Commercial Lending and Distance: Evidence from Community Reinvestment Act Data," Journal of Money, Credit, and Banking, vol. 38 (December), pp. 1991-2012.
Consumer Bankers Association (2004). 2004 Survey of Bank-Sponsored Financial Literacy Programs. Arlington, Va.: CBA, April.
Cowan, Charles D., and Adrian M. Cowan (2006). "A Survey Based Assessment of Financial Institution Use of Credit Scoring for Small Business Lending," unpublished paper, U.S. Small Business Administration, Office of Advocacy, April.
Craig, Steven G., and Pauline Hardee (2007). "The Impact of Bank Consolidation on Small Business Credit Availability," Journal of Banking and Finance, vol. 31 (April), pp. 1237-63.
Critchfield, Tim, Tyler Davis, Lee Davison, Heather Gratton, George Hane, and Katherine Samolyk (2004). "The Future of Banking in America: Community Banks: Their Recent Past, Current Performance, and Future Prospects," FDIC Banking Review, vol. 16 (3), pp. 1-56.
DeYoung, Robert, Lawrence G. Goldberg, and Lawrence J. White (1999). "Youth, Adolescence, and Maturity of Banks: Credit Availability to Small Business in an Era of Banking Consolidation," Journal of Banking and Finance, vol. 23 (February), pp. 463-92.
Frame, W. Scott, Michael Padhi, and Lynn Woosley (2001). "The Effect of Credit Scoring on Small Business Lending in Low- and Moderate-Income Areas," Working Paper Series 2001-6. Atlanta: Federal Reserve Bank of Atlanta, April.
------------ (2004). "Credit Scoring and the Availability of Small Business Credit in Low- and Moderate-Income Areas," Financial Review, vol. 39 (February), pp. 35-54.
Frame, W. Scott, Aruna Srinivasan, and Lynn Woosley (2001). "The Effect of Credit Scoring on Small-Business Lending," Journal of Money, Credit, and Banking, vol. 33 (August), pp. 813-25.
Group of Ten (2001). Report on Consolidation in the Financial Sector. Washington: International Monetary Fund, Bank for International Settlements, and Organisation for Economic Co-operation and Development, January.
Hancock, Diana, Joe Peek, and James A. Wilcox (2005). "The Effects of Mergers and Acquisitions on Small Business Lending by Large Banks," Research Study 254. Washington: U.S. Small Business Administration, Office of Advocacy, March.
Hand, David J., and W.E. Henley (1997). "Statistical Classification Methods in Consumer Credit Scoring: A Review," Journal of the Royal Statistical Society, vol. 160 (3), pp. 522-41.
Jayaratne, Jith, and John Wolken (1999). "How Important Are Small Banks to Small Business Lending? New Evidence from a Survey of Small Firms," Journal of Banking and Finance, vol. 23 (February), pp. 427-58.
Keeton, William R. (2000). "Are Mergers Responsible for the Surge in New Bank Charters?" Federal Reserve Bank of Kansas City, Economic Review, vol. 85 (1), pp. 21-41.
Kendall, Leon T., and Michael J. Fishman (1998). A Primer on Securitization. Cambridge, Mass.: MIT Press.
Knaup, Amy E. (2005). "Survival and Longevity in the Business Employment Dynamics Data," Monthly Labor Review, vol. 128 (May), pp. 50-56.
Mach, Traci L., and John D. Wolken (2006). "Financial Services Used by Small Businesses: Evidence from the 2003 Survey of Small Business Finances," Federal Reserve Bulletin, vol. 92 (October), pp. A167-95.
Matthews, Gordon (2001). "Small Biz Scoring to Face First Test." U.S. Banker. vol. 111 (April), pp. 26-27.
Mester, Loretta J. (1997). "What's the Point of Credit Scoring?" Federal Reserve Bank of Philadelphia, Business Review (September-October), pp. 3-16.
Moody's Investors Service (2007). "2006 Review and 2007 Outlook: Commercial ABS," Structured Finance Special Report. New York: MIS, January.
Ou, Charles (2005). "Banking Consolidation and Small Business Lending: A Review of Recent Research," Working Paper. Washington: U.S. Small Business Administration, Office of Advocacy, March.
Padhi, Michael S., Lynn W. Woosley, and Aruna Srinivasan (1999). "Credit Scoring and Small Business Lending in Low- and Moderate-Income Communities," Business Access to Capital and Credit, proceedings of a Federal Reserve System Research Conference. Chicago: Federal Reserve Bank of Chicago, pp. 587-624.
Peek, Joe, and Eric S. Rosengren (1998). "Bank Consolidation and Small Business Lending: It's Not Just Size That Matters," Journal of Banking and Finance, vol. 22 (August), pp. 799-819.
Petersen, Mitchell A., and Raghuram G. Rajan (1995). "The Effect of Credit Market Competition on Lending Relationships," Quarterly Journal of Economics, vol. 110 (May), pp. 407-43.
Pilloff, Steven J. (2001). "Commercial Banking," in Walter Adams and James Brock, eds., The Structure of American Industry. Upper Saddle River, N.J.: Prentice-Hall.
------------ (2004). "Bank Merger Activity in the United States, 1994-2003," Staff Study 176. Washington: Board of Governors of the Federal Reserve System, May.
Pryde, Joan (2001). "Banks Won't Junk Credit-Scoring Models," Kiplinger Business Forecasts, May 16.
Rhoades, Stephen A. (2000). Bank Mergers and Banking Structure in the United States, 1980-98, Staff Study 174. Washington: Board of Governors of the Federal Reserve System, August.
Samolyk, Katherine, and Christopher A. Richardson (2003). "Bank Consolidation and Small Business Lending within Local Markets," Working Paper Series 2003-02. Washington: Federal Deposit Insurance Corporation, April.
Scott, Jonathan A., William C. Dunkelberg, and William J. Dennis, Jr. (2003). Credit, Banks and Small Business--The New Century. Washington: National Federation of Independent Business, January.
Seelig, Steven A., and Timothy Critchfield (2003). "Merger Activity as a Determinant of De Novo Entry into Urban Banking Markets," Working Paper Series 03-1. Washington, Federal Deposit Insurance Corporation, April.
Strahan, Philip E., and James P. Weston (1998). "Small Business Lending and the Changing Structure of the Banking Industry," Journal of Banking and Finance, vol. 22 (August), pp. 821-45.
Temkin, Kenneth, and Roger C. Kormendi (2003). An Exploration of a Secondary Market for Small Business Loans. Washington: U.S. Small Business Administration, Office of Advocacy, April.
U.S. Government Accountability Office (2007). Tax Policy: New Markets Tax Credit Appears to Increase Investment by Investors in Low-Income Communities, but Opportunities Exist to Better Monitor Compliance: Report to Congressional Committees. Washington: GAO, January.
U.S. Small Business Administration (various years). SBA's Performance and Accountability Report. Washington: SBA, www.sba.gov/aboutsba/budgetsplans/index.html.
------------ (2005). Secondary Market Program for Calendar Year 2005: 21st Annual Report to the United States Senate and House of Representatives. Washington: SBA, Office of Financial Assistance.
U.S. Small Business Administration, Office of Advocacy (various years). SBA's 2006 Performance and Accountability Report: Management's Discussion and Analysis. Washington: SBA, November, www.sba.gov/aboutsba/budgetsplans/serv_abtsba_budgets_par2006.html.
------------ (2006). The Small Business Economy for Data Year 2005: A Report to the President. Washington: U.S. Government Printing Office, December.
Footnotes
1. As required by the law, in preparing this report, the Board consulted with the Director of the Office of Thrift Supervision, the Comptroller of the Currency, the Administrator of the National Credit Union Administration, the Administrator of the Small Business Administration, the Board of Directors of the Federal Deposit Insurance Corporation, and the Secretary of Commerce.
2. Comprehensive data that directly measure the financing activities of small businesses do not exist. However, several sources of information can be used to proxy small business activity and identify patterns of small business financing. This report focuses on the period from 2002 through June 2007 and does not reflect developments since then.
3. The 2003 SSBF gathered data for fiscal year 2003 from 4,240 firms selected to be representative of small businesses operating in the United States in December 2003 (Mach and Wolken, 2006, pp. 188-89). The survey gathered details on the characteristics of each business and its top three owners, the firm's income statement and balance sheet, and details of the use and sources of financial services. It also obtained information about the firm's recent borrowing and credit application experience, the use of trade credit, and capital infusions. The previous survey had been conducted for fiscal year 1998 using a sample of 3,561 firms. Although the small business survey was called the National Survey of Small Business Finances before 1998, it is referred to as the Survey of Small Business Finances in this report for all years.
4. The term "traditional" type of credit is used in this report to help distinguish credit lines, loans, and leases from other products that have certain credit-like features.
5. Analysis of the small business lending activities of commercial banks and savings institutions is based on midyear Reports of Condition and Income (Call Reports) and midyear Thrift Financial Reports, which are filed by commercial banks, savings banks, and savings and loan associations. These reports include information on the number and amount of business loans of $1 million or less.
6. Under the horizontal-merger guidelines of the U.S. Department of Justice and the Federal Trade Commission, a market in which the deposit-based Herfindahl-Hirschman Index (HHI) ranges from 1000 to 1800 is considered moderately concentrated. In 2006, the average deposit-based HHI for commercial banks in metropolitan statistical areas was about 1600.
7. Data used in this section are from the flow of funds accounts published by the Board of Governors of the Federal Reserve System, Consolidated Reports of Condition and Income for banks, and surveys of lenders and of small businesses. Information from the flow of funds accounts relates to organizational type rather than to size of firm. A business can be organized as a corporation (C type or S type), a proprietorship, or a partnership. Most proprietorships and partnerships are small businesses. Large, publicly traded firms are C corporations, subject to corporate income taxes and securities laws. The S type of corporation is designed primarily for small businesses and generally is not subject to corporate income taxes.
8. In this section, data on partnerships and proprietorships are from the flow of funds accounts published by the Federal Reserve Board, and total small business debt is defined as unincorporated nonfinancial business debt from the flow of funds accounts. These data may include some large proprietorships and partnerships, which would not be considered small businesses. According to the 2003 Survey of Small Business Finances, partnerships and proprietorships make up just more than half of small businesses and tend to be smaller than small corporations.
9. Each month the NFIB polls a random sample of its members to assess business conditions and the availability of credit for small businesses. For the first month of each quarter, roughly 7,000 firms receive questionnaires, and about 1,100 typically respond; for the remaining two months of each quarter, about 2,500 questionnaires are mailed, with around 500 responses. About 90 percent of the respondents have fewer than forty employees.
10. Results from NFIB surveys in July and August (not shown) indicate that credit conditions have not materially tightened in recent months. Data on small business loan prices (interest rates and fees) are not publicly reported or widely available. Therefore, the analysis and discussion of pricing in this report are limited.
11. About one-third of businesses with employees fail in the first two years, and 56 percent fail within four years (Knaup, 2005).
12. Banks typically provide multiple products to small businesses that borrow from them. The 2003 SSBF indicates that small firms that obtained at least one product at a commercial bank averaged 2.1 products at that bank. The comparable average number of products at nonbanks was 1.2. Small firms with at least one product at a bank had one or more other products at that bank at least 60 percent of the time. In contrast, 83 percent of small firms that had a product with a nonbank provider obtained no other products from the nonbank.
13. A detailed description of the process of relationship lending and the way it differs from nonrelationship lending is provided by Berger and Udell (2002). Boot (2000) and Berger and Udell (1998) include detailed discussions of the costs and benefits of relationship lending, including a review of the literature.
14. Recent information on community banks and relationship lending is in Critchfield and others (2004) and Avery and Samolyk (2004).
15. More information on the 2003 SSBF is in Mach and Wolken (2006). Bitler, Robb, and Wolken (2001) report on the 1998 SSBF.
16. In this report, many of the figures based on data from the 1998 and 2003 SSBFs are presented in tables. However, some figures are computed from the survey data but not reported in tables. In such instances, the SSBF is cited as the source of the information.
17. In this section, the terms share of outstanding credit and share of traditional credit outstanding are used interchangeably. In both instances, the denominator is the total dollar amount of outstanding traditional credit.
18. By definition, small businesses organized as proprietorships cannot have owner loans because the business and owner are one.
19. In this section and table A.9, data on credit applications exclude credit renewals, applications associated with credit cards, trade credit, and owner loans or applications that were withdrawn or upon which a decision had not yet been made.
20. The business credit score from Dun and Bradstreet ranges from zero to 100, with 100 indicating the least risky firm. Statistics reported in the text are calculated from Dun and Bradstreet credit-score data for the population of firms represented by the 2003 SSBF.
21. The question asked was "during the last three years, were there times when [the firm] needed credit but did not apply because it thought the application would be turned down?"
22. The majority of other loans were loans that could not be classified as credit lines, mortgages, vehicle loans, equipment loans, or capital leases. Such loans were most likely term (loans that typically carry a fixed interest rate and a fixed maturity, generally repaid in monthly installations) or signature loans (a fixed term unsecured loan secured by a personal signature and promise to repay), and roughly 70 percent were unsecured.
23. Another source of data on small business loans is the information reported pursuant to the regulations (such as the Federal Reserve Board's Regulation BB) that implement the Community Reinvestment Act (CRA). The data collected include information on credit extensions for small businesses, small farms, and community development. The data are not analyzed in this report because the regulations that implement the CRA were modified in 2005 to eliminate mandated reporting for institutions with assets less than $1 billion. As a result, the number of institutions providing data has fallen sharply. In 2006, only about 1,000 banks and thrifts, or 11 percent of the total, reported data. For CRA reporters, the CRA data on loan originations is highly correlated with the June Call Report data on outstanding loans. However, most CRA reporters are very large institutions, which may differ significantly from smaller ones. More information on CRA-related small business lending is available at http://www.ffiec.gov/cra/default.htm.
24. Analysis in this section is based on Call Report and TFR data from June 2006 because data for June 2007 are preliminary and were unavailable until late August.
25. For loans drawn down under lines of credit or loan commitments, the original amount of the loan is the size of the line of credit or loan commitment when it was most recently approved, extended, or renewed before the report date. If the amount currently outstanding exceeds this size, the original amount is the amount currently outstanding as of the report date. For loan participations and syndications, the original amount is the entire amount of the credit originated by the lead lender. For all other loans, the original amount is the total amount of the loan at origination or the amount currently outstanding as of the report date, whichever is larger.
26. Other unreported small business loans include home mortgage and other consumer loans that are used by small business owners for commercial purposes. Such loans are included in statistics from the SSBF but not in statistics from the Call Reports or TFRs.
27. According to the 2003 SSBF, the median line of credit commitment was $50,000. In contrast, the 3.5 percent of commitments that were larger than one million dollars had a median of $3,300,000.
28. Except where indicated, bank data are aggregated to the banking organization level by summing data for all commonly owned commercial banking institutions. The organization is considered a single entity. Data for affiliated nonbank subsidiaries are excluded.
29. A thorough discussion of merger activity in the banking industry is in Avery and Samolyk (2004), Group of Ten (2001), Pilloff (2001, 2004), Rhoades (2000), or Berger, Demsetz, and Strahan (1999).
30. Data on bank mergers and acquisitions between 1994 and 2003 are from Pilloff (2004). Tables in Pilloff (2004) were updated for 2004-06 with information from Call Reports, Summary of Deposit statistics, and data from SNL Financial.
31. With Call Report and TFR data, business loans of $1 million or less are considered small.
32. A general review is in Ou (2005). Studies have typically focused on small business credit supplied by commercial banks. Credit obtained from other financial or nonfinancial firms has usually not been included in the analyses. Such studies provide a somewhat incomplete picture of small business lending, but because banks are the primary supplier of credit to small businesses, findings based on bank lending are likely to be relevant to the overall provision of small business credit.
33. Data from the 2003 SSBF indicate that between 1998 and 2003, the share of credit obtained by small businesses from nonbank financial institutions increased from 27 percent to 35 percent. During the same period, the share of credit obtained by small businesses from commercial banks fell from 65 percent to 57 percent. Nonbank financial institutions include thrifts, credit unions, and finance, insurance, leasing, and mortgage companies. Related data are in table A.5 of this report and table A.5 of Board of Governors (2002).
34. Other sources showing the importance of proximity for small business lenders are CRA data and surveys conducted by the National Federation of Independent Business (NFIB). The CRA data indicate that the vast majority of small business loan originations are made by in-market lenders (Board of Governors, 2002, p. 46). Brevoort and Hannan (2006, p. 4), using CRA data, report that distance is negatively associated with the probability of a small business loan being made and that "there has been no discernable increase in the distance between lenders and their local borrowers … in recent years." NFIB surveys indicate that the majority of small business financial institutions are located within ten minutes of borrowers' offices (Scott, Dunkelberg, and Dennis, 2003).
35. A more thorough discussion of credit scoring is provided in the "Special Issues" section of this report.
36. A thorough summary of the literature on relationship lending is in Boot (2000) or Berger and Udell (1998).
37. In assessing the likely competitive effects of proposed bank mergers and acquisitions, both the Federal Reserve Board and the Department of Justice use local deposits as a proxy for a banking organization's capacity to provide a cluster of commercial banking products and services within a banking market.
38. In reviewing bank merger applications, the Federal Reserve Board typically computes HHIs that give commercial bank deposits a weight of 100 percent and thrift deposits a weight of 50 percent. This "downweighting" of thrifts reflects the fact that they are generally less active in commercial lending than are commercial banks and hence should not be considered "full competitors" in the provision of banking services. On a case-by-case basis, the deposits of those thrifts that are active commercial lenders are given a weight of 100 percent in the Federal Reserve Board's calculations.
39. Under the horizontal-merger guidelines of the U.S. Department of Justice and the Federal Trade Commission, a market in which the HHI is less than 1000 is considered unconcentrated, one in which it ranges from 1000 to 1800 is considered moderately concentrated, and one in which it is greater than 1800 is considered highly concentrated. A value of 10000 indicates perfect monopoly, and zero indicates perfect competition.
40. Savings institutions also make loans to businesses. Unlike commercial banks, federal savings institutions are restricted by statute to holding no more than 20 percent of their assets in commercial loans, and amounts in excess of 10 percent must be small business loans.
41. The 2003 SSBF data corroborate these findings. Thrifts accounted for about 6 percent of total outstanding small business loans, whereas banks accounted for 56.8 percent. Nearly three-fourths of the small business dollars outstanding at thrifts were mortgage loans. In contrast, almost one-half of such dollars outstanding at commercial banks were lines of credit.
42. Cowan and Cowan (2006) report that, other than in loan underwriting, credit scores are most often used in the periodic reevaluation of existing loans and are also used, somewhat less frequently, in loan monitoring.
43. A detailed overview of consumer credit-scoring models, including the treatment of various statistical issues encountered when building such models, is in Hand and Henley (1997).
44. Whether this time savings occurs in practice, however, depends on how credit scoring is used. Recent survey evidence (Cowan and Cowan, 2006) confirms that banks implement the use of credit scoring for small business loans in a number of different ways, and, among those institutions that use small business credit scores, few of them rely solely on rules based on credit scores for most underwriting of small business loans.
45. The importance of the owner's personal financial history is greatest for the smallest loans. For example, Frame, Srinivasan, and Woosley (2001) report that the personal credit history of the business owner is especially predictive for loans of $100,000 or less.
46. According to Pryde (2001), Fair Isaac estimated that twenty-three of the top twenty-five small business lenders in the United States use its credit-scoring systems. As of 2006, about one-fourth of banks that use small business credit scoring obtain scores from Fair Isaac (Cowan and Cowan, 2006).
47. These concerns have been somewhat mitigated as additional firms, including Dun and Bradstreet and Equifax, have entered the market for small business credit scoring (Berger and Frame, 2005).
48. Avery and others (2000) examine the influence of economic and other factors on credit scores and find evidence that suggests that the performance of scoring models may vary as economic conditions change.
49. Although Cowan and Cowan's model did not identify size per se as a significant variable in their adoption equation, size may be partly driving this result. Typically, larger banks have smaller proportions of their loans invested in small business lending than do smaller banks.
50. The Equal Credit Opportunity Act (ECOA) makes it unlawful for creditors to discriminate on the basis of race, color, religion, national origin, sex, marital status, or age. The act is implemented by the Board's Regulation B. The provisions in the ECOA and Regulation B apply to business and commercial credit. Special rules are set forth dealing with creditors that use credit-scoring systems.
51. The six states are Alabama, Florida, Georgia, Louisiana, Mississippi, and Tennessee.
52. The Small Business Administration's 7(a) Guaranty Loan program is discussed in the next section.
53. Although credit scoring has the potential to increase the uniformity of underwriting procedures and standards for small business loans, thereby expanding access to secondary markets, Cowan and Cowan (2006, p. viii) report that "there is no indication of any momentum in the development of secondary markets for small business loans." Their survey finds that respondents generally did not view secondary-market sales as an important reason for adopting small business credit scoring.
54. The data in this report on non-SBA small business loans was obtained from Moody's. In 2006 the small balance commercial loan-backed market reached approximately $5.6 billion, consisting of 13 deals that involved non-SBA small business loans. These deals represent a 7 percent increase over 2005. According to Moody's, the deals are comprised of owner occupied properties, investor properties and, in some cases, SBA backed loans. Additional information on the composition of these securities is unavailable. Consequently, the $5.6 billion is an upper bound of the amount of non-SBA backed securities. (Moody's, 2007).
55. This estimate likely understates the total amount of small business loans. The SSBF collects information on all loans used for business purposes by small businesses. Undoubtedly, some of these loans, such as auto loans or home equity loans used for business purposes, would not be booked at commercial banks as commercial and industrial loans or commercial real estate loans but as consumer loans or residential real estate loans. Consequently, the data on outstanding loans obtained from Call Reports probably understate the total amount of such loans to small businesses.
56. According to the Small Business Administration, in 2006, SBA loan originations equaled about $20 billion, of which $14.5 billion in loans were originated under the 7(a) Guaranty Loan program.
57. The SBA also administers the Small Business Innovation Research program and the Small Business Technology Transfer program, federal initiatives that help small innovative firms obtain funding from government agencies for research and development activities.
58. Additional details, particularly with respect to financial services unrelated to credit, can be found in Mach and Wolken (2006).