Over many decades, the Federal Reserve and the Bundesbank have enjoyed a very productive working relationship that has included sharing our concerns and insights about good policy. The sharing has been not only between our two institutions but with the policy and research communities more broadly. This conference is one more such occasion, and I am grateful to the Bundesbank organizers for this opportunity to speak this evening.
Several of my recent assignments, both at the Board and in international groups, concerned the continuing effects of financial innovation and liberalization on the scope and scale of financial activity around the globe. In fact, in terms of sheer volume, the expansion of financial activity has greatly outstripped economic growth in recent years. With wider and faster access to information, markets have become more precise, on balance, in pricing value and risk. Innovation and liberalization have also brought more diverse opportunities for investors and borrowers, a wider selection of financial instruments, and generally improved risk management. The overall result has been more-efficient use of financial and real resources and, ultimately, better economic performance. Many observers believe that this result has been a key factor in the strong productivity and growth that the United States has realized in recent years.
Many economies have become more resilient and more capable of withstanding shocks, but financial markets themselves seem to have become more sensitive to real-time data. The past decade has been marked by episodes of financial volatility that have had the potential for trouble at a systemic level. Linkages between financial markets and real economic outcomes have become more complex, periodically presenting policymakers with surprises and puzzles. And, paralleling efforts by central banks at improving transparency of the policy process, heightened scrutiny of policy by markets has added both new benefits and new complexities.
A particular phenomenon that touches on all these issues is the movement of asset prices, especially the prices of equities and residential real estate. Because these assets are the most widely held by the general public, price changes, even when not exceptional, can significantly affect the macroeconomy. Rising asset prices support household consumption, whereas falling asset prices damp consumption. In a scenario of collapse, the damage to balance sheets and private wealth could go as far as undermining the soundness of the financial system and threatening stability of the real economy. Apart from such outcomes, policymakers might also take special interest in asset price movements because it has been alleged that badly designed or poorly implemented policy (even if well intended) sometimes has helped feed unsustainable movements in asset prices. Accordingly, I would like to highlight some aspects of the link between monetary conditions and asset prices and point to areas in which the policy community could use further insight from researchers, including perhaps from this distinguished group. I should note, my comments this evening reflect only my views and should not be taken to represent the views of my colleagues on the Board of Governors or in the Federal Reserve System.
Interaction of Asset Prices and Policy
Asset price movements that are discontinuous or extreme can affect the
policy process in at least two important ways. First, because they are
interest-sensitive, asset prices are primary components of the channels
by which monetary policy is transmitted to the real economy. If these
transmission channels are disrupted, the reliability and the effectiveness
of policy are degraded. In the worst case, policy's room for maneuver
may be narrowed or even severely compromised, and risks of a policy blunder
are heightened. Second, because asset prices are forward-looking, they
should contain information of value for the policy-setting process. If
those signals of market participants' expectations are blurred by
extreme movements, important information may be misread or lost.
Of course, some uncertainty is inevitable and quite manageable in the course of normal policymaking. By virtue of its mandate, the Federal Reserve focuses on price stability, interpreted to mean stability of consumer prices. Monetary policy does not aim at any particular relative price, nor is the mandate thought to refer to prices beyond consumer prices, such as those for assets. Ordinarily, however, asset prices are among the many factors that central bankers assess when we evaluate present economic and financial conditions and the outlook. And when asset prices exhibit large, systematic, and persistent deviations from fundamentals, the implications of those deviations inevitably get more prominence. Clearly central bankers would benefit from a better understanding of asset price movements--particularly more extreme movements--so that we do not mistakenly facilitate in some way potentially harmful outcomes.
Liquidity and Asset Prices
Overly rapid monetary expansion, or excessive liquidity, has been named
as a leading suspect in some episodes of unsustainable movements in asset
prices. Liquidity is not a precise concept, however. Liquidity could be
measured narrowly as central bank money, for example, or more broadly
to reflect the multiplier effects of the financial system; sometimes it
is measured instead by the level of policy interest rates. All these definitions
and others have been in play in the economics profession's analysis
of the link between monetary conditions and asset prices. What is meant
by "excessive" is even less well defined. Some commentators
have taken a circular approach: If monetary conditions were comparatively
easy when asset prices experienced a significant swing, then liquidity
must have been "excessive."
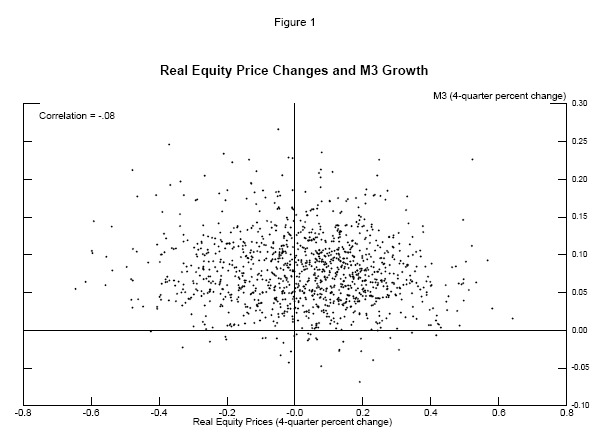
A good place to start to unravel some of these issues is to look at the data. The results of research at the Board and that of many others seeking to document a link between liquidity and swings in asset prices has focused on growth rates of broad monetary aggregates and measures of equity and house prices deflated by the price index for personal consumption expenditures.1 Using these measures, the results differ significantly according to the type of asset being studied. For equity prices, under various alternative specifications, the link between the growth rate of liquidity and changes in real equity prices at frequencies beyond very short term appears to be tenuous at best.2 To illustrate, the upper panel of figure 1 shows a scatter plot of contemporaneous four-quarter growth rates of M3 and changes in broad measures of equity prices for sixteen industrial countries during roughly the past twenty-five years.3 As you can see, no obvious sign of a meaningful correlation at this frequency is evident in this pattern. Indeed, the actual correlation is slightly negative. Most other studies--such as the study by Bordo and Wheelock--using a variety of definitions and more-rigorous techniques, support the same conclusion.4 The lack of a strong finding of any positive medium- to longer-run relationship, of course, could be because equity prices are quite volatile, making unconditional correlation difficult to identify. Perhaps, too, more-refined measures of liquidity than those used in studies so far are needed to capture possible effects on equity prices. So the effect of money growth on real equity prices is by no means a closed question, and there certainly would be interest in whatever might come from further research on this topic.
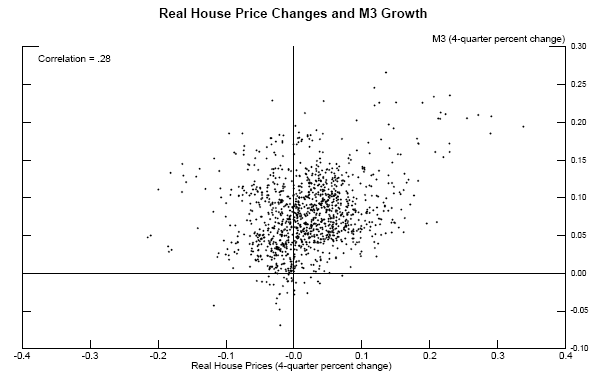
In contrast, the link between monetary growth, as measured by M3, and changes in real house prices appears to be more definite. The bottom panel of figure 1 shows a similar scatter plot for the same group of countries and periods as in the upper panel, but for changes in real house prices. The two series exhibit a small positive correlation that is statistically significant. Moreover, various tests have shown that the correlation is not just a recent phenomenon or confined to a few countries; it is evident in varying degrees both over time and across our sample of sixteen countries. Again, this finding is consistent with findings from a number of other academic researchers. (I might add that the correlation with real house prices also holds even if M3 is normalized by prices or gross domestic product. Negative correlation between interest rates and house prices is, of course, not unexpected.)
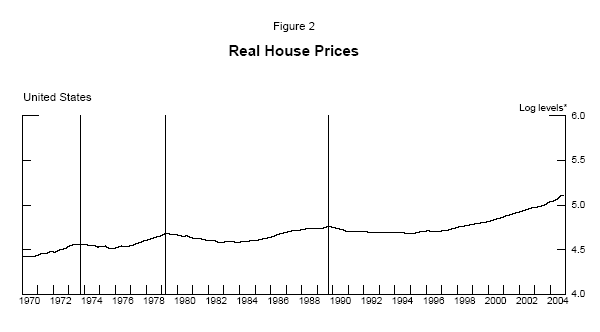
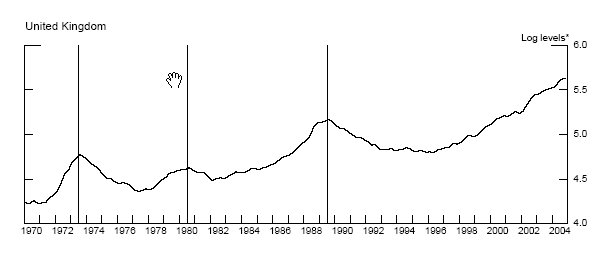
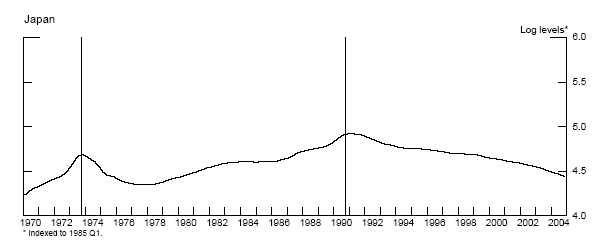
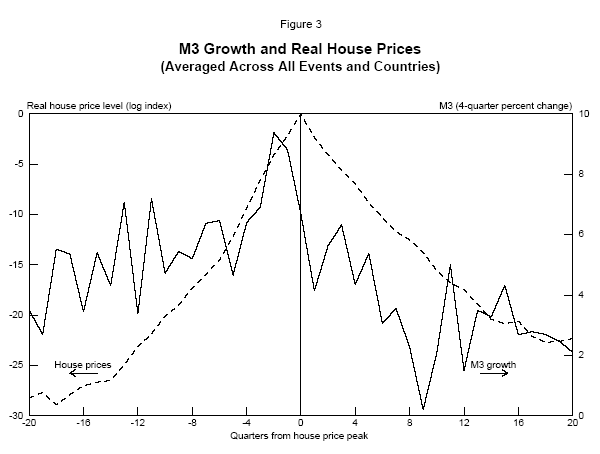
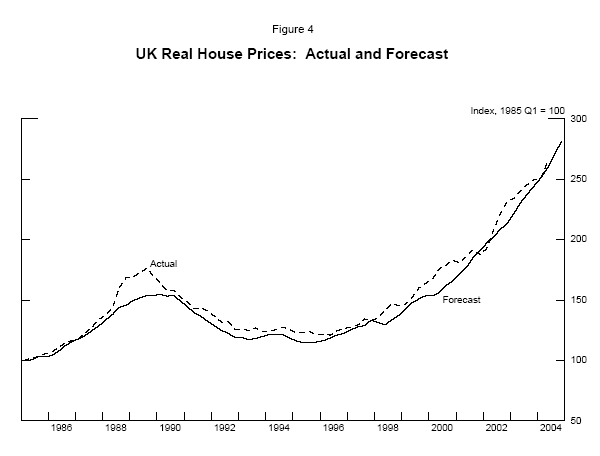
To explore this relationship further, figure 2 provides some background on longer-term movements in house prices in the United States, the United Kingdom, and Japan--three countries where house price movements have been prominent.5 As the three panels show, each country's movements in real house prices have experienced two or three cycles during the past thirty-five years, usually with relatively long periods of gains followed by long periods of decline. This suggests that one potentially useful way to explore further the relationship between liquidity and asset prices is to examine movements in those two variables in ten-year windows surrounding house price peaks. The solid line in figure 3 shows the average behavior of the growth rate of M3 from twenty quarters before a peak in real house prices until twenty quarters after the peak, where the average is taken across all the cyclical episodes in our broad sample. The broken line in the chart is the log level of real house prices indexed to zero in the peak year. As can be seen from the chart, on average the growth rate of money increases fairly steadily until around two quarters before the peak in real house prices and then drops fairly steadily for ten quarters afterward before recovering somewhat. Although there are some variations, this pattern tends to occur in most countries' episodes.6 Importantly, the connection between money growth and house prices does not seem to vary much with the rate of macroeconomic expansion. This statement is underlined by figure 4, which shows as an example actual house prices for the United Kingdom (the broken line) and their forecasted values from an equation based on the growth rate of real broad money and real long-term interest rates over more than twenty years (the solid line). The close correspondence is apparent.
While these results are suggestive, correlation is by no means causality. Confirming that variations in growth rates of liquidity (especially unusual changes in liquidity growth that could be called excessive) systematically lead to wide swings in real asset prices requires further theoretical investigation and more empirical support. That asset prices rise during a period of monetary easing is not surprising, of course. But why growth of money sometimes might cause housing prices to move more than other asset prices or, for that matter, than goods prices is not clear. Indeed, some elements of causality run in the opposite direction, clouding the underlying relationships. For instance, as the value of collateral rises during a house price boom, the associated expansion of credit typically leads to increases in broad money. The effect can be accentuated by the temporary parking in liquid accounts of the proceeds from the more-frequent turnover and refinancings that often accompany a house price boom.
Complicating the analysis further, a substantial list of third factors could drive both housing prices and liquidity measures, producing co-movements that look like causality. A productivity shock or a sharp decrease in energy prices, for example, could lead to general economic expansion and rising asset prices while goods prices are not rising. This situation might allow more liquid monetary conditions than would otherwise be the case. Distinguishing the various forces in play obviously requires tools that are finer than simple observations that both liquidity measures and assets prices are moving together.
Identification of Unsustainable Movements
The example cited above also should remind us that not all situations
in which asset prices are rising rapidly under seemingly easy monetary
conditions are worrisome. Some are quite benign and even signal a healthy
economy. Accordingly, for policymakers who have to confront these situations
in real time, a fundamental challenge is identification. When asset prices
are moving in an unusual manner, is the movement unsustainable; does the
pattern arise from excessive liquidity in the market; and will policy
be challenged by that combination at some future date? Or are we observing
a more complex process, perhaps less aberrant and less prone to a troubling
reversal?
The answers to these questions depend in part on the link between an asset's price and some estimate of its "fundamental" value. Unfortunately, from the point of view of both the analyst and the policymaker, the link between an asset's price and the structure of its return is hard to pin down, as it typically embodies complex factors that are inherently difficult to measure, such as expected future earnings, riskiness, and risk aversion. Consequently, for evaluating in real time whether prices may be "off track" and, if so, by how much, we have to fall back on more readily observable measures that, in principle at least, should bear some systematic relationship to ideal measures and that can be assessed against historical experience. For equities, a stock's price-earnings ratio is a standard benchmark for assessing valuation. In the late 1990s, the price-earnings ratio for U.S. equities--especially in the high-tech area--soared to record levels, and the so-called equity risk premium narrowed to a historical low. There was a strong sense at the time that such elevated price levels were unusual, but there was no uniform consensus regarding whether or not they were sustainable. All agreed, however, that the pricing of assets, given profit expectations, was difficult. And even after we have seen a major correction, our understanding of what drove that process and what the proper level should have been--and should be now--still is unsettled.7
For housing, rent-to-price ratios and income-to-price ratios are commonly used measures to assess valuation. Over the past several years, both measures have decreased sharply in many countries, and they currently are well outside historical ranges in some countries. In 2004, U.S. home prices increased 11.2 percent, their fastest pace since 1979, and right now, housing prices in many markets in the United States are relatively high when judged by conventional valuation measures.8 To know if housing is fairly valued requires assessing whether today's valuations are consistent with unobservable future rents, interest rates, and returns--concepts for which we have only rough proxies. However, in some markets the most prudent judgment is that the growth of house prices will slow from the rapid pace experienced most recently.
Interpretation of Correlation: Other Fundamental Factors
The issue of identification becomes much more difficult in a changing
environment. Some patterns of asset price changes that are attributed
to excess liquidity may arise, for example, from financial innovation
and other structural changes.9 But mapping such changes into asset price
movements to control for such factors is difficult. For example, the rise
in house prices in the United Kingdom in the late 1980s was thought at
the time to relate importantly to the liberalization of U.K. banking laws
several years earlier and, therefore, likely to be sustainable. As it
turned out, the run-up ended fairly soon and was followed by a steep decline.
The inability to more accurately gauge the effects on asset prices conferred
(or not) by earlier structural changes likely contributed to the inaccurate
expectation that they would last longer. In Sweden, the large and swift
increases in property prices in the 1980s also related in part to the
earlier liberalization of domestic banking laws and consequent easier
lending practices. The tax reform of 1990, which among other things made
the tax treatment of mortgage interest rates in Sweden considerably less
favorable, contributed to a subsequent drop in property prices that ultimately
severely stressed banks' balance sheets, an experience that again
highlighted the potential impact of such structural factors on asset price
movements.
Controlling for cyclical effects on both liquidity and real asset prices is basic, of course, in any empirical assessment of how they may be linked. But some observers have conjectured that, beyond conventional cyclical patterns in a benign environment with low-inflation and strong real growth such as we have had in recent years, investors' preferences and behaviors may change qualitatively in ways that are not captured well by models based on historical patterns. Faced with cumulating wealth and lower nominal returns, investors may develop a distinctly greater tolerance for risk that results in aggressive "search for yield" behavior. This behavior may engender, it is argued, a tendency for unusual run-ups in some asset prices. If so, a concern is that changes in the underlying conditions that fostered this pattern or a policy misstep could cause a quick reversion to the historical norm. The policy community has been on the lookout for such patterns of "search for yield" during the latest cycle of low rates and tightening.10
Others have argued that in certain circumstances, when special factors may be preventing inflationary pressures from showing through to consumer prices, increases in asset prices might serve as an early, more visible warning that liquidity is excessive. It has been asserted, for example, that the strength of the yen in the late 1980s stifled Japanese consumer price inflation and contributed to an easier policy stance by the Bank of Japan.11 The fact that resulting liquidity was greater than would have been ideal was most apparent (unfortunately, more so in retrospect) in Japan's booming asset prices. A sharp (but temporary) boost in productivity or disruption of exchange rate pass-through behavior could have similar masking effects. But whether, in general, asset prices could provide reliable signals of suppressed but impending general inflation is a complex matter, and elevating asset prices to a more prominent role in the policy process is not without a number of potential pitfalls.
Among other complications is the possibility that financial globalization may be changing the links between liquidity and asset prices. Movements in asset prices across countries now appear to be more synchronized. This synchronization could arise in a number of ways. National business cycles and policy responses may be moving more in tandem just because national economies have become more closely integrated through trade and investment, producing in turn a greater synchronization in asset markets. Global shocks (for example, from oil prices and geopolitical risk factors) that produce broadly similar effects on most economies may have become more prevalent and may tend to dominate idiosyncratic national shocks. But it also is quite possible that greater international diversification of portfolios now allows developments affecting assets in one country to spill over into markets of others--both at the level of particular industries and more broadly. If synchronization of asset price movements comes about mainly in this way, the suggestion is that excess liquidity in one country could move asset prices in another, perhaps significantly, even if liquidity was well contained in the latter.12
In the somewhat longer run, patterns of aggregate saving--influenced, for example, by demographic developments--may also affect the path of real interest rates and, in turn, prices of assets, again complicating interpretation of co-movements. For instance, an increase in savings as a growing share of the population nears retirement may reduce real rates and raise asset prices. Patterns of immigration that affect the population's demographic profile, too, can affect asset prices. In the United States, we have seen some of these effects in certain segments of the housing market.
Conclusions
In summary, although excess liquidity has been cited as a source of general
asset price instability, the support for this conclusion is mixed, at
best. We do find a positive correlation between growth rates of real house
prices and M3, but the correlation does not seem to hold for real asset
prices more generally--including, in particular, equities. In this talk,
I have suggested that we are only at the beginning of an understanding
of some of these relationships. Even if an underlying causal link exists
between some real asset prices and liquidity, many additional factors
may be influencing what we see, with potential for misleading us in interpreting
simple associations or correlations. The problem obviously is complex.
As a start, however, we need a better understanding of how asset prices
are determined that can be translated into guidance for a policy process
that uses real-time variables. To borrow a turn of phrase cited often
in the physical sciences, theory tends to "explain a complex visible,
with a simple invisible."13 In the realm of policy, of course, we need to
work with simple, but reliable visibles--a requirement that makes this
task all the more challenging. For that reason, I have been pleased to
join this group of distinguished economists this evening.
Appendix
Countries in the dataset and the date for the beginning of the broad money series used for each country are as follows:
| Country | First data point for broad money |
|---|---|
Australia |
1970 |
Belgium |
1996 |
Canada |
1970 |
Denmark |
1993 |
Finland |
1990 |
France |
1980 |
Germany |
1980 |
Japan |
1980 |
Netherlands |
1982 |
New Zealand |
1988 |
Norway |
1970 |
Spain |
1997 |
Sweden |
1985 |
Switzerland |
1985 |
United Kingdom |
1982 |
United States |
1970 |
Residential real estate and equity index data cover the period 1970-2004 for all countries except Spain, for which the coverage begins in 1971.
Figures
Footnotes
1. I wish to thank Robert Martin, Alain Chaboud, Jon Faust, and Brian Doyle of the Board staff for research support. Return to text
2. Various studies have found that stock prices do exhibit an immediate reaction to monetary policy surprises, not unlike their responses to other macroeconomic surprises, for example, Ben S. Bernanke and Kenneth Kuttner (2005), "What Explains the Stock Market's Reaction to Federal Reserve Policy?," Journal of Finance, vol. 60, 1221-57. Return to text
3. Data on residential real estate and equity prices are from the Bank for International Settlements and, for most countries, are quarterly. M3 data are derived from national sources; the length of the series on M3 varies across countries. The list of countries covered and the relevant periods are provided in the appendix. Return to text
4. Michael D. Bordo and David C. Wheelock (2004), "Monetary Policy and Asset Prices: A Look Back at Past U.S. Stock Market Booms," NBER Working Paper 10704. Return to text
5. House prices in other industrial countries have shown similar, but generally more modulated, swings. Return to text
6. The correlation between real house prices and money growth in Japan was close to zero during the deflationary 1990s. Return to text
7. For further details on the difficulty of identifying unsustainable movements in asset prices, see Refet S. Gurkaynak (2005), "Econometric Tests of Asset Price Bubbles: Taking Stock," (Finance and Economic Discussion Series) working paper 2005-04. Return to text
8. The source of the data is the Office of Federal Housing Enterprise Oversight. The OFHEO index is based on repeat sales prices derived from mortgage acquisitions on conforming loans. Return to text
9. See, for example, Franklin Allen and Douglas Gale (2000), "Bubbles and Crises," Economic Journal, vol. 110, pp. 236-56. Return to text
10. For example, see my statement as Chairman of the Financial Stability Forum to the International Monetary and Financial Committee, April 16, 2005, Washington, D.C., and International Monetary Fund Global Financial Stability Report, 2005. Return to text
11. See, for example, Takatoshi Ito and Frederic S. Mishkin (2004), "Two Decades of Japanese Monetary Policy and the Deflation Problem," NBER working paper 10878. Return to text
12. This argument obviously applies best to markets such as those for equities where cross-holdings and international diversification are comparatively well developed. An IMF research paper has found evidence of liquidity spillovers and that an increase in aggregate G-7 liquidity is "consistent with" an increase in G-7 real stock returns (Klaas Baks and Charles Kramer (1999), "Global Liquidity and Asset Prices: Measurement, Implications, and Spillovers," IMF working paper 99/168). Return to text
13. The origin of the remark is generally attributed to French scientist Jean Baptiste Perrin in his Nobel Lecture, given when accepting the 1926 Nobel Prize in physics. Return to text

