Profits and Balance Sheet Developments at U.S. Commercial Banks in 2007
William Bassett and Thomas King, of the Board's Division of Monetary Affairs, prepared this article. Thomas C. Allard assisted in developing the database underlying much of the analysis. Adina Goldstein and Oren D. Ziv provided research assistance.
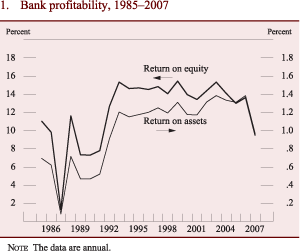
The U.S. commercial banking industry faced significant challenges in 2007, including continued deterioration in the performance of subprime mortgage-related assets and a more general reassessment by investors of structured finance instruments. Those developments contributed to significant strains in financial markets and dislocations in bank funding markets over the second half of the year. Moreover, economic growth slowed late in the year, and the outlook for 2008 worsened. The turmoil in financial markets hampered banks' securitization programs and their ability to syndicate leveraged loans, which put considerable pressure on the balance sheet capacity and liquidity positions of some banks. Profitability--especially in the final quarter of 2007--fell noticeably from the very high levels posted in recent years (figure 1). The drop in profits, reflecting primarily lower trading revenue and significantly higher provisions for loan losses, was more pronounced at large banks, but the net income of smaller banks also declined markedly.
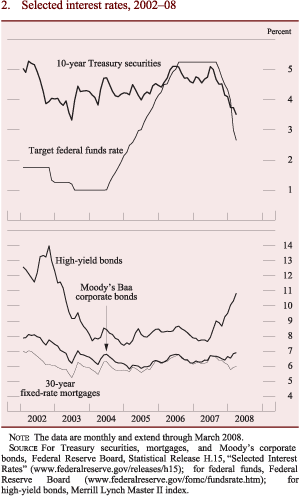
Financial markets came under considerable pressure in 2007. Problems that were mostly contained within the markets for subprime mortgages and related structured products in the first half of the year intensified around midyear. In turn, the deepening troubles in subprime mortgage credit quality caused investors to become increasingly concerned about the likely performance of even highly rated securities backed by subprime mortgages. Furthermore, investors reassessed the soundness of many structured financial products not backed by residential mortgages, including asset-backed commercial paper and collateralized loan obligations. Those developments, along with emerging worries about the economic outlook, contributed to a broad-based reduction in investors' appetite for risk over the second half of the year. As a consequence, the markets for some types of structured investment products virtually dried up by year-end, and the prices of such securities dropped, events that generated large losses at some banks and financial institutions. Yields on both investment-grade and speculative-grade corporate bonds increased, while those on Treasury securities fell because of easier actual and expected monetary policy as well as heightened demand for safer assets (figure 2). Equity prices dropped over the second half of the year, and volatility in many financial markets increased.
Despite the deterioration in housing-related markets and emerging financial strains, the U.S. economy generally performed well through the first three quarters of 2007. However, economic growth weakened considerably in the fourth quarter as pressures in financial markets worsened, the downturn in the housing market intensified, and prices for crude oil and some other commodities rose. Consumer spending and business investment, which had both increased at a healthy pace, on balance, over the first three quarters of the year, slowed, which contributed to reduced demand for credit from households and businesses. Late in the year, consumer sentiment worsened, and forward-looking indicators of business spending also became less favorable. The weakening outlook added to concerns about asset quality at banks. Measures of overall consumer price inflation stepped up in 2007, but core inflation (which excludes the direct effects of movements in energy and food prices) was little changed on balance. With downside risks to economic growth increasing, and with monetary policy makers generally expecting inflation to moderate somewhat in 2008 and 2009, the Federal Open Market Committee substantially eased the stance of monetary policy in late 2007 and early 2008.
The difficulties in financial markets, together with the ongoing weakness of the housing sector, had significant effects on bank balance sheets, especially over the second half of the year. As the residential real estate market contracted and banks tightened their credit standards, the growth of residential mortgages on banks' balance sheets slowed dramatically from the rapid rates posted between 2002 and 2006. At the same time, credit and liquidity concerns reduced institutional investors' willingness to participate in the syndicated loan market. Large commercial banks, which had underwritten a record volume of such loans in the first half of the year, primarily to finance leveraged buyouts, found themselves unable to place these loans in the market. Commercial and industrial lending at those banks expanded rapidly for a time as loans intended for syndication ended up on banks' books. At least partly in response to these unexpected additions to assets, banks sold U.S. Treasury and agency securities and tightened standards and terms on many types of loans.
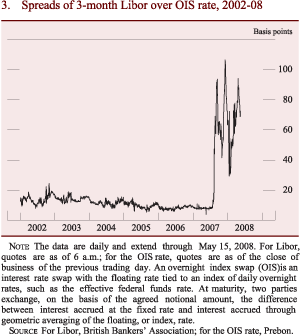
These balance sheet pressures, coupled with uncertainty about the size and distribution of losses on subprime mortgages and structured financial products, also strained short-term bank funding markets. The Federal Reserve responded to the financial turmoil with a series of actions to support liquidity and functioning in bank funding markets (partly in coordination with foreign central banks).1 Core deposits continued to grow relatively slowly. As spreads on interbank borrowing widened (figure 3), banks increasingly funded asset expansion with managed liabilities, including Federal Home Loan Bank (FHLB) advances, foreign deposits, and, late in the year, large time deposits.2 Some large banks also received substantial cash infusions from their parent holding companies.
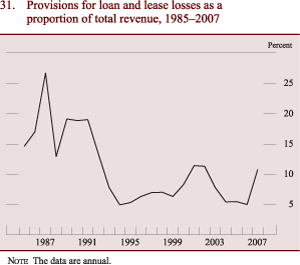
Financial and economic developments contributed to the decline in the profitability of the banking industry last year after a long period of very strong performance. As a consequence of the difficult conditions in financial markets, several large banks experienced sharp reductions in trading revenue. Solid revenues from investment banking activities and private asset-management businesses were insufficient to offset those decreases, and total non-interest income declined in 2007. Profitability was also depressed by a stepped-up rate of loss provisioning--which had been at very low levels--in response to an across-the-board worsening of asset quality. In addition, non-interest expense grew briskly last year despite a slight deceleration in employee compensation. Moreover, the declines in market interest rates and higher credit spreads observed in many sectors over the second half of 2007 were inadequate to boost the industrywide net interest margin, which continued its longer-run slide last year.
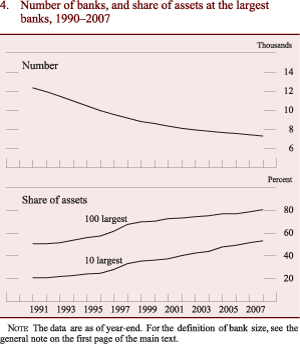
The number of new commercial banks chartered edged down in 2007, and the average size of such banks declined considerably from that of the previous two years. Merger activity also dipped last year but still outpaced bank formation. As a result, the number of banks declined further, to about 7,300 at the end of 2007 from about 7,450 at the end of 2006 (figure 4). The share of assets held by the top 10 banks increased further, reaching 53 percent at the end of 2007, and the share of assets held by the top 100 banks rose to 80 percent. According to the Federal Deposit Insurance Corporation, two banks with assets totaling $100 million failed in 2007.
The formation of new bank holding companies (BHCs) increased for the second consecutive year in 2007 and was the highest in several years. Mergers among BHCs also moved up last year, and the rate of mergers continued to exceed the rate at which new BHCs were formed. The number of BHCs thus edged down to about 5,070 from about 5,100 in 2006 (for multitiered BHCs, only the top-tier organization is counted in these figures). The number of financial holding companies held fairly steady in 2007 at about 640.3 The share of BHC assets that were held by financial holding companies was unchanged in 2007 at 86 percent.
Balance Sheet Developments
Balance sheet developments in 2007 were influenced importantly by the turbulence in financial markets in the second half of the year. The turmoil exerted pressure on both the asset and liability sides of banks' balance sheets, as banks found markets less receptive to sales of loans and securities and faced funding markets that were, at times, illiquid. Together with the softening macroeconomic picture, these disruptions led banks to become more cautious in the extension of credit and to take steps to bolster capital positions.
Total bank assets expanded 10.8 percent in 2007, down somewhat from the previous year but still strong by historical standards (table 1); indeed, the growth rate easily outpaced that of total domestic nonfinancial debt. And, excluding the conversion of one commercial bank to a thrift institution in the first quarter, bank assets grew even faster--11.9 percent. Loans expanded at about the same rate as assets, primarily because of rapid growth in commercial and industrial (C&I) lending. The demand for C&I loans was spurred, in part, by vigorous capital investment and financing for mergers and leveraged buyouts (LBOs) in the first half of the year. In the second half, the deterioration in credit markets caused C&I loans that had been intended for syndication to accumulate on banks' balance sheets. Residential mortgage lending slowed amid the contraction in home sales and the continuing decline in house prices, and lending in the commercial real estate market also decelerated late in the year. In contrast to the rapid pace of overall lending, banks' securities holdings expanded relatively slowly, a development that was likely a result, in part, of efforts to ease the pressures on balance sheets. Other types of bank assets expanded rapidly in 2007, as commercial banks were net providers of liquidity during the financial turbulence; in particular, short-term loans to financial institutions--in the form of federal funds sold, securities purchased under resale agreements, and balances due from depositories--increased 29 percent over the year.
| Percent | |||||||||||
| Item | 1998 | 1999 | 2000 | 2001 | 2002 | 2003 | 2004 | 2005 | 2006 | 2007 | MEMO Dec. 2007 (billions of dollars) |
|---|---|---|---|---|---|---|---|---|---|---|---|
| Assets | 8.21 | 5.47 | 8.78 | 5.13 | 7.23 | 7.25 | 10.80 | 7.79 | 12.36 | 10.81 | 11,077 |
| Interest-earning assets | 8.19 | 5.91 | 8.67 | 3.97 | 7.58 | 7.35 | 11.31 | 8.04 | 12.45 | 10.12 | 9,569 |
| Loans and leases (net) | 8.73 | 8.13 | 9.25 | 1.83 | 5.93 | 6.60 | 11.23 | 10.48 | 11.97 | 10.58 | 6,473 |
| Commercial and industrial | 12.96 | 7.90 | 8.55 | -6.72 | -7.39 | -4.52 | 4.37 | 12.54 | 11.81 | 20.38 | 1,362 |
| Real estate | 8.03 | 12.28 | 10.76 | 7.95 | 14.49 | 9.78 | 15.44 | 13.81 | 14.94 | 7.03 | 3,634 |
| Booked in domestic offices | 8.01 | 12.42 | 11.04 | 8.03 | 14.90 | 9.69 | 15.11 | 13.93 | 15.05 | 6.77 | 3,565 |
| One- to four-family residential | 6.39 | 9.73 | 9.29 | 5.71 | 19.92 | 10.05 | 15.76 | 11.95 | 15.11 | 5.54 | 1,995 |
| Other real estate | 10.34 | 16.16 | 13.34 | 10.97 | 8.85 | 9.22 | 14.24 | 16.62 | 14.96 | 8.37 | 1,570 |
| Booked in foreign offices | 8.79 | 6.28 | -1.62 | 3.97 | -7.41 | 15.74 | 35.59 | 7.19 | 8.79 | 22.76 | 69 |
| Consumer | .38 | -1.47 | 8.05 | 4.17 | 6.60 | 9.77 | 10.17 | 2.80 | 6.19 | 11.67 | 948 |
| Other loans and leases | 13.50 | 7.19 | 7.01 | -2.00 | -.02 | 8.31 | 3.57 | -.17 | 3.17 | 12.85 | 619 |
| Loan-loss reserves and unearned income | 3.10 | 2.40 | 8.00 | 13.17 | 5.82 | -2.48 | -4.18 | -5.56 | 1.66 | 27.63 | 90 |
| Securities | 8.45 | 5.14 | 6.39 | 7.26 | 16.28 | 9.46 | 10.59 | 2.40 | 11.53 | 4.57 | 2,195 |
| Investment account | 12.11 | 6.71 | 2.89 | 8.92 | 13.60 | 8.73 | 6.17 | 1.19 | 6.94 | -4.42 | 1,562 |
| U.S. Treasury | -25.05 | -1.87 | -32.71 | -40.23 | 41.93 | 14.14 | -15.87 | -17.59 | -19.30 | -26.90 | 29 |
| U.S. government agency and corporation obligations | 17.03 | 1.87 | 3.81 | 12.90 | 18.15 | 9.70 | 9.48 | -1.82 | 4.71 | -12.13 | 893 |
| Other | 27.02 | 20.93 | 13.41 | 12.19 | 2.81 | 6.04 | 3.03 | 10.12 | 13.78 | 10.72 | 639 |
| Trading account | -13.32 | -6.93 | 37.16 | -3.72 | 36.32 | 14.01 | 36.81 | 7.96 | 31.32 | 36.13 | 633 |
| Other | 3.80 | -8.35 | 10.33 | 13.04 | -2.92 | 6.86 | 14.29 | 5.99 | 19.29 | 22.34 | 901 |
| Non-interest-earning assets | 8.39 | 2.66 | 9.46 | 12.79 | 5.14 | 6.65 | 7.61 | 6.21 | 11.80 | 15.36 | 1,509 |
| Liabilities | 8.09 | 5.61 | 8.60 | 4.47 | 7.17 | 7.31 | 9.57 | 7.80 | 12.10 | 10.79 | 9,941 |
| Core deposits | 7.08 | .27 | 7.56 | 10.56 | 7.62 | 7.32 | 8.27 | 6.41 | 5.84 | 5.48 | 4,721 |
| Transaction deposits | -1.38 | -8.93 | -1.28 | 10.22 | -5.11 | 2.84 | 3.25 | -1.19 | -4.28 | -1.21 | 695 |
| Savings deposits (including MMDAs) | 18.35 | 6.71 | 12.53 | 20.69 | 18.51 | 13.71 | 11.73 | 6.94 | 5.53 | 3.33 | 2,995 |
| Small time deposits | .59 | -.70 | 7.24 | -7.21 | -4.85 | -6.67 | 1.61 | 12.90 | 16.97 | 18.00 | 1,031 |
| Managed liabilities1 | 9.45 | 15.55 | 8.79 | -2.71 | 5.38 | 7.09 | 12.07 | 12.26 | 19.45 | 16.58 | 4,550 |
| Large time deposits | 9.14 | 14.24 | 19.39 | -3.64 | 5.18 | 1.84 | 21.89 | 23.00 | 15.95 | 1.92 | 1,024 |
| Deposits booked in foreign offices | 8.71 | 14.60 | 7.84 | -10.92 | 4.49 | 12.63 | 16.84 | 6.32 | 29.67 | 25.86 | 1,502 |
| Subordinated notes and debentures | 17.00 | 5.07 | 13.98 | 9.56 | -.59 | 5.08 | 10.49 | 11.42 | 22.60 | 16.83 | 174 |
| Gross federal funds purchased and RPs | 4.38 | 1.57 | 6.49 | 5.74 | 12.76 | -8.70 | 8.40 | 15.62 | 9.47 | 7.06 | 744 |
| Other managed liabilities | 15.66 | 35.29 | 1.80 | -.28 | 1.00 | 22.11 | 1.37 | 6.15 | 18.89 | 28.44 | 1,106 |
| Revaluation losses held in trading accounts | 3.44 | -13.20 | 7.47 | -17.06 | 33.44 | 14.02 | -12.61 | -17.86 | 6.89 | 42.20 | 205 |
| Other | 12.74 | -1.25 | 20.63 | 14.92 | 5.24 | 5.30 | 17.19 | -.82 | 22.34 | 3.35 | 465 |
| Capital account | 9.58 | 3.92 | 10.68 | 12.32 | 7.87 | 6.69 | 23.15 | 7.73 | 14.69 | 10.96 | 1,136 |
| MEMO | |||||||||||
| Commercial real estate loans2 | 11.40 | 15.52 | 12.19 | 13.11 | 6.86 | 9.02 | 13.97 | 16.87 | 14.91 | 9.21 | 1,578 |
| Mortgage-backed securities | 22.14 | -3.33 | 3.30 | 29.06 | 15.60 | 10.14 | 13.45 | 2.07 | 10.22 | -1.24 | 960 |
| Federal Home Loan Bank advances | n.a. | n.a. | n.a. | n.a. | 17.30 | 3.71 | 3.74 | 10.00 | 29.80 | 30.62 | 455 |
Note: Data are from year-end to year-end and are as of April 16, 2008.
1. Measured as the sum of large time deposits in domestic offices, deposits booked in foreign offices, subordinated notes and debentures, federal funds purchased and securities sold under repurchase agreements, Federal Home Loan Bank advances, and other borrowed money. Return to table
2. Measured as the sum of construction and land development loans secured by real estate; real estate loans secured by nonfarm nonresidential properties or by multifamily residential properties; and loans to finance commercial real estate, construction, and land development activities not secured by real estate. Return to table
n.a. Not available.
MMDA Money market deposit account.
RP Repurchase agreement.
On the liability side of the balance sheet, growth of core deposits remained moderate. In the autumn, banks attracted small time deposits by maintaining relatively high rates, on average, on such deposits while other short-term yields were falling, but these inflows were partly offset by the continued sluggish growth of savings deposits (including money market deposit accounts). Given the relatively rapid growth in assets, banks turned to managed liabilities for funding. Moreover, in response to the pressures in funding markets, banks increased their reliance on FHLB advances and subordinated debt late in the year.
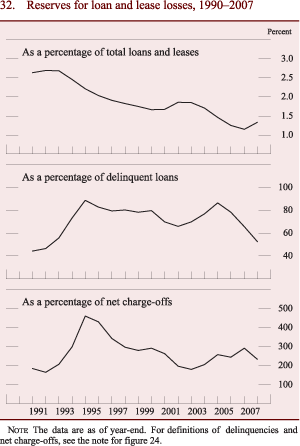
Banks' capital expanded at about the same pace as assets. The rise in equity capital was supported by increased goodwill but was hampered by meager retained earnings. Regulatory capital, which excludes goodwill, grew somewhat more slowly than equity capital and assets, and regulatory capital ratios edged lower. A number of large institutions received sizable cash injections from their parent holding companies, which helped maintain capital ratios. As asset quality deteriorated late in the year, many banks significantly boosted loan-loss reserves.
Loans to Businesses
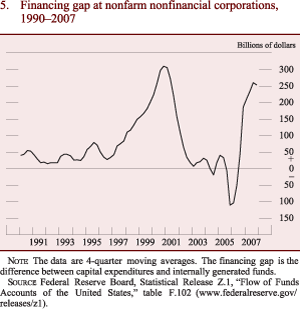
C&I loans grew 20 percent during 2007. For most of the year, this growth was supported by robust fixed investment and merger and acquisition (M&A) activity at nonfinancial corporations. Solid growth of capital expenditures contributed to a large financing gap, especially as corporate profit growth slowed late in the year (figure 5).
d
As conditions in credit markets tightened, the pace of capital accumulation and new borrowing slowed. Meanwhile, with conditions in the syndicated loan market also deteriorating, some large banks were forced to retain on their balance sheets a considerable amount of loans that were originally intended for syndication, many of which were extended to finance LBOs (see box "Market for U.S. Leveraged Syndicated Loans"). As the economic outlook weakened and banks tightened their credit standards, commercial real estate (CRE) lending, particularly for construction and land development, slowed somewhat from the rapid growth of recent years.
Market for U.S. Leveraged Syndicated Loans
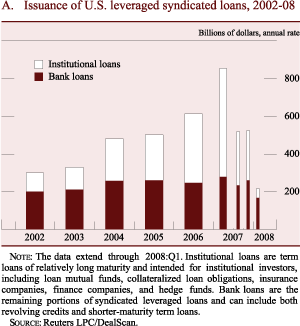
The market for U.S. leveraged syndicated loans was significantly affected by the disruptions in credit markets that first emerged in the summer of 2007. Although issuance of leveraged loans posted a record of nearly $700�billion last year, reflecting a surge in merger and acquisition (M&A) activity and leveraged buyouts (LBOs), the bulk of the deals were struck in the first half of the year, with activity slowing significantly over the second half.1
During the first and second quarters of 2007, issuance of leveraged loans soared to an annualized rate of nearly $860 billion, an increase fueled by strong M&A activity and an unprecedented wave of large LBOs (figure A). Institutional investors represented an important source of funding for these deals: Issuance of institutional loans--that is, leveraged loans structured for institutional investors--topped $290�billion and accounted for a record share of leveraged lending.2 Against a backdrop of stronger demand from institutional investors and improved liquidity in the secondary market, loan credit spreads continued to narrow over the first half of the year. Nonprice terms were also eased, with issuance of "covenant lite" loans and second-lien loans surging to record highs.3
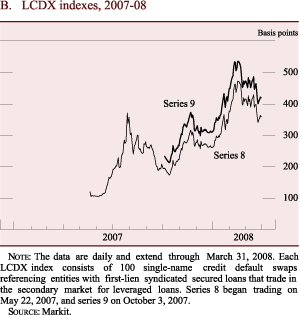
Early last summer, however, investors began pulling back from the leveraged loan market, apparently in response to concerns about the accommodative terms on, and the very substantial actual and anticipated volumes of, large LBOs. As a result, the flow of new deals slowed noticeably, but the pipeline of leveraged deals that banks had reportedly underwritten but not yet syndicated swelled to about $250�billion from roughly $110�billion at the start of the year. In the secondary market, a drop in average bid prices on leveraged loans and a worsening of liquidity pushed the average bid-asked spread substantially higher. Meanwhile, the implied spread on the LCDX index--an equally weighted index of 100 loan-only credit default swaps--rose sharply; the spread was allegedly boosted by investors positioning themselves to profit from a deterioration in credit quality as well as by strong hedging demand from both arrangers of collateralized loan obligations (CLOs) and market participants with exposure to the pipeline of leveraged deals (figure B).4
In August, as strains emerged in term bank funding markets, conditions in the leveraged loan market deteriorated further. Several loan issues were postponed or restructured in response to investors' demands for wider spreads and tighter nonprice terms. Spreads on lower-rated tranches of CLOs widened considerably, and issuance slowed markedly, developments that reportedly reflected investors' increased uncertainty about the appropriate valuation of structured finance products used to fund business credits. Because CLO vehicles had been the largest buyers of leveraged loans in recent years, banks faced severe difficulties syndicating previously underwritten loans used to finance large LBOs and were subsequently forced to bring a number of such loans onto their books. As conditions in corporate credit markets improved for a time in the fall, underwriters were successful in some cases at reducing their exposures by selling loans to investors, although often at prices well below par. All told, leveraged loan issuance slowed sharply in the second half of 2007, as institutional lending tumbled more than 50�percent from the level of the previous six months, to about $140 billion.
Pressures in the leveraged syndicated loan market have continued so far this year, and activity has remained subdued. Financial market dislocations eased somewhat in January, but they subsequently intensified again. In addition, the financial market pressures and the ongoing decline in the housing sector led investors to mark down their outlook for economic activity. As concerns about the effect of slower growth on credit quality mounted and as some leveraged investors were reported to have unwound their positions, average bid prices on leveraged loans plunged, and the implied LCDX spread widened sharply. Loan market liquidity was reportedly poor, and the average bid-asked spread widened to a level well above the peak reached in the summer of 2007. Since mid-March 2008, conditions in financial markets appear to have improved somewhat, and loan prices have reversed some of their earlier declines. Nonetheless, only $54 billion of leveraged loans cleared the primary market in the first quarter of 2008, down from the $209 billion syndicated a year ago. Also as of the first quarter, issuance of institutional loans, at about $12 billion, dropped more than 90�percent from its year-earlier level.
1. Financial firms account for only a small share of funds raised in the leveraged loan market.
Return to text
2. Institutional investors include a wide range of nonbank lenders, such as loan mutual funds, issuers of collateralized loan obligations, insurance companies, finance companies, hedge funds, and distressed and high-yield funds.
Return to text
3. According to Standard & Poor's, covenant-lite loans are loans that have bond-like financial incurrence covenants, which merely limit the issuance of additional debt, rather than the more restrictive maintenance covenants that have traditionally been part of a syndicated loan agreement. For more information, see Standard & Poor's (2007), A Guide to the Loan Market (New York: S&P, October).
As their name implies, second-lien loans are loans whose claims on collateral are behind those of first-lien loans.Return to text
4. A loan-only credit default swap (LCDS) is similar to a standard credit default swap. The main difference is that the reference obligation for an LCDS is a syndicated secured loan of a reference entity with a designated priority (for example, first lien or second lien).
Return to text
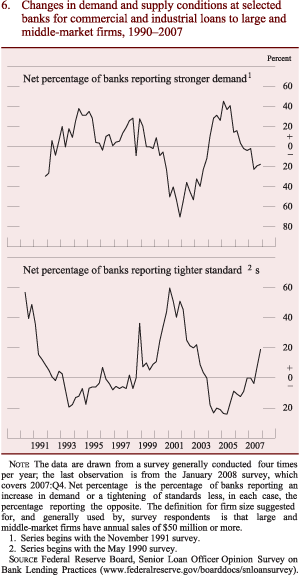
According to respondents to the Federal Reserve's quarterly Senior Loan Officer Opinion Survey on Bank Lending Practices (BLPS), demand for C&I loans softened steadily throughout the year as the economic outlook deteriorated (figure 6). Banks that experienced weaker C&I loan demand generally pointed to decreased needs by businesses to finance M&A activity and to fund investments in inventories and in plant and equipment. Despite the reported weakening in demand for C&I loans, growth in such loans was evident at commercial banks of all sizes, although it was particularly concentrated among the largest institutions, which are the most active participants in the syndicated loan market.4 Meanwhile, some firms drew upon previously arranged backup lines of credit with commercial banks as debt markets tightened, a move that further boosted the volume of C&I loans on banks' balance sheets.
In light of the rapid growth of syndicated lending, and the considerable extent to which such lending was used to finance large LBOs and M&A activity, the July 2007 BLPS queried banks about their participation in the syndicated loan market. About one-half of domestic respondents indicated that syndicated loans accounted for 5 percent to 20 percent of the C&I loans on their books, but a few large institutions noted that syndicated loans accounted for more than 50 percent of their C&I loan portfolios. Most survey participants indicated that only a small fraction of the syndicated loans on their books were originated to finance LBOs. Indeed, nearly two-thirds noted that LBO-related syndicated loans accounted for less than 5 percent of the syndicated loans on their books, which probably reflected the concentration of this activity within a few large banks and the tendency of these banks to place large portions of LBO-related syndications with institutional investors.
The accumulation of previously underwritten C&I loans may have been offset to some degree by a growing reluctance to make new C&I loans in the second half of the year. In the first- and second-quarter BLPS, a majority of banks reported no change in their underwriting standards for C&I loans. However, as concerns about financial market conditions mounted and the allocation of syndicated loans to investors became difficult during the second half of 2007, significant net fractions of respondents tightened their credit standards and terms on C&I loans.
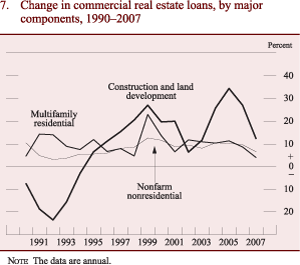
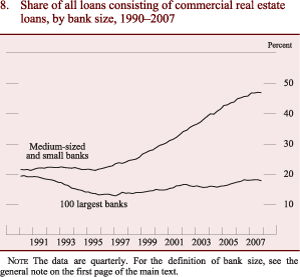
CRE loans expanded 9.2 percent last year, down from the very rapid rates posted over the previous three years. The slowdown was widespread but was somewhat more pronounced at the largest institutions. For 2007 as a whole, CRE lending was supported by growth of construction and land development loans, which accounted for more than one-third of all CRE loans at the end of the year (figure 7). However, the growth in this category of CRE loans, which includes loans to residential real estate developers, slowed in the second half of 2007 along with housing market activity. Real estate loans backed by nonfarm nonresidential structures, the largest category of CRE loans, grew at a pace somewhat below its recent average, and CRE loans secured by multifamily dwellings also expanded somewhat more slowly than in 2006. Smaller banks maintained the relatively high concentrations of CRE lending that they had built over the past two decades (figure 8).5
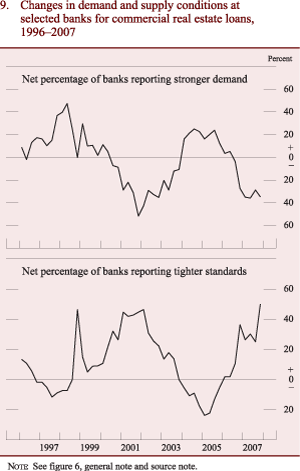
The lower growth rate of CRE loans in 2007 appears to have reflected a moderation in demand and a reduction in supply, trends that began in 2006 but accelerated last year (figure 9).
Banks responding to the BLPS indicated that demand for CRE loans weakened steadily throughout 2007. On the supply side, a notable fraction of survey respondents reported a tightening in their credit standards for CRE loans over the period. Terms on CRE loans were also tightened, with many banks requiring higher loan-to-value and debt-service-coverage ratios. The move toward a more stringent lending posture was likely due, in part, to the effect of the softening economic outlook on the expected credit performance of CRE loans. In addition, banks may have been concerned about deteriorating conditions in the market for commercial mortgage-backed securities (CMBS). Amid the broad reassessment of the risks associated with structured financial products, investors in CMBS retreated from the market, spreads moved significantly higher, and issuance dried up.
Loans to Households
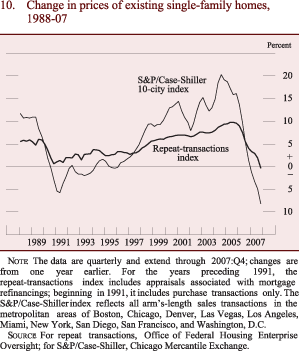
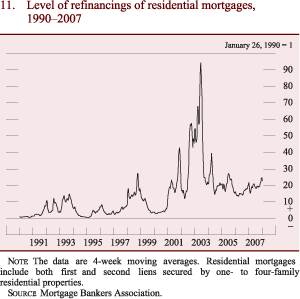
Pressures in the housing market, including outright declines in home prices in some areas, continued to affect bank lending to households last year (figure 10). In response to the easing of monetary policy that started in September, mortgage rates moved down over the remainder of 2007, and refinancing activity increased somewhat (figure 11). Nevertheless, the severe drop in home sales weighed on residential mortgage lending, and turmoil in credit markets during the second half of 2007 impaired securitizations of nonconforming mortgages. Overall, the value of mortgages on banks' books grew just 5.5 percent last year; excluding the aforementioned conversion of a large bank to a thrift charter, the growth rate was 9.3 percent, still the lowest rate of increase since 2001.
The slowdown in residential real estate lending stemmed from both weaker demand and tighter credit standards. In the BLPS survey conducted during the first quarter of 2007, considerable net shares of respondents reported reduced demand for residential mortgages.6 Beginning in the second quarter, banks were asked to report separately on changes in demand and credit standards for prime, nontraditional, and subprime mortgages. In the year's remaining surveys, large net percentages of banks reported weaker demand in all three loan categories and indicated that they had tightened their credit standards for all three types of residential mortgages. Not surprisingly, the tightening was especially pronounced for nontraditional and subprime products, although only a small number of banks reported that they originated subprime loans during that period.
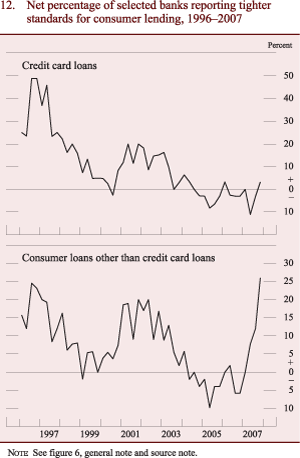
In contrast, consumer loans on banks' books expanded 11.7 percent in 2007, almost double the pace in 2006. Credit card loans grew 10 percent overall, but growth was faster at large institutions, where such lending is concentrated. Growth in other consumer lending was even more rapid. The pickup in consumer lending in the past two years might reflect, in part, a substitution away from cash-out refinancing, as softer home prices have made such refinancing a less viable option for some households. Nevertheless, most banks surveyed in the BLPS reported a weakening of demand for consumer credit in 2007. In addition, as the outlook for household credit quality deteriorated, banks significantly tightened their lending standards for non-credit-card consumer loans (figure 12). According to the BLPS, the net percentage of banks reporting tighter standards for such loans reached its highest level on record in the fourth quarter. In contrast, standards and terms for credit card loans changed little, on net, during 2007.
Other Loans and Leases
Other loans and leases grew 13 percent during 2007. Lending to state and local governments grew robustly again in 2007, perhaps because of continued strong growth in construction activity. Agricultural loans expanded at a pace slightly below that of the preceding two years, as originations in this category ticked down for most loan purposes.7 The remaining components of other loans, such as lease financing receivables and loans to purchase and carry securities, were about flat last year.
Securities
After growing at an average rate of about 10 percent over the previous five years, overall holdings of securities at commercial banks rose just 4.6 percent last year. Growth in securities was particularly weak in the second half of 2007, an indication that the slowdown likely resulted, in part, from banks' efforts to offset rapid growth elsewhere on their balance sheets. At the same time, banks shifted securities out of investment accounts and into trading accounts; some of that shift is traceable to a few large institutions that adopted new rules on fair value accounting, which led to the reclassification of certain types of securities (see box "New Rules on Fair Value Accounting"). Holdings of investment account securities declined 4.4 percent, as banks of all sizes sold government-backed mortgage pools and collateralized mortgage obligations. In contrast, holdings of private mortgage-backed securities in investment accounts rose during the year. Holdings of Treasury securities declined again in 2007, ending the year at just 2 percent of banks' investment accounts. Banks' holdings of securities issued by state and local governments kept pace with overall asset growth, although such securities ran off late in the year amid concerns that the private guarantors of municipal securities held exposures to subprime mortgage-backed assets that imperiled their AAA ratings.
New Rules on Fair Value Accounting
Statement of Financial Accounting Standards (FAS) No. 159, finalized by the Financial Accounting Standards Board in 2007, provides an option to elect a fair value measurement for most financial assets and liabilities.1 The election of the fair value option (FVO) applies on an instrument-by-instrument basis, is generally restricted to use at the inception of a financial instrument (for example, on the purchase date, on the origination date, or after a business combination), and is irrevocable. Although this standard did not become effective until 2008, banks were able to adopt the FVO earlier (starting with their March 2007 financial statements), provided that they were also early adopters of FAS 157, which establishes the rules governing fair value measurement.2 The FVO standard permitted a one-time application of fair value accounting to existing assets and liabilities, with the effect of the remeasurement reported in retained earnings and not in net income.
The new rules had two possibly significant effects on bank balance sheets. First, business and residential real estate loans previously held at amortized cost could be revalued pursuant to an FVO election. Second, securities to which the FVO was applied were required to be reclassified from available-for-sale or held-to-maturity accounts to trading accounts. Because losses from the revaluation of these securities are not reported in current earnings, some banks may have had an incentive to reclassify large portions of their securities portfolios upon adopting the FVO.
The overall effect of the FVO on bank balance sheets has been limited thus far. Fewer than 150 banks filed schedule RC-Q of the Call Report, which is required for FVO adopters, on the March 2007 reporting date, and the number of banks continuing to file this schedule declined through the remainder of the year (table A). Among these banks, the application of the fair
value option has been limited. Although some banks elected the FVO for a portion of their existing loan portfolio, the amount was small relative to total loans outstanding, and few new loans have reportedly been placed under the FVO. Indeed, as of the end of the year, loans and leases reported at fair value accounted for less than 2�percent of all loans and leases. The bulk of these assets consisted of residential real estate loans intended to be securitized at a few large banks.
The effect of the FVO on some banks' securities portfolios was somewhat more pronounced. In the first quarter of last year, trading accounts at commercial banks increased $70�billion, in part because some early adopters took advantage of the FVO and reclassified assets into these accounts. At year-end, 85�percent of all trading assets were held by banks reporting on schedule RC-Q, although, again, most of the amount was concentrated in a handful of large institutions.
1. More-narrow fair value options are available in FAS 155, Accounting for Certain Hybrid Financial Instruments--An Amendment of FASB Statements No. 133 and 140, and FAS 156, Accounting for Servicing of Financial Assets--An Amendment of FASB Statement No. 140. Return to text
2. Among other innovations, FAS 157 implements a three-tiered hierarchy for measuring fair value; an asset's classification depends on the relative reliability of the inputs to the measurement, based on their observability. Return to text
Liabilities
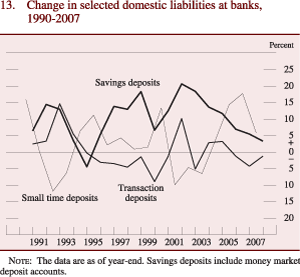
Bank liabilities increased 10.8 percent in 2007, an advance matching that in bank assets. Core deposits grew only 3.2 percent, the slowest rate since 1999, and transaction deposits contracted for the third consecutive year.8 The rate of expansion of savings and money market deposit accounts slowed despite the decline in short-term market interest rates, which lowered the opportunity cost of holding liquid deposits, over the second half of the year (figure 13). Small time deposits grew
somewhat faster than savings accounts; aggressive bidding for them by banks held their yields steady even as other short-term rates declined in the fall. Core deposits are generally a more important funding source for smaller banks than for larger institutions, but core deposit growth was essentially zero for banks below the top 100 in 2007.
To compensate for the lackluster growth of core deposits, banks--especially the largest institutions--continued to ramp up their managed liabilities. Those funding sources accounted for 41 percent of the liabilities of all banks at year-end, up dramatically over the past decade. Given the deterioration in interbank markets late in the year, growth in managed liabilities was due primarily to the expansion of nonbank deposits booked in foreign offices (the largest component of managed liabilities) and to FHLB advances, which grew 42 percent at the 10 largest banks. Although growth in FHLB advances was lower at medium-sized banks, those banks now use advances to fund more than 5 percent of their assets. Large time deposits expanded 13 percent, primarily in the second half of the year.
Capital
Equity capital held by commercial banks expanded 11 percent in 2007, about in line with asset growth. Retained earnings slipped to just 0.2 percent of assets, the lowest level since 1991. However, mergers and acquisitions boosted goodwill, leading to a rise in capital. In addition, parent holding companies injected about $40 billion into their commercial bank subsidiaries in 2007, mostly late in the year, to bolster capital positions in view of the pronounced deterioration in asset quality and the C&I-fueled expansion of loan portfolios. About 60 percent of the volume of transfers from parent holding companies was attributable to one large commercial bank.
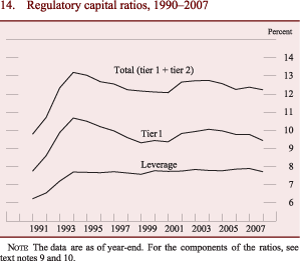
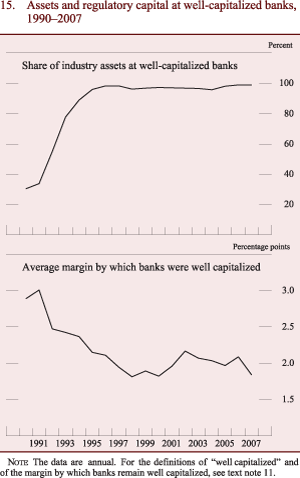
Growth of regulatory capital generally slowed last year (figure 14). Tier 1 capital grew 7.1 percent. The gain of 9.7 percent in total regulatory capital reflected a 20 percent increase in tier 2 capital. The rise in tier 2 capital, in turn, was attributable in part to higher loan-loss reserves, as banks boosted provisioning in the second half of the year.9 Risk-weighted assets expanded 10.8 percent, a rate in line with that for total assets. As a result, the industry's tier 1 and total capital ratios ended the year a bit lower than they were a year earlier. The regulatory leverage ratio, which is based on tier 1 capital and tangible average assets, also edged down.10 Nevertheless, the share of assets at well-capitalized banks remained above 99 percent in 2007, although the average margin by which banks remained well capitalized slipped to 1.84 percent, at the lower end of the range over which it has fluctuated during the past decade (figure 15).11
Derivatives and Off-Balance-Sheet Items
The notional principal amount of derivative contracts held by banks rose 26 percent last year, to more than $160 trillion (table 2). Even though the notional value of derivative contracts grew at banks of all sizes, the share of industry contracts at the 10 largest banks has continued to edge higher and stood above 98 percent at the end of the year. The considerable concentration mostly reflects the role that some of the largest banks play as dealers in the derivatives markets. As dealers, these banks often enter into offsetting positions, which significantly boost the notional value of their derivative contracts. The fair market value of derivative contracts held by banks reflects the contracts' replacement cost and is far smaller than the notional principal amount. The fair market values of contracts with positive and negative values in 2007 were both about $1.9 trillion, representing increases of about 60 percent over the year.12 The growth stemmed primarily from changes in the values of credit derivatives at large institutions.
| Percent | |||||||
| Item | 2002 | 2003 | 2004 | 2005 | 2006 | 2007 | MEMO Dec. 2007 (billions of dollars) |
|---|---|---|---|---|---|---|---|
| Total derivatives | |||||||
| Notional amount | 24.14 | 26.54 | 23.69 | 15.38 | 29.75 | 25.76 | 166,190 |
| Fair value | |||||||
| Positive | 85.41 | .36 | 13.71 | -6.46 | -4.50 | 57.78 | 1,902 |
| Negative | 89.18 | 1.00 | 13.75 | -5.78 | -4.27 | 56.63 | 1,869 |
| Interest rate derivatives | |||||||
| Notional amount | 26.83 | 27.62 | 22.07 | 11.92 | 27.11 | 20.63 | 129,560 |
| Fair value | |||||||
| Positive | 108.20 | -5.95 | 13.14 | -5.52 | -14.55 | 42.22 | 1,194 |
| Negative | 113.02 | -5.07 | 12.94 | -5.15 | -15.06 | 42.12 | 1,160 |
| Exchange rate derivatives | |||||||
| Notional amount | 7.34 | 18.81 | 21.03 | 7.69 | 29.27 | 36.69 | 17,174 |
| Fair value | |||||||
| Positive | 8.67 | 41.81 | 14.86 | -35.84 | 22.86 | 44.38 | 260 |
| Negative | 15.73 | 38.81 | 12.74 | -37.36 | 21.39 | 45.02 | 254 |
| Credit derivatives | |||||||
| Notional amount | 52.47 | 55.98 | 134.52 | 148.09 | 54.93 | 75.87 | 15,863 |
| Guarantor | 38.57 | 61.82 | 139.07 | 137.87 | 67.69 | 73.99 | 7,823 |
| Beneficiary | 66.36 | 51.13 | 130.46 | 157.53 | 44.03 | 77.74 | 8,040 |
| Fair value | |||||||
| Guarantor | n.a. | 68.31 | 69.92 | 81.43 | 92.96 | 295.25 | 274 |
| Positive | n.a. | 378.09 | 74.56 | -5.62 | 201.40 | -38.79 | 31 |
| Negative | n.a. | -68.87 | 38.37 | 827.98 | -1.59 | 1,187.41 | 243 |
| Beneficiary | n.a. | 19.85 | 51.28 | 83.50 | 90.26 | 301.20 | 312 |
| Positive | n.a. | -63.13 | 2.64 | 505.51 | 3.98 | 1,086.95 | 267 |
| Negative | n.a. | 295.74 | 66.36 | 2.79 | 187.44 | -18.95 | 45 |
| Other derivatives1 | |||||||
| Notional amount | 6.70 | 3.77 | 32.66 | 29.43 | 75.17 | 13.60 | 3,593 |
| Fair value | |||||||
| Positive | 20.28 | 3.16 | 8.55 | 58.51 | 18.99 | 32.76 | 150 |
| Negative | 24.62 | -5.25 | 19.73 | 74.29 | 24.15 | 30.67 | 167 |
Note: Data are from year-end to year-end and are as of April 16, 2008.
1. Other derivatives consist of equity and commodity derivatives and other contracts. Return to table
n.a. Not available.
One important way for banks to hedge interest rate risk, including that related to interest-sensitive assets such as mortgages and mortgage-backed securities, is through the use of interest rate swaps.13 Those swaps are the most common type of derivative used by banks and account for about two-thirds of the notional value of banks' derivative contracts, although most of the swaps are held for trading and market-making purposes rather than for hedging. The notional value of interest rate swaps increased 27 percent in 2007, which is about the average pace over the past decade. Other types of interest rate derivative contracts employed by banks include futures, forwards, and options. The notional value of these other derivative contracts also expanded at a brisk rate last year. Despite the growth in interest rate derivative contracts, their share of total derivative contracts dropped 3 percentage points, to 78 percent.
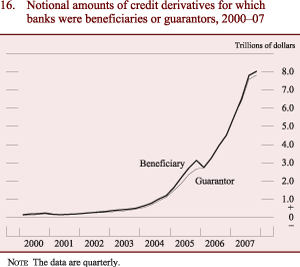
One of the fastest growing components of banks' derivative portfolios in recent years has been credit derivatives. The notional value of such derivatives at banks jumped 76 percent in 2007, a rate of increase somewhat faster than that in 2006. Increasingly, banks are participating in the credit derivatives market by using credit default swaps written on loan contracts rather than on corporate bonds. Amid the financial turmoil in the second half of the year, the market prices of many credit derivative contracts changed so dramatically that their fair value more than doubled at many large banks. The concentration in this market was even more apparent than in other derivatives markets, as the 10 largest banks held more than 99 percent of the notional value of all the industry's credit derivative contracts at the end of 2007. As dealers, the 10 largest banks are beneficiaries of protection when they buy contracts and providers of protection (guarantors) when they sell. Banks are typically net beneficiaries of protection; as of year-end, contracts in which banks were beneficiaries of protection totaled $8.0 trillion, and contracts in which they were guarantors totaled $7.8 trillion (figure 16).
Banks also use derivatives related to foreign exchange, equities, and commodities. Collectively, however, those instruments account for only 13.6 percent of the notional value of the derivative contracts held by banks. The notional value of banks' foreign-exchange-related contracts grew 37 percent in 2007, considerably faster than in previous years. Bank customers likely increased their hedging activity in light of sharp exchange rate movements last year. Banks' notional holdings of equity and commodity derivatives rose 14 percent in 2007.
Unused commitments at commercial banks grew slightly more slowly than assets in 2007. Lines of credit secured by one- to four-family residential properties grew just 5.8 percent amid the deterioration in the housing market, and commitments to fund CRE loans were flat. Credit card lines increased about 10 percent, and letters of credit rose about 8 percent. The category "other unused commitments," which consists primarily of lines to businesses, grew 11 percent over the year as a whole but contracted in the fourth quarter.
Trends in Profitability
After many years of high earnings, the commercial banking industry posted significantly lower profits in 2007. Industrywide net income contracted more than 20 percent, primarily because of a sharp drop in trading revenue and much higher provisions for loan losses in response to deterioration in asset quality. Return on equity (ROE) for the full year fell to less than 10 percent from more than 13 percent in recent years. Banks' return on assets (ROA) also declined markedly last year, to less than 1 percent, its lowest level since the early 1990s. The sector's profitability--which had weakened somewhat in the first half of the year--dropped sharply in the second half. In the fourth quarter, ROE tumbled to around 4 percent and ROA to 0.4 percent.
The decrease in profitability was most pronounced among the largest commercial banks, but ROA and ROE decreased considerably for all bank-size groups. In the fourth quarter, some of the largest commercial banks posted substantial losses that reportedly resulted mainly from write-downs of the value of mortgage-related assets and other structured investment products; however, almost all of those banks remained profitable for the year as a whole.14 Overall, the fraction of banks that incurred losses in 2007 increased notably, to about 10 percent, and those institutions accounted for about 3 percent of industry assets, the highest share since 2000.
Net interest margins of commercial banks slipped further in 2007. Over the first half of the year, spreads reportedly were compressed by price competition in business and mortgage lending. With financial markets and institutions under pressure in the second half of the year, interest rate spreads over market reference rates on many types of bank loans widened. Banks were unable to benefit fully from those developments because spreads on many types of bank funding, especially term funding in wholesale markets, increased well above their levels in recent years. The unexpected growth of their balance sheets in the second half of 2007 also forced banks to rely more heavily on managed liabilities and small time deposits, sources of funds that tend to have higher average interest rates than liquid deposits.
A decline in non-interest income for the year--the first such dip in at least 40 years--contributed importantly to the lower profitability of banks in 2007. Non-interest income was 2.1 percent of average total assets last year, the lowest share since 1995. Large banks experienced a substantial decline in revenue from trading and loan sales, whereas smaller banks registered slower growth in other types of non-interest income. Non-interest expense grew rapidly again in 2007, and the increase was spread across a range of categories.
Profits in 2007 were also significantly reduced by a surge in loss provisions stemming from a slump in asset quality. Amid falling house prices and a slowing economy, the delinquency rate on residential mortgages held by banks climbed to about 3 percent at year-end, its highest rate in more than a decade. The delinquency rate on CRE loans doubled to 2.7 percent at year-end. That jump primarily reflected surging delinquencies on construction and land development loans, particularly those used to finance residential projects. Banks also recorded smaller but still noticeable increases in delinquency rates on consumer and C&I loans. Charge-off rates, which had been very low in each of the past several years, moved up along with delinquencies.
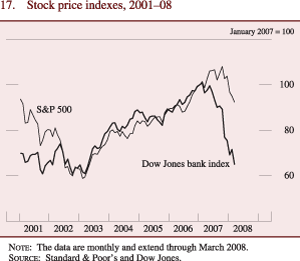
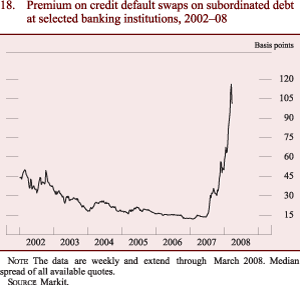
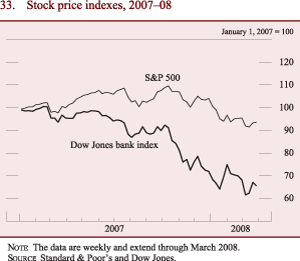
Despite the steep drop in profits, banks still increased dividends in 2007 after having raised them more than 25 percent in 2006. As a result, dividends absorbed much of last year's profits, and retained earnings contributed relatively little to capital. The erosion in profits as well as investors' concerns about banks' exposures to structured investment products, leveraged loans, and subprime mortgages precipitated a sharp decline in bank stock prices, which considerably underperformed the S&P 500 last year (figure 17). Similarly, premiums on credit default swaps on banks' subordinated debt widened sharply (figure 18).
Interest Income and Expense
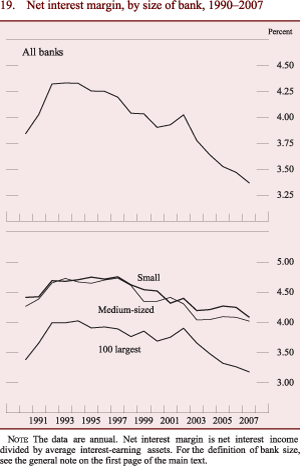
After increasing throughout 2006, the average interest rates earned on assets and paid on liabilities peaked around the beginning of 2007. Average interest rates on many of banks' assets and liabilities decreased late in the year, in part owing to the decline in market interest rates as the Federal Reserve eased the stance of monetary policy. However, this decline only partly reversed the run-up in 2006, and, as a result, average effective interest rates on banks' assets and liabilities were somewhat higher in 2007 than in 2006. The average interest rate earned increased somewhat less than the average rate paid, and the industrywide net interest margin declined 11 basis points in 2007, to 3.36 percent (figure 19).The decline represented a continuation of the longer-term downward trend in net interest margins evident since the mid-1990s.
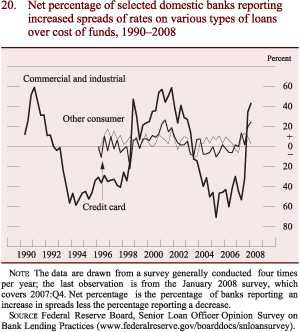
Particularly over the second half of the year, banks took steps that could help stem the decline in net interest margins. According to the BLPS for October 2007 and for January 2008, banks charged wider spreads on C&I loans relative to their cost of funds in the second half of last year--the first such increases in several years (figure 20). Similarly, about half the banks responding to a question in the January 2008 survey reported having increased spreads on CRE loans over the course of 2007 after they had reported narrowing spreads on such loans in 2006. Banks also reported that, on net, they widened spreads on consumer loans during 2007.
The average interest rate on bank assets in 2007 increased 13 basis points, to 6.78 percent. The rise mostly reflected higher average rates on trading account securities and on federal funds sold and reverse repurchase agreements. The measured returns for the latter category were boosted by elevated spreads in bank funding markets during the second half of the year. The average interest rate earned on loans and leases was little changed relative to 2006. After increasing throughout 2006, the average interest rate earned by banks on business loans held steady over much of 2007--at about the level that prevailed in the second half of 2006--and then decreased some late in the year. The November 2007 Survey of Terms of Business Lending, which measures the interest rate on new loan originations at a broad sample of banks, indicates that interest rates on new business loans fell significantly relative to earlier in the year. According to the survey, a majority of C&I loans have variable interest rates and are made under the terms of previously negotiated commitments; thus, their interest rates declined along with comparable-maturity market interest rates, and spreads on such loans remained quite low in the November survey. The average interest rate earned on consumer loans rose somewhat in 2007, to 10.2 percent. In contrast, the average effective interest rate on real estate loans declined during 2007 to a little less than 7 percent at year-end, a decrease that partly reflected the effects of lower market interest rates on the portion of banks' real estate portfolios that has variable interest rates.
Banks' increased reliance on managed liabilities, which generally pay higher interest rates than other funding instruments, contributed to a 23 basis point increase in the average interest rate paid on liabilities in 2007, to 3.82 percent. For 2007 as a whole, the interest rate on managed liabilities averaged 4.8 percent, a little higher than in 2006. Realized interest rates on the category called "other borrowed money," which includes FHLB advances, declined appreciably in 2007. In contrast, interest rates on large time deposits and on federal funds and repurchase agreements rose significantly between 2006 and 2007. Although the average effective interest rates paid by banks on those instruments moved down some late in the year as the Federal Open Market Committee eased policy, the spreads of those rates over various short-term market interest rates jumped in the third and fourth quarters of 2007 to fairly high levels.
After a large advance in 2006, average effective interest rates paid on core deposits increased somewhat further in 2007, to 2.81 percent. The increase reflected both higher rates paid on each type of deposit as well as the rapid growth of small time deposits, which, as noted earlier, generally pay higher interest rates than liquid deposits. The rate on savings deposits (including money market deposit accounts) averaged 2.22 percent last year, somewhat higher than in 2006. The average interest rate on small time deposits increased significantly to 4.72 percent in 2007, and it remained elevated at the end of the year even though interest rates on other money market instruments declined. Banks, particularly those experiencing unplanned expansions of their balance sheets or those leery of volatility in interbank funding markets, likely kept rates on small time deposits relatively high--and, as noted earlier, boosted spreads on large time deposits--to attract depositors.15
The downward pressure on banks' net interest margins last year was exacerbated by a decline in the share of bank assets funded by non-interest-bearing liabilities and capital.16 Because these instruments, by definition, have no explicit interest expense, the returns on the interest-earning assets that they fund help support banks' net interest margins.
Non-interest Income and Expense
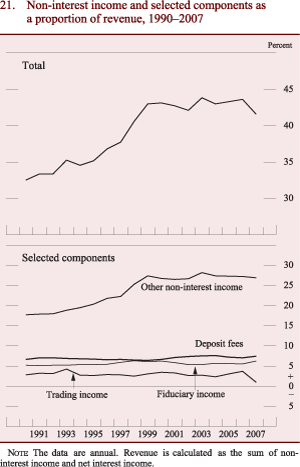
Total non-interest income dipped in 2007, marking the first time in at least 40 years that non-interest income contracted on an annual basis. As a result, total revenue of commercial banks, defined as net interest income plus non-interest income, edged up only 3.4 percent. The share of total revenue from non-interest income dropped to 42 percent, its lowest level since 1998 (figure 21). Non-interest expense grew at a faster clip in 2007 than it had in 2006, and it increased as a share of revenue to the upper end of its recent range.
In recent years, the growth of non-interest income has been concentrated among the largest banks, while smaller banks have seen this revenue source stagnate or decline. In 2007, non-interest income dropped at the largest banks and was flat to lower in most other bank-size categories. The softness in non-interest income at the largest banks last year primarily reflected steep declines in trading revenue at a few of those institutions. Banks reported almost $10 billion in net losses on the trading of credit exposures last year, which likely included some of the substantial write-downs of mortgage-related structured products as well as losses on collateralized debt obligations and credit derivatives associated with syndicated leveraged loans. Income from the trading of equity exposures also dropped considerably in the second half of the year, and trading revenue generated by other products--interest rate, foreign exchange, and commodities--weakened as well. In addition, several of the largest banks experienced losses or a steep drop in income from the sale of loans that were not held in their trading accounts, particularly in the second half of the year.
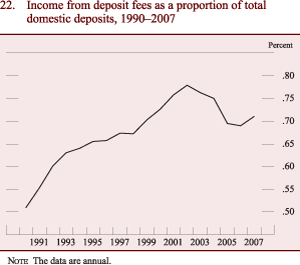
However, the difficulties were partly offset by strong growth in other categories of non-interest income at large banks. Revenue from investment banking services increased as banks profited from their role in financing robust M&A activity over much of 2007 and also benefited from high trading volumes, spurred by market volatility, in their wealth-management businesses. In a related area, several large institutions experienced jumps in income from fiduciary activities. Fees collected on deposit accounts also advanced briskly, outstripping the muted growth in deposits (figure 22).
The weakness in non-interest income at smaller banks was widespread across many business lines. Revenue from securitization activities and from loan-servicing operations declined, a development probably related, in part, to the problems in the residential mortgage markets. Income from subsidiaries and other affiliates also dropped considerably at some smaller banks; the decrease may have stemmed to some degree from reduced contributions from mortgage banking arms.
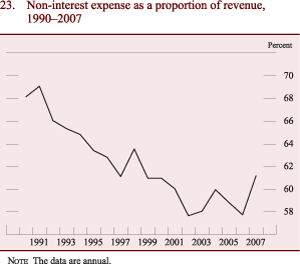
Non-interest expense rose 9 percent in 2007, somewhat faster than in 2006. That increase, combined with the sluggish growth in revenue, pushed non-interest expense to about 61 percent of total revenue, the top end of the range over the past 10 years (figure 23). Growth of employee compensation, which accounts for about 45 percent of non-interest expense, slowed in 2007. The easing in that category reflected both a reduced pace of net hiring as well as a slowdown in the growth of compensation per employee. The cost of premises and fixed assets rose modestly in 2007, about in line with recent annual increases. Other non-interest expense, which accounts for more than 40 percent of total non-interest expense, increased more than 10 percent last year. The category includes various intercompany transactions, such as payments to affiliates and to parent holding companies, which appear to have increased notably in 2007; it also includes expenses related to restructuring or mergers and the cost of amortization of goodwill and other intangible assets. The total of restructuring costs and amortization of intangible assets accounted for about 15 percent of the increase in non-interest expense.
Loan Performance and Loss Provisioning
Credit quality declined across all types of loans in 2007, and the overall delinquency rate at commercial banks rose to about 2.5 percent of total loans and leases at year-end, its highest level since early 2003. The aggregate charge-off rate also moved up, reaching an annual rate of 0.72 percent in the fourth quarter, but for the year as a whole it was only a little more than half its recent peak in 2002. The most significant deterioration occurred in banks' residential and commercial real estate portfolios; delinquencies and charge-offs on real estate loans rose to their highest levels in more than a decade. The erosion in the credit quality of real estate loans was somewhat concentrated within geographic areas that were experiencing below-average economic growth or declines in residential home prices (see box "Geographic Distribution of Delinquency Rates on Selected Loans Held by Small Banks"). Charge-offs and delinquencies on consumer loans also moved higher during 2007. The credit quality of C&I loans remained fairly strong but showed signs of slipping late in the year. The significant rise in nonperforming loans and the generally weaker economic outlook led banks to substantially boost loss provisioning in 2007.
Geographic Distribution of Delinquency Rates on Selected Loans Held by Small Banks
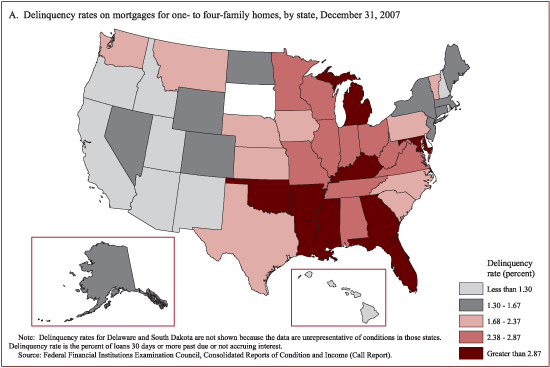
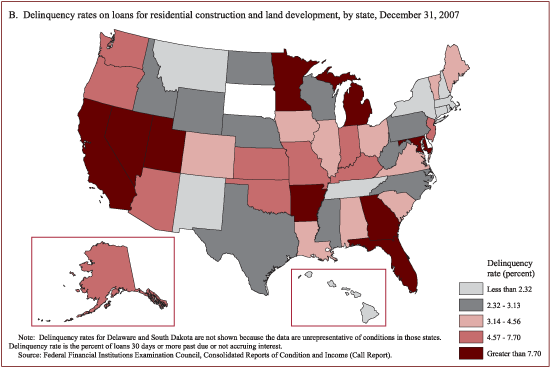
The geographic distribution of delinquency rates in national data on single-family mortgages has attracted considerable attention. This box analyzes, as of the end of 2007, the geographic distribution of delinquency rates at small banks for loan categories that experienced noticeable deterioration last year: residential real estate loans, construction and land development loans, and consumer loans. The analysis covers commercial banks with less than $2 billion in total assets: Because these banks likely extended the loans held on their balance sheets to businesses and households that are in relatively close proximity to their head offices, the location of a head office is a reasonably good proxy for loan location. Banks of that size held about 10 percent of the industry's residential mortgages and about 12 percent of consumer loans at the end of 2007. However, they held about one-third of all construction and land development loans.
The state-specific average delinquency rates on residential mortgages held by smaller commercial banks were generally highest in areas where economic growth had lagged the national average or where home prices had declined after several years of rapid increases (figure A). At the end of 2007, residential mortgage quality at small commercial banks with headquarters in Michigan or other states in the Great Lakes region was poor relative to that in other states. Delinquency rates on residential mortgages at small banks were also higher than average in Florida and many other states in the Southeast region. Many of those areas also experienced the largest increases in small-bank delinquency rates between year-end 2006 and the end of 2007. Those geographic patterns in small-bank delinquency rates were broadly similar to those for individual mortgage loans detailed in other sources.1 However, smaller banks with headquarters in California or other western states had low delinquency rates at the end of 2007 relative to such rates at smaller banks in other states, even though data for individual mortgage loans show significant rates of impairment in some of those western states. The divergence between individual delinquency rates and small-bank delinquency rates may reflect, in part, a decision by smaller banks in those states not to compete vigorously in the local residential mortgage markets during the housing boom. Indeed, smaller banks in those states had a relatively low concentration of residential mortgages on their books at the end of 2007, and several major thrifts and large banks that specialize in residential mortgages have headquarters in those areas.
Not surprisingly, the geographic distribution of state-specific average delinquency rates on residential construction and land development loans held by small banks is broadly similar to the distribution of such rates on troubled residential loans (figure B). Residential developers were probably affected most heavily in areas where housing markets were weakest, leaving them with high inventories of unsold homes and reduced revenues from the homes they did sell. For instance, high delinquency rates at small banks in the Midwest, Florida, and Georgia are common to both residential mortgages and residential construction loans. The overall state-level correlation between the small-bank delinquency rate on residential mortgages and that on residential construction loans was 0.54 at the end of 2007. The two geographic distributions differ notably in the western states, however. For example, smaller banks in California, Nevada, and Arizona have very high delinquency rates on residential construction loans but very low delinquency rates on residential mortgages. In contrast to the relatively low concentration of residential mortgages on the books of small banks in those states, the concentrations of residential construction loans held by such banks are generally higher than the average concentration of such loans at small banks across the country.
The relationship between the state-specific delinquency rate on other types of construction and land development loans (not shown) and that on residential construction loans is also fairly strong, with a correlation of 0.37 at the end of 2007. Such a relationship might be expected if returns on some projects financed by nonresidential construction and land development loans at small banks depended, in part, on the anticipated population growth reflected in residential construction and land development loans (for example, loans to finance the construction of retail establishments).
Households that have difficulty paying a mortgage may also have difficulty making timely payments on consumer loans. Indeed, earlier this decade, the correlation between the state-specific delinquency rates on those two types of loans was very high--an average of 0.77 between 2002 and 2005. The deterioration in the housing sector and tighter mortgage credit standards could also impair the credit quality of consumer loans if those developments reduce the ability of consumers to use equity from their homes to finance consumer spending or to pay off existing consumer loans. Nonetheless, the correlation between the state-specific delinquency rate on consumer loans (other than credit card loans) held by small banks and that on residential mortgages at those institutions dipped to 0.67 in 2006 and to 0.42 in 2007. The relative decoupling of delinquency rates on mortgage and consumer loans over the past two years may partly stem from differences in some states between the condition of the housing sector and that of the broader state economy. In addition, the changes in bankruptcy law enacted in 2005 may have temporarily depressed delinquency rates on consumer loans in 2006 and, likely to a lesser extent, in 2007, which may also have weakened the correlation.
1. For illustrations of a variety of mortgage loan conditions across the United States, see the set of dynamic maps and data provided by the Federal Reserve Bank of New York; or Ben S. Bernanke (2008), "Mortgage Delinquencies and Foreclosures," speech delivered at the Columbia Business School's 32nd annual dinner, New York, May 5. Return to text
C&I Loans
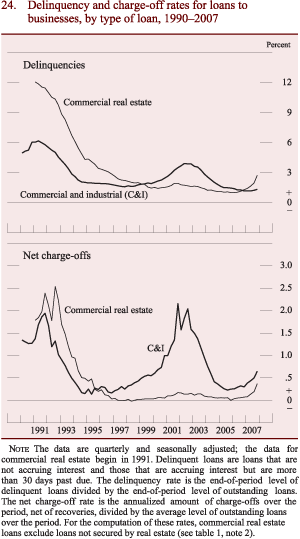
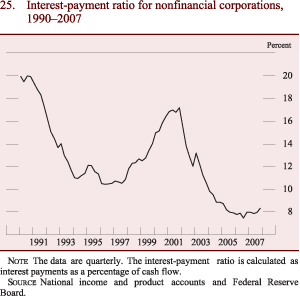
The delinquency rate on C&I loans edged up over the second half of 2007, but it remained at a low level (figure 24). The relatively strong performance of C&I loans throughout the year likely reflected continued strength in nonfinancial corporate profits and generally healthy corporate balance sheets; the interest-payment ratio for nonfinancial corporations remained quite modest last year (figure 25).
The default rate on corporate bonds also stayed low. Moreover, the rapid growth in C&I loans may have reduced delinquency rates temporarily because loans are presumably less likely to become delinquent soon after they are extended. Charge-offs of C&I loans picked up a fair bit in 2007, and in the fourth quarter they were about at their long-run average level. The rise in charge-offs mostly reflected deterioration among the portfolios of the largest banks. Respondents to the January 2008 BLPS expected the credit quality of C&I loans to weaken this year.
Commercial Real Estate Loans
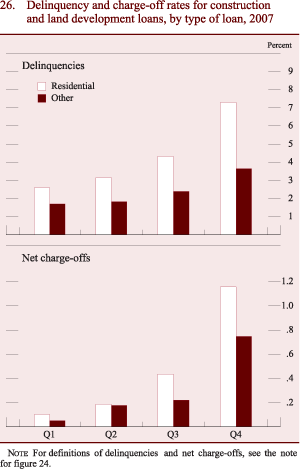
The rate of delinquency on CRE loans doubled in 2007, mostly because of a deterioration in the credit quality of construction and land development loans. In line with the problems in the housing sector, the delinquency rate on construction and land development loans that financed residential development nearly tripled between the first and fourth quarters of 2007, to 7.3 percent at year-end (figure 26). Moreover, the majority of the increase in this delinquency rate was attributable to loans put on non-accrual status, which means that the banks perceive a very low probability that the borrowers will resume making payments. Charge-off rates on those loans also rose considerably, from near zero in the first quarter to more than 1 percent at an annual rate in the fourth quarter of 2007. Other (nonresidential) construction and land development loans experienced marked increases in delinquency and charge-off rates as well, but the run-ups were somewhat less steep than in the residential construction sector.
The credit quality of other types of CRE loans also worsened in 2007, particularly that of loans for multifamily residential properties. The delinquency and charge-off rates on loans backed by nonfarm nonresidential properties (for example, office buildings) edged up but stayed within the very low ranges that have prevailed over the past decade. In part, the sustained strong performance in this sector reflected fundamentals--such as vacancy rates, rents, and prices--that remained solid through most of 2007. Nonetheless, by the end of the year, some of those fundamentals had begun to show signs of erosion: Vacancy rates edged up, rent growth slowed, and indicators of CRE prices slipped. The number of sales of commercial properties also slumped.
Loans to Households
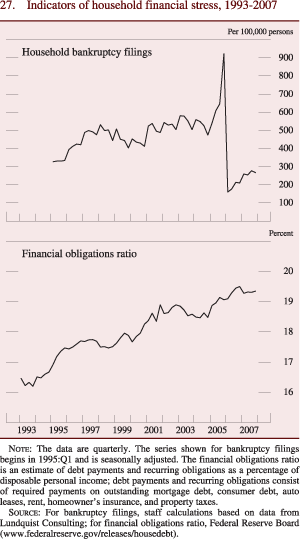
The credit quality of household loans weakened, on balance, in 2007, primarily because of a sharp increase in delinquencies and foreclosures on residential mortgages. The performance of credit card and other consumer loans also deteriorated. Household bankruptcy filings remained low relative to the levels seen before the changes in bankruptcy law implemented in late 2005, but the bankruptcy rate moved up a fair bit in 2007 (figure 27). The household financial obligations ratio remained near its record high reached in 2006, as slower growth in household debt last year was offset by a deceleration in disposable personal income.
Residential Real Estate Loans
Credit quality in the residential mortgage sector worsened sharply in 2007. The deterioration was partly rooted in the easing of underwriting standards around the middle of the decade--a shift in lending posture that was likely based to an extent on the assumption that house prices would continue to rise for some time to come. The easing of credit standards on mortgages reportedly was more pronounced at nonbank financial institutions than at commercial banks, in part because of different levels of regulation in those sectors. A historically large fraction of the loans originated in 2005 and 2006, particularly those to borrowers with weaker credit histories (subprime loans), had high loan-to-value ratios. Many subprime loans also had discounted introductory interest rates, which exposed borrowers to the potential for significantly higher mortgage payments after the initial rates on the loans reset, typically two to three years after origination.
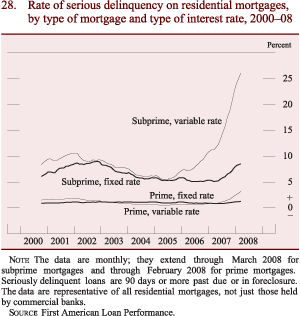
House prices generally decelerated in 2006, and in 2007 they declined in some areas of the country; consequently, many borrowers with high loan-to-value ratios were unable to build equity in their homes, making refinancing difficult. Moreover, large fractions of commercial banks tightened credit standards on residential mortgages in 2007--not only on subprime and nontraditional mortgages but also on loans to prime borrowers--which further impaired the ability of borrowers to refinance existing mortgages. Reflecting these developments, national data on variable-rate mortgage loans show that delinquency rates on such loans increased more than those on fixed-rate loans, especially for lower-rated borrowers (figure 28). All told, the delinquency rate on variable-rate subprime mortgages jumped to more than 20 percent in December of last year and has increased further in 2008.
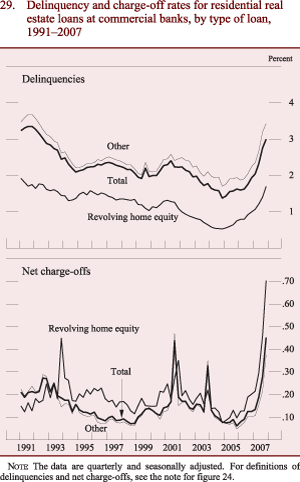
At commercial banks, delinquencies on residential real estate loans were around 3 percent by the end of 2007, their highest rate since the early 1990s and more than double their recent low posted in the fourth quarter of 2004 (figure 29). Charge-offs had increased to 0.44 percent at an annual rate in the fourth quarter of 2007, equal to the highest rate recorded since 1990. Delinquency and charge-off rates rose across all types of mortgage products and all bank sizes. Delinquency rates on closed-end one- to four-family mortgage loans and on revolving home equity loans rose substantially--to 3.6 percent on the closed-end mortgages (including both first and junior liens) and 1.7 percent on the revolving loans. Charge-off rates in the fourth quarter on closed-end mortgages quadrupled from the year-earlier quarter to 0.36 percent, and those on revolving loans rose from 0.19 percent at year-end 2006 to 0.69 percent in the fourth quarter of 2007. The delinquency rate on closed-end mortgages rose most sharply at the 100 largest banks--advancing about 1.5 percentage points, to 3.8 percent--but it also moved up 0.7 percentage points at smaller banks, to about 2.5 percent; the rise in charge-off rates was also somewhat greater at larger banks than at smaller banks.
The sharp increase in mortgage loan delinquencies and foreclosures over the past year--particularly for subprime borrowers--has created distress for many homeowners and communities. The Federal Reserve has taken a number of actions intended to help distressed subprime borrowers and limit preventable foreclosures, as well as other actions aimed at reducing the likelihood of such problems in the future.17 Moreover, avoiding foreclosure--even if it involves granting concessions to the borrower--can be an important loss-mitigation strategy for financial institutions. Most commercial banks responding to the January 2008 BLPS indicated that loan modifications based on individual borrowers' circumstances were an important part of their loss-mitigation strategies; many banks were also willing to refinance loans for some troubled borrowers. However, loans are often packaged and sold in securitized pools owned by a dispersed group of investors, which makes the task of coordinating renegotiation to avoid foreclosure among all affected parties difficult. In part to address the challenges in modifying securitized loans, a diverse group of mortgage market participants joined in a collaborative effort called the Hope Now Alliance to facilitate cross-industry solutions to the problem.18 About one-third of respondents to the January 2008 BLPS said that streamlined modifications such as those proposed by the Hope Now Alliance were important to their strategies for limiting losses.
Consumer Loans
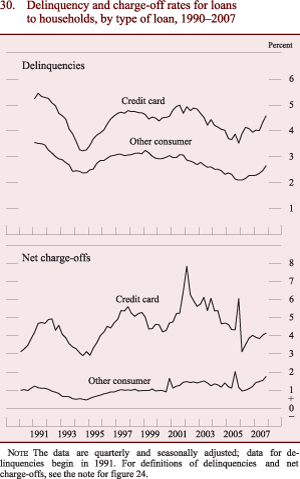
The delinquency rate on credit card loans held by banks rose a fair bit in 2007, especially in the second half of the year (figure 30). The charge-off rate on such loans fluctuated around 4 percent last year, a relatively low level compared with the rates that prevailed before the change in bankruptcy laws in 2005.19
d
The delinquency rate on other (non-credit-card) consumer loans also rose moderately but still remained around the midpoint of its range over the past 15 years. Charge-off rates on those loans climbed from about 1 percent in 2006 to 1.6 percent for 2007 as a whole, a considerable increase that brought the annual rate to its highest level in at least two decades. The weakening in the credit quality of consumer loans may have reflected, in part, the pressures on households generated by troubles in the residential mortgage sector and the slower pace of economic growth late in the year. Respondents to the BLPS expected further declines in the credit quality of both credit card and other consumer loans in 2008.
Securitized Loans
The credit quality of loans that were sold and securitized by banks that retained servicing rights or recourse or provided other credit enhancements to the securitization structure (hereafter referred to, for simplicity, as "securitized" loans) weakened in 2007, though not, in most cases, to the same extent as loans that were held on banks' balance sheets.20 The majority of loans securitized by banks are residential mortgages on one- to four-family homes (63 percent). The delinquency rate on those mortgages (excluding revolving home equity loans) was 3.7 percent in the fourth quarter of 2007, almost unchanged from its level at the end of 2006 and well below the levels seen earlier in the decade. Likewise, the delinquency rate on the small amount of securitized revolving home equity loans was little changed in 2007, though it fluctuated near the high end of its recent range. Charge-off rates on securitized residential mortgages also changed little and stayed well below the rates on residential loans on banks' books.
The relatively stable delinquency and charge-off rates on mortgages securitized by banks could be attributable to several factors. Banks as a group may not have securitized large quantities of subprime mortgages or other types of mortgages that have accounted for much of the run-up in overall mortgage delinquencies and foreclosures. Moreover, some securitization structures require that banks repurchase from the securitized pools those loans that become delinquent soon after origination, which could hold down losses on securitized loans and dilute the credit quality of loans held on banks' books.
The delinquency rate on securitized credit card loans--which make up 22 percent of the loans securitized by banks--moved up, from about 3.7 percent to just above 4 percent, in 2007, a rate that was still below the midpoint of its range over recent years. Charge-off rates on those loans continued to trend up last year but stayed well below the rates that prevailed as recently as 2005. The delinquency rate on securitized credit cards has been somewhat lower than that on credit cards held on banks' balance sheets, but charge-off rates on securitized loans have generally been higher than those on loans held by banks. Delinquency and charge-off rates on the small amount of bank-securitized auto loans jumped considerably in 2007 and ended the year near the highest levels recorded since the data became available in 2001. The credit quality of other types of securitized consumer loans was fairly stable in 2007; the delinquency rate on such loans edged higher, to about 5.4 percent, while the charge-off rate was generally lower in 2007 than it was in 2006.
The delinquency and charge-off rates on the small amount of securitized C&I loans rose considerably in the second half of 2007 but remained in the middle of their recent ranges. About $200 billion in other types of loans and leases, a category that includes CRE loans, are securitized by banks. The delinquency rate on that category of loans declined, on balance, in 2007 to just 0.2 percent, and the charge-off rate on those loans was near zero.
Loss Provisioning
The erosion of credit quality spurred banks to step up the rate of loss provisioning in 2007, particularly in the second half of the year. Loss provisioning subtracted 54 basis points from ROA and consumed more than 10 percent of total revenue in 2007, about double the effect in each of the previous two years (figure 31). By those measures, loss provisioning in 2007 was similar to that during the economic slowdown in the early part of this decade but well below the highs reached during the late 1980s and early 1990s. Provisioning increased most at large banks, where it reached an annual rate of more than 1 percent of average assets in the fourth quarter, compared with just about 0.36 percent in the fourth quarter of 2006. Nonetheless, the increase over 2007 was also notable at smaller banks, where provisioning rose to an annual rate of 0.55 percent of assets in the fourth quarter from 0.22 percent in the year-earlier period.
The rate of loss provisioning in 2007 considerably outpaced that of charge-offs and boosted total reserves for loan and lease losses. As a result, reserves as a percentage of total loans and leases increased in 2007 for the first time in several years, but that ratio remained near the low end of its historical range (figure 32). The percentage increase in the stock of reserves, however, was smaller than that in charge-offs and delinquencies, which led to declines in some other measures of reserve adequacy. At the average charge-off rate for all of 2007 and without additional loss provisions, current reserves are sufficient to cover about 2-1/2 years of charge-offs, a typical reading for this measure. As noted previously, however, charge-off rates over the latter part of 2007 ran considerably above those that had prevailed earlier in the year. The ratio of reserves for loan and lease losses to total delinquent loans, which in recent years had been running near the high end of its range over the past two decades, dropped substantially--to about 50 percent as of year-end, its lowest level since 1991.
International Operations of U.S. Commercial Banks
The share of U.S. bank assets booked in foreign offices in 2007 increased about 100 basis points, to 14 percent, and remained highly concentrated among the largest banks. However, U.S. commercial banks lost money in 2007 on their international operations, which subtracted about 6 percent from total consolidated net income. The losses were mostly attributable to just a few institutions and primarily reflected a jump in non-interest expense as well as a moderate decline in non-interest income.
Banks' exposures to emerging market countries through lending and derivatives activities grew rapidly in 2007.21 Banks' total exposure to Asian economies climbed to 45 percent of tier 1 capital, in part because of a significant increase in lending to residents of India (table 3). An increase in lending to residents of Brazil helped push up banks' exposure to Latin American and Caribbean economies to 36 percent of tier 1 capital. Banks' exposure to eastern European countries rose to 9 percent of tier 1 capital in 2007, up from 6.5 percent the year earlier.
| Percent | |||||||||
| Year | Asia | Latin America and the Caribbean | Eastern Europe |
Total exposure to developing economies |
|||||
|---|---|---|---|---|---|---|---|---|---|
| All | China | India | Korea | All | Mexico | Brazil | |||
| 1998 | 28.2 | 1.0 | 2.4 | 7.1 | 42.9 | 9.9 | 11.3 | 3.5 | 100.1 |
| 1999 | 26.1 | .8 | 2.4 | 6.6 | 39.0 | 9.5 | 10.5 | 2.9 | 90.7 |
| 2000 | 24.0 | .8 | 2.6 | 6.4 | 37.9 | 9.1 | 11.2 | 4.4 | 87.9 |
| 2001 | 22.4 | .9 | 2.6 | 5.8 | 54.1 | 26.0 | 3.0 | 4.3 | 100.3 |
| 2002 | 21.9 | .9 | 2.7 | 5.8 | 38.9 | 20.8 | 8.4 | 5.5 | 84.8 |
| 2003 | 22.8 | 1.3 | 3.9 | 5.5 | 32.9 | 18.0 | 6.8 | 5.4 | 79.8 |
| 2004 | 32.2 | 1.4 | 4.2 | 15.0 | 31.8 | 16.7 | 6.5 | 6.1 | 89.2 |
| 2005 | 30.7 | 2.4 | 4.9 | 12.9 | 31.8 | 17.4 | 6.9 | 5.9 | 86.4 |
| 2006 | 34.7 | 4.1 | 6.1 | 13.6 | 30.8 | 16.9 | 5.7 | 6.5 | 92.6 |
| 2007 | 44.6 | 4.5 | 9.8 | 14.4 | 35.6 | 17.2 | 8.2 | 9.0 | 119.6 |
| Memo Total exposure (billions of dollars) |
|||||||||
| 1998 | 69.1 | 2.3 | 5.4 | 17.3 | 104.7 | 24.2 | 27.6 | 8.5 | 244.7 |
| 1999 | 67.9 | 2.0 | 6.2 | 17.2 | 101.6 | 24.8 | 27.3 | 7.4 | 236.4 |
| 2000 | 68.0 | 2.2 | 7.5 | 18.1 | 107.3 | 25.7 | 31.6 | 12.3 | 249.1 |
| 2001 | 67.2 | 2.7 | 7.7 | 17.5 | 162.4 | 78.0 | 39.0 | 12.9 | 301.4 |
| 2002 | 69.5 | 2.7 | 8.7 | 18.4 | 123.5 | 66.2 | 26.6 | 17.6 | 269.4 |
| 2003 | 79.9 | 4.4 | 13.6 | 19.2 | 115.2 | 63.0 | 23.7 | 19.1 | 280.1 |
| 2004 | 125.8 | 5.3 | 16.3 | 58.7 | 124.4 | 65.2 | 25.5 | 23.8 | 348.9 |
| 2005 | 134.8 | 10.4 | 21.6 | 56.7 | 139.7 | 76.1 | 30.4 | 25.7 | 378.8 |
| 2006 | 190.5 | 22.7 | 33.6 | 74.8 | 168.9 | 92.5 | 31.5 | 35.5 | 508.2 |
| 2007 | 249.8 | 25.5 | 54.9 | 80.8 | 199.3 | 96.1 | 46.2 | 50.2 | 670.6 |
Note: Exposures consist of lending and derivatives exposures for cross-border and local-office operations. Respondents may file information on one bank or on the bank holding company as a whole. For the definition of tier 1 capital, see text note 9.
The year-end 2007 data cover 65 banks with a total of $560.5 billion in tier 1 capital.
Source: Federal Financial Institutions Examination Council, Statistical Release E.16, "Country Exposure Lending Survey."
Developments in Early 2008
U.S. economic activity, which was sluggish in the fourth quarter of 2007, remained so in the first three months of 2008. Residential construction and home sales continued to contract, and home prices dropped. Consumer spending was subdued amid slumping sentiment and restrained growth in wealth and real income, and business spending also weakened. Energy prices jumped again during the first quarter; the price of oil rose to record highs, which added to the headwinds facing the economy and helped sustain pressures on headline inflation. However, core consumer price inflation decreased slightly in the first quarter. Concerns about the economic outlook and fears regarding possible further large losses at banks and other financial institutions continued to put pressure on financial markets through the first part of 2008. Broad stock market indexes declined, and risk spreads on a wide range of debt securities--including corporate bonds and various types of asset-backed securities--increased across the ratings spectrum. Against that backdrop, the Federal Open Market Committee cut the target for the federal funds rate from 4-1/2 percent at the end of 2007 to 2-1/4 percent by the end of March. Yields on Treasury bills fell, at times, to their lowest levels in 50 years, declines that reflected heightened demand for safe and liquid assets. Yields on longer-term Treasury securities also declined sharply; by the end of March, the 2-year yield had dropped to 1.61 percent and the 10-year yield to 3.69 percent. The April 2008 BLPS indicated that large fractions of banks had tightened credit standards and terms on loans to businesses and households during the first quarter.
Various short-term funding markets had shown some improvement in December and January with the introduction of the Federal Reserve's Term Auction Facility (TAF) and the passage of year-end. However, the further deterioration of those markets in February and March placed renewed pressures on banks and other financial institutions and possibly exacerbated the ongoing tightening of credit conditions. To provide liquidity and foster smoother functioning of those markets, the Federal Reserve in mid-March increased the TAF from $60 billion to $100 billion and also expanded the size of its swap lines with the European Central Bank and the Swiss National Bank. Moreover, the Federal Reserve announced a new Term Securities Lending Facility, which allowed primary dealers to borrow as much as $200 billion of Treasury securities from the portfolio of the Federal Reserve's System Open Market Account against high-quality collateral, including agency securities and highly rated residential and commercial mortgage-backed securities. Finally, the Federal Reserve created the Primary Dealer Credit Facility to improve the ability of primary dealers to provide financing to participants in securitization markets. The facility provides overnight loans collateralized by a specified range of eligible investment-grade securities.22
Growth of domestic bank credit slowed somewhat in the first quarter of 2008. Although banks tightened standards and terms on C&I loans, such loans expanded briskly on the heels of their robust fourth-quarter pace, in part because of sustained disruptions in the syndicated loan market and drawdowns on existing C&I credit lines. CRE loans also continued to advance despite reported further tightening of credit standards in that sector. Residential real estate loans expanded modestly, partly as a result of significant increases in revolving home equity loans, many of which carry adjustable rates that may have become more attractive as the market interest rates on which they are often based declined. Consumer loans increased at a moderate rate but slowed somewhat compared with the pace in the second half of 2007.
In the first quarter, profits of commercial banks declined markedly from year-ago levels, and some banks reported significant losses. Write-downs of mortgage-related assets and leveraged syndicated loans reportedly contributed importantly to the drop in profitability in the first quarter at many banks. Banks also substantially increased loss provisions amid additional deterioration in the credit quality of loans to residential developers and continued weakness in residential mortgages. Delinquency rates on consumer loans also increased, and those on C&I loans edged higher.
The stock prices of banking firms dropped further, and the spreads on their credit default swaps widened through February. Sentiment improved in mid- to late March, however, when the Federal Reserve announced the measures to provide additional term funding, and first-quarter results at a few investment banks were seen as reassuring. On balance, bank stock prices fell almost 10 percent in the first quarter of 2008, about in line with the change in the S&P 500 (figure 33). The median spread on credit default swaps for large banking organizations nearly doubled, to almost 100 basis points, over the same period.
Note: The data in this article cover insured domestic commercial banks and nondeposit trust companies (hereafter, banks). Except as otherwise indicated, the data are from the Consolidated Reports of Condition and Income (Call Report). The Call Report consists of two forms submitted by domestic banks to the Federal Financial Institutions Examination Council: FFIEC 031 (for those with domestic and foreign offices) and FFIEC 041 (for those with domestic offices only). The data thus consolidate information from foreign and domestic offices, and they have been adjusted to take account of mergers and the effects of push-down accounting. For additional information on the adjustments to the data, see the appendix in William B. English and William R. Nelson (1998), "Profits and Balance Sheet Developments at U.S. Commercial Banks in 1997," Federal Reserve Bulletin, vol. 84 (June), p. 408. Size categories, based on assets at the start of each quarter, are as follows: the 10 largest banks, large banks (those ranked 11 through 100), medium-sized banks (those ranked 101 through 1,000), and small banks (those ranked 1,001 and higher). At the start of the fourth quarter of 2007, the approximate asset sizes of the banks in those groups were as follows: the 10 largest banks, more than $140 billion; large banks, $7.2 billion to $140 billion; medium-sized banks, $494 million to $7.1 billion; and small banks, less than $494 million.
Data shown in this article may not match data published in earlier years because of revisions and corrections. Call Report data reflect information available as of April 16, 2008. In the tables, components may not sum to totals because of rounding. Appendix tables A.1.A through A.1.E report portfolio composition, income, and expense items, all as a percentage of overall average net consolidated assets, for all banks and for each of the four size categories. Appendix table A.2 reports income statement data for all banks.
1. The Federal Reserve conducted unusually large open market operations, made adjustments to the primary credit rate and to procedures for discount window borrowing and securities lending, established a Term Auction Facility, and entered into currency swap arrangements with two other central banks. For a fuller discussion of the measures employed by the Federal Reserve in 2007 to support orderly market functioning, see box "The Federal Reserve's Responses to Financial Strains," in Board of Governors of the Federal Reserve System (2008), Monetary Policy Report to the Congress (Washington: Board of Governors, February), pp. 26-27. Return to text
2. In this article, core deposits are defined as the sum of transaction deposits, savings deposits (including money market deposit accounts), and small time deposits (time deposits issued in denominations of less than $100,000) held at domestic offices. Managed liabilities consist of large ($100,000 or more) time deposits booked in domestic offices, deposits booked in foreign offices, subordinated notes and debentures, federal funds purchased and securities sold under repurchase agreements, FHLB advances, and other borrowed money. Return to text
3. Statistics on financial holding companies include both domestic BHCs that have elected to become financial holding companies and foreign banking organizations operating in the United States as financial holding companies and subject to the Bank Holding Company Act. For more information, see Board of Governors of the Federal Reserve System (2003), Report to the Congress on Financial Holding Companies under the Gramm-Leach-Bliley Act (Washington: Board of Governors, November). Return to text
4. In asking banks to report demand, the survey instructs them to "consider only funds actually disbursed as opposed to requests for new or increased lines of credit." Return to text
5. In view of the increasing concentration at smaller institutions, regulators issued interagency guidance in December 2006 to promote sound risk-management practices at banks regarding their CRE loans. See Office of the Comptroller of the Currency, Board of Governors of the Federal Reserve System, and Federal Deposit Insurance Corporation (2006), "Federal Banking Agencies Issue Final Guidance on Concentrations in Commercial Real Estate Lending," press release, December 6. Return to text
6. In asking banks how demand for mortgages to purchase homes has changed over the past three months, the BLPS instructs banks to consider only new originations as opposed to the refinancing of existing mortgages. However, that distinction may be difficult for banks to make in practice. Return to text
7. Using its Survey of Terms of Bank Lending to Farmers, the Federal Reserve estimates the amount of non-real-estate bank loans made to farmers by loan purpose, such as to obtain farm equipment and machinery or to cover operating expenses. The information is published quarterly in Board of Governors of the Federal Reserve System, Statistical Release E.15, "Agricultural Finance Databook," section A. Return to text
8. Before 2007, insured brokered deposits were included in large time deposits on the Call Report. As of the first quarter of last year, they are classified as small time deposits. The accounting change makes it appear as if there were rapid decreases in large time deposits and rapid increases in small time deposits in that quarter. The growth rates reported in the text have been adjusted for this effect and thus do not match the numbers reported in table 1. Return to text
9. Tier 1 and tier 2 capital are regulatory measures. Tier 1 capital consists primarily of common equity (excluding intangible assets such as goodwill and excluding net unrealized gains on investment account securities classified as available for sale) and certain perpetual preferred stock. Tier 2 capital consists primarily of subordinated debt, preferred stock not included in tier 1 capital, and loan-loss reserves up to a cap of 1.25 percent of risk-weighted assets. Total regulatory capital is the sum of tier 1 and tier 2 capital. Risk-weighted assets are calculated by multiplying the amount of assets and the credit-equivalent amount of off-balance-sheet items (an estimate of the potential credit exposure posed by the items) by the risk weight for each category. The risk weights rise from 0 to 1 as the credit risk of the assets increases. The tier 1 ratio is the ratio of tier 1 capital to risk-weighted assets; the total ratio is the ratio of the sum of tier 1 and tier 2 capital to risk-weighted assets. Return to text
10. The leverage ratio is the ratio of tier 1 capital to average tangible assets. Tangible assets are equal to total average consolidated assets less assets excluded from common equity in the calculation of tier 1 capital. Return to text
11. Well-capitalized banks are those with a total risk-based capital ratio of 10 percent or greater, a tier 1 risk-based ratio of 6 percent or greater, a leverage ratio of 5 percent or greater, and a composite CAMELS rating of 1 or 2. Each letter in CAMELS stands for a key element of bank financial condition--Capital adequacy, Asset quality, Management, Earnings, Liquidity, and Sensitivity to market risks. The estimated average margin by which banks were well capitalized was computed as follows: Among the leverage, tier 1, and total capital ratios of each well-capitalized bank, the institution's "tightest" capital ratio is defined as the one closest to the regulatory standard for being well capitalized. The bank's margin is then defined as the percentage point difference between its tightest capital ratio and the corresponding regulatory standard. The average margin among all well-capitalized banks--the measure referred to in figure 15--is the weighted average of all the individual margins; the weights are each bank's share of the total assets of well-capitalized banks. Return to text
12. That the fair market values of banks' derivative contracts are nearly offsetting does not mean that banks' aggregate exposures to the market and credit risk associated with the contracts are likewise nearly offsetting because, for example, the counterparties to banks' positive- and negative-valued contracts may differ. Return to text
13. Interest rate swaps are agreements in which two parties contract to exchange two payment streams, one based on a floating interest rate and the other based on a fixed interest rate; the payment streams are calculated on the basis of the notional principal amount of the contract. Return to text
14. It is worth emphasizing that the analysis in this article is based on the Call Reports for commercial banks. For a commercial bank that is a subsidiary of a bank holding company or a financial holding company, the Call Report does not include the assets, income, or expenses of the other subsidiaries of the larger organization, including nonbank subsidiaries. Thus, the profits of the commercial banks that are subsidiaries of a larger banking organization may differ substantially from the profits of the consolidated institution. Return to text
15. The average interest rate paid on time deposits may adjust slowly to changes in market interest rates because time deposit rates are usually fixed for the duration of the instrument. However, about 30 percent of small time deposits, and more than 50 percent of large time deposits, issued by banks had a remaining maturity of three months or less as of midyear 2007. Thus, the rates on a significant fraction of those deposits would have reset before the fourth quarter. Return to text
16. For more information, see box "The Role of Non-Interest-Bearing Instruments in the Net Interest Margin," in Mark Carlson and Roberto Perli (2004), "Profits and Balance Sheet Developments at U.S. Commercial Banks in 2003," Federal Reserve Bulletin, vol. 90 (Spring), p. 173. Return to text
17. For a detailed description of these actions, see box "The Federal Reserve's Responses to the Subprime Mortgage Crisis," in Board of Governors of the Federal Reserve System (2008), Monetary Policy Report to the Congress (Washington: Board of Governors, February), pp. 8-9. Return to text
18. The Hope Now Alliance aims to increase outreach efforts to contact at-risk borrowers and to play an important role in streamlining the process for refinancing and modifying variable-rate subprime mortgages. The alliance will work to expand the capacity of an existing national network to counsel borrowers and refer them to participating servicers, who have agreed to work toward cross-industry solutions to better serve the homeowner. Return to text
19. For a discussion of the change in bankruptcy law that was implemented in 2005 and its effect on credit card loans, see box "The New Bankruptcy Law and Its Effect on Credit Card Loans," in Elizabeth Klee and Gretchen Weinbach (2006), "Profits and Balance Sheet Developments at U.S. Commercial Banks in 2005," Federal Reserve Bulletin, vol. 92 (June), p. A89. Return to text
20. The analysis excludes loans that were sold to, and securitized by, a third party (for example, the Federal National Mortgage Association or the Federal Home Loan Mortgage Corporation). Return to text
21. The analysis in this paragraph draws from information in the Country Exposure Report (FFIEC 009), which is filed only by banks with significant international exposures. More information about the report is available from the Federal Financial Institutions Examination Council. Return to text
22. A concise summary of the Federal Reserve's recent initiatives to promote liquidity and smooth functioning in financial markets is available at the Federal Reserve Bank of New York website (289 KB PDF). Return to text
Appendix Tables
| A. All banks | ||||||||||
| Item | 1998 | 1999 | 2000 | 2001 | 2002 | 2003 | 2004 | 2005 | 2006 | 2007 |
|---|---|---|---|---|---|---|---|---|---|---|
| Balance sheet items as a percentage of average net consolidated assets | ||||||||||
| Interest-earning assets | 86.76 | 87.03 | 87.13 | 86.49 | 86.42 | 86.08 | 86.90 | 86.82 | 86.86 | 86.94 |
| Loans and leases (net) | 58.33 | 59.34 | 60.49 | 58.95 | 57.83 | 56.88 | 56.98 | 57.88 | 58.26 | 58.37 |
| Commercial and industrial | 16.36 | 17.07 | 17.16 | 16.08 | 14.07 | 12.18 | 11.06 | 11.17 | 11.42 | 11.84 |
| U.S. addressees | 13.61 | 14.43 | 14.67 | 13.69 | 12.04 | 10.48 | 9.52 | 9.64 | 9.73 | 9.86 |
| Foreign addressees | 2.75 | 2.64 | 2.49 | 2.39 | 2.04 | 1.70 | 1.54 | 1.53 | 1.70 | 1.98 |
| Consumer | 10.41 | 9.71 | 9.38 | 9.23 | 9.35 | 9.05 | 9.18 | 9.12 | 8.53 | 8.43 |
| Credit card | 4.02 | 3.51 | 3.52 | 3.69 | 3.78 | 3.54 | 3.87 | 4.05 | 3.73 | 3.72 |
| Installment and other | 6.39 | 6.20 | 5.87 | 5.55 | 5.57 | 5.51 | 5.31 | 5.06 | 4.80 | 4.71 |
| Real estate | 24.85 | 25.44 | 27.04 | 27.10 | 28.39 | 29.91 | 30.77 | 32.40 | 33.19 | 33.36 |
| In domestic offices | 24.28 | 24.87 | 26.49 | 26.60 | 27.91 | 29.46 | 30.24 | 31.84 | 32.61 | 32.76 |
| Construction and land development | 1.86 | 2.18 | 2.51 | 2.85 | 2.98 | 2.99 | 3.26 | 3.90 | 4.73 | 5.05 |
| Farmland | .55 | .56 | .56 | .55 | .56 | .54 | .54 | .54 | .53 | .53 |
| One- to four-family residential | 14.25 | 14.10 | 14.96 | 14.67 | 15.40 | 16.96 | 17.42 | 18.26 | 18.23 | 18.31 |
| Home equity | 1.89 | 1.76 | 1.96 | 2.18 | 2.80 | 3.40 | 4.34 | 4.95 | 4.71 | 4.48 |
| Other | 12.37 | 12.34 | 13.00 | 12.49 | 12.60 | 13.57 | 13.08 | 13.31 | 13.51 | 13.82 |
| Multifamily residential | .82 | .88 | .99 | .97 | 1.02 | 1.05 | 1.06 | 1.08 | 1.06 | 1.04 |
| Nonfarm nonresidential | 6.80 | 7.15 | 7.48 | 7.56 | 7.95 | 7.91 | 7.97 | 8.06 | 8.07 | 7.84 |
| In foreign offices | .57 | .57 | .54 | .50 | .48 | .46 | .53 | .56 | .58 | .60 |
| To depository institutions and acceptances of other banks | 1.91 | 1.96 | 1.87 | 1.83 | 1.87 | 1.98 | 2.11 | 1.73 | 1.65 | 1.21 |
| Foreign governments | .15 | .16 | .12 | .10 | .09 | .08 | .08 | .06 | .04 | .03 |
| Agricultural production | .89 | .83 | .78 | .75 | .70 | .63 | .59 | .56 | .55 | .52 |
| Other loans | 2.78 | 2.75 | 2.58 | 2.34 | 2.06 | 2.00 | 2.35 | 2.09 | 2.19 | 2.48 |
| Lease-financing receivables | 2.12 | 2.51 | 2.63 | 2.58 | 2.44 | 2.11 | 1.79 | 1.58 | 1.43 | 1.23 |
| Less: Unearned income on loans | -.07 | -.06 | -.05 | -.04 | -.05 | -.04 | -.04 | -.03 | -.03 | -.02 |
| Less: Loss reserves1 | -1.07 | -1.04 | -1.02 | -1.04 | -1.11 | -1.04 | -.91 | -.79 | -.71 | -.70 |
| Securities | 20.37 | 20.40 | 20.01 | 19.53 | 21.27 | 21.90 | 22.57 | 22.04 | 21.32 | 20.77 |
| Investment account | 17.48 | 18.33 | 17.59 | 16.82 | 18.30 | 18.97 | 18.99 | 17.87 | 16.89 | 15.41 |
| Debt | 16.93 | 17.73 | 16.93 | 16.48 | 17.99 | 18.72 | 18.79 | 17.71 | 16.73 | 15.23 |
| U.S. Treasury | 2.70 | 2.14 | 1.66 | .85 | .78 | .90 | .89 | .62 | .47 | .32 |
| U.S. government agency and corporation obligations | 10.28 | 10.85 | 10.31 | 10.08 | 11.46 | 12.26 | 12.37 | 11.51 | 10.65 | 9.32 |
| Government-backed mortgage pools | 5.16 | 5.24 | 4.75 | 5.13 | 6.09 | 6.75 | 7.13 | 6.78 | 6.43 | 5.82 |
| Collateralized mortgage obligations | 2.12 | 2.15 | 1.92 | 1.95 | 2.35 | 2.34 | 2.01 | 1.80 | 1.58 | 1.34 |
| Other | 2.99 | 3.46 | 3.63 | 2.99 | 3.02 | 3.17 | 3.22 | 2.93 | 2.65 | 2.16 |
| State and local government | 1.57 | 1.62 | 1.52 | 1.49 | 1.49 | 1.48 | 1.41 | 1.36 | 1.34 | 1.34 |
| Private mortgage-backed securities | .67 | .88 | .95 | 1.09 | 1.25 | 1.30 | 1.41 | 1.76 | 1.89 | 2.15 |
| Other | 1.70 | 2.24 | 2.48 | 2.98 | 3.01 | 2.78 | 2.72 | 2.47 | 2.37 | 2.10 |
| Equity | .55 | .61 | .66 | .34 | .31 | .25 | .20 | .16 | .16 | .18 |
| Trading account | 2.90 | 2.06 | 2.43 | 2.72 | 2.97 | 2.93 | 3.59 | 4.17 | 4.43 | 5.36 |
| Gross federal funds sold and reverse RPs | 5.37 | 4.61 | 4.12 | 5.11 | 4.81 | 4.85 | 4.58 | 4.75 | 5.30 | 5.49 |
| Interest-bearing balances at depositories | 2.69 | 2.68 | 2.52 | 2.90 | 2.52 | 2.45 | 2.76 | 2.15 | 1.98 | 2.30 |
| Non-interest-earning assets | 13.24 | 12.97 | 12.87 | 13.51 | 13.58 | 13.92 | 13.10 | 13.18 | 13.14 | 13.06 |
| Revaluation gains held in trading accounts | 2.95 | 2.57 | 2.28 | 2.37 | 2.42 | 2.70 | 2.19 | 1.82 | 1.64 | 1.73 |
| Other | 10.29 | 10.41 | 10.58 | 11.15 | 11.16 | 11.22 | 10.91 | 11.36 | 11.50 | 11.33 |
| Liabilities | 91.51 | 91.52 | 91.58 | 91.25 | 90.85 | 90.96 | 90.57 | 89.91 | 89.84 | 89.78 |
| Core deposits | 49.43 | 48.60 | 46.52 | 47.07 | 48.98 | 49.18 | 48.56 | 47.52 | 45.56 | 43.89 |
| Transaction deposits | 14.10 | 12.58 | 11.07 | 10.36 | 10.06 | 9.74 | 9.10 | 8.46 | 7.45 | 6.43 |
| Demand deposits | 10.99 | 9.78 | 8.61 | 8.00 | 7.67 | 7.26 | 6.58 | 6.16 | 5.41 | 4.66 |
| Other checkable deposits | 3.11 | 2.81 | 2.46 | 2.36 | 2.39 | 2.47 | 2.52 | 2.30 | 2.04 | 1.77 |
| Savings deposits (including MMDAs) | 20.87 | 22.47 | 22.43 | 24.53 | 28.13 | 30.12 | 31.19 | 30.83 | 29.49 | 28.21 |
| Small time deposits | 14.46 | 13.55 | 13.01 | 12.18 | 10.80 | 9.33 | 8.27 | 8.23 | 8.62 | 9.26 |
| Managed liabilities2 | 34.97 | 36.59 | 38.83 | 37.42 | 35.05 | 34.61 | 35.69 | 36.25 | 38.29 | 39.86 |
| Large time deposits | 7.67 | 7.89 | 8.77 | 8.89 | 8.30 | 8.09 | 8.00 | 9.11 | 10.07 | 9.13 |
| Deposits booked in foreign offices | 10.59 | 10.96 | 11.43 | 10.66 | 9.42 | 9.38 | 10.25 | 10.39 | 11.18 | 12.81 |
| Subordinated notes and debentures | 1.30 | 1.36 | 1.37 | 1.43 | 1.40 | 1.33 | 1.30 | 1.34 | 1.40 | 1.55 |
| Gross federal funds purchased and RPs | 7.98 | 7.97 | 7.83 | 7.95 | 7.77 | 7.75 | 7.24 | 7.05 | 7.53 | 7.06 |
| Other managed liabilities | 7.43 | 8.41 | 9.44 | 8.50 | 8.16 | 8.06 | 8.91 | 8.37 | 8.11 | 9.31 |
| Revaluation losses held in trading accounts | 2.97 | 2.52 | 2.29 | 2.21 | 2.09 | 2.30 | 1.95 | 1.67 | 1.51 | 1.59 |
| Other | 4.14 | 3.81 | 3.94 | 4.54 | 4.73 | 4.87 | 4.36 | 4.47 | 4.47 | 4.44 |
| Capital account | 8.49 | 8.48 | 8.42 | 8.75 | 9.15 | 9.04 | 9.43 | 10.09 | 10.16 | 10.22 |
| Memo | ||||||||||
| Commercial real estate loans3 | 10.11 | 10.87 | 11.58 | 12.09 | 12.57 | 12.47 | 12.78 | 13.52 | 14.35 | 14.47 |
| Other real estate owned4 | .08 | .06 | .05 | .05 | .06 | .06 | .06 | .04 | .05 | .07 |
| Mortgage-backed securities | 7.96 | 8.27 | 7.63 | 8.17 | 9.69 | 10.39 | 10.56 | 10.33 | 9.89 | 9.31 |
| Federal Home Loan Bank advances | n.a. | n.a. | n.a. | 2.89 | 3.17 | 3.19 | 3.07 | 3.04 | 3.07 | 3.66 |
| Average net consolidated assets (billions of dollars) | 5,147 | 5,439 | 5,906 | 6,334 | 6,634 | 7,248 | 7,879 | 8,591 | 9,427 | 10,396 |
| Effective interest rate (percent)5 | ||||||||||
| Rates earned | ||||||||||
| Interest-earning assets | 8.01 | 7.73 | 8.20 | 7.37 | 6.10 | 5.29 | 5.08 | 5.69 | 6.65 | 6.78 |
| Taxable equivalent | 8.07 | 7.78 | 8.26 | 7.42 | 6.15 | 5.33 | 5.12 | 5.73 | 6.68 | 6.82 |
| Loans and leases, gross | 8.85 | 8.50 | 9.00 | 8.15 | 6.89 | 6.15 | 5.91 | 6.52 | 7.55 | 7.54 |
| Net of loss provisions | 8.30 | 7.99 | 8.33 | 7.15 | 5.84 | 5.46 | 5.47 | 6.09 | 7.18 | 6.70 |
| Securities | 6.44 | 6.30 | 6.47 | 6.04 | 4.95 | 3.96 | 3.86 | 4.18 | 4.71 | 5.02 |
| Taxable equivalent | 6.63 | 6.48 | 6.65 | 6.22 | 5.10 | 4.10 | 3.99 | 4.30 | 4.83 | 5.14 |
| Investment account | 6.38 | 6.28 | 6.45 | 6.05 | 5.04 | 4.00 | 3.96 | 4.29 | 4.86 | 5.13 |
| U.S. Treasury securities and U.S. government agency obligations (excluding MBS) | n.a. | n.a. | n.a. | 5.76 | 4.42 | 3.29 | 3.11 | 3.46 | 4.19 | 4.71 |
| Mortgage-backed securities | n.a. | n.a. | n.a. | 6.45 | 5.44 | 4.24 | 4.38 | 4.60 | 5.10 | 5.29 |
| Other | n.a. | n.a. | n.a. | 5.60 | 4.74 | 4.08 | 3.76 | 4.23 | 4.76 | 5.02 |
| Trading account | 6.85 | 6.48 | 6.63 | 6.01 | 4.38 | 3.71 | 3.35 | 3.72 | 4.16 | 4.70 |
| Gross federal funds sold and reverse RPs | 5.29 | 4.78 | 5.56 | 3.86 | 1.93 | 1.40 | 1.40 | 2.66 | 4.31 | 5.07 |
| Interest-bearing balances at depositories | 6.32 | 5.95 | 6.48 | 4.01 | 2.79 | 2.09 | 1.98 | 3.70 | 5.10 | 5.15 |
| Rates paid | ||||||||||
| Interest-bearing liabilities | 4.68 | 4.31 | 4.94 | 3.93 | 2.38 | 1.72 | 1.63 | 2.47 | 3.59 | 3.82 |
| Interest-bearing deposits | 4.31 | 3.88 | 4.45 | 3.61 | 2.11 | 1.47 | 1.36 | 2.06 | 3.05 | 3.39 |
| In foreign offices | 5.66 | 4.91 | 5.61 | 3.94 | 2.38 | 1.62 | 1.72 | 2.77 | 3.92 | 4.23 |
| In domestic offices | 4.01 | 3.65 | 4.17 | 3.54 | 2.06 | 1.44 | 1.29 | 1.91 | 2.85 | 3.18 |
| Other checkable deposits | 2.29 | 2.08 | 2.34 | 1.96 | 1.06 | .75 | .77 | 1.41 | 1.88 | 2.04 |
| Savings deposits (including MMDAs) | 2.79 | 2.50 | 2.86 | 2.19 | 1.13 | .74 | .72 | 1.24 | 2.01 | 2.22 |
| Large time deposits6 | 5.22 | 4.93 | 5.78 | 5.04 | 3.37 | 2.59 | 2.35 | 3.19 | 4.39 | 4.71 |
| Other time deposits6 | 5.48 | 5.11 | 5.69 | 5.43 | 3.70 | 2.88 | 2.56 | 3.14 | 4.11 | 4.72 |
| Gross federal funds purchased and RPs | 5.19 | 4.74 | 5.77 | 3.83 | 1.88 | 1.30 | 1.49 | 3.07 | 4.57 | 4.98 |
| Other interest-bearing liabilities | 6.50 | 6.49 | 6.97 | 5.91 | 4.49 | 3.69 | 3.34 | 4.57 | 6.28 | 5.46 |
| Income and expense as a percentage of average net consolidated assets | ||||||||||
| Gross interest income | 6.98 | 6.75 | 7.18 | 6.38 | 5.27 | 4.54 | 4.43 | 4.96 | 5.85 | 5.94 |
| Taxable equivalent | 7.03 | 6.80 | 7.22 | 6.42 | 5.31 | 4.58 | 4.46 | 5.00 | 5.88 | 5.97 |
| Loans | 5.27 | 5.13 | 5.53 | 4.92 | 4.06 | 3.55 | 3.42 | 3.82 | 4.48 | 4.47 |
| Securities | 1.10 | 1.15 | 1.15 | 1.00 | .89 | .74 | .74 | .77 | .84 | .80 |
| Gross federal funds sold and reverse RPs | .29 | .23 | .23 | .20 | .09 | .07 | .07 | .13 | .23 | .28 |
| Other | .32 | .24 | .27 | .27 | .22 | .18 | .20 | .25 | .31 | .39 |
| Gross interest expense | 3.46 | 3.22 | 3.76 | 2.98 | 1.79 | 1.30 | 1.25 | 1.89 | 2.79 | 2.99 |
| Deposits | 2.43 | 2.21 | 2.56 | 2.09 | 1.23 | .86 | .81 | 1.23 | 1.84 | 2.05 |
| Gross federal funds purchased and RPs | .43 | .39 | .45 | .31 | .15 | .10 | .11 | .22 | .36 | .36 |
| Other | .60 | .63 | .75 | .58 | .41 | .33 | .33 | .44 | .59 | .58 |
| Net interest income | 3.52 | 3.52 | 3.41 | 3.40 | 3.48 | 3.24 | 3.17 | 3.07 | 3.05 | 2.95 |
| Taxable equivalent | 3.57 | 3.57 | 3.46 | 3.44 | 3.52 | 3.28 | 3.21 | 3.11 | 3.09 | 2.98 |
| Loss provisions7 | .42 | .39 | .50 | .68 | .68 | .45 | .30 | .30 | .27 | .54 |
| Non-interest income | 2.41 | 2.66 | 2.59 | 2.54 | 2.54 | 2.54 | 2.40 | 2.35 | 2.36 | 2.10 |
| Service charges on deposits | .38 | .40 | .40 | .42 | .45 | .44 | .42 | .39 | .38 | .38 |
| Fiduciary activities | .37 | .38 | .38 | .35 | .32 | .31 | .32 | .31 | .30 | .32 |
| Trading revenue | .15 | .19 | .21 | .20 | .16 | .16 | .13 | .17 | .20 | .05 |
| Interest rate exposures | .05 | .07 | .08 | .09 | .08 | .07 | .03 | .05 | .05 | .04 |
| Foreign exchange rate exposures | .09 | .09 | .08 | .07 | .07 | .07 | .07 | .07 | .08 | .07 |
| Other commodity and equity exposures | .01 | .03 | .04 | .03 | .01 | .02 | .03 | .04 | .07 | .03 |
| Other | 1.50 | 1.70 | 1.61 | 1.57 | 1.60 | 1.63 | 1.53 | 1.48 | 1.48 | 1.36 |
| Non-interest expense | 3.77 | 3.77 | 3.66 | 3.57 | 3.47 | 3.36 | 3.34 | 3.19 | 3.13 | 3.09 |
| Salaries, wages, and employee benefits | 1.55 | 1.59 | 1.51 | 1.49 | 1.51 | 1.50 | 1.46 | 1.44 | 1.44 | 1.39 |
| Occupancy | .47 | .48 | .45 | .44 | .44 | .43 | .42 | .41 | .39 | .37 |
| Other | 1.76 | 1.71 | 1.70 | 1.64 | 1.51 | 1.43 | 1.46 | 1.34 | 1.30 | 1.33 |
| Net non-interest expense | 1.36 | 1.11 | 1.07 | 1.03 | .93 | .82 | .94 | .84 | .76 | .99 |
| Gains on investment account securities | .06 | * | -.04 | .07 | .10 | .08 | .04 | * | -.01 | -.01 |
| Income before taxes and extraordinary items | 1.81 | 2.03 | 1.81 | 1.77 | 1.96 | 2.05 | 1.97 | 1.93 | 2.00 | 1.41 |
| Taxes | .62 | .72 | .63 | .59 | .65 | .67 | .64 | .62 | .65 | .43 |
| Extraordinary items, net of income taxes | .01 | * | * | -.01 | * | .01 | * | * | .03 | -.02 |
| Net income | 1.20 | 1.31 | 1.18 | 1.17 | 1.32 | 1.39 | 1.33 | 1.31 | 1.39 | .97 |
| Cash dividends declared | .80 | .96 | .89 | .87 | 1.01 | 1.07 | .76 | .75 | .87 | .82 |
| Retained income | .40 | .35 | .29 | .31 | .30 | .31 | .58 | .56 | .51 | .15 |
| Memo: Return on equity | 14.07 | 15.43 | 13.97 | 13.41 | 14.38 | 15.34 | 14.14 | 12.99 | 13.64 | 9.48 |
Note: Data are as of April 16, 2008.
1. Includes allocated transfer risk reserve. Return to table
2. Measured as the sum of large time deposits in domestic offices, deposits booked in foreign offices, subordinated notes and debentures, federal funds purchased and securities sold under repurchase agreements, Federal Home Loan Bank advances, and other borrowed money. Return to table
3. Measured as the sum of construction and land development loans secured by real estate; real estate loans secured by nonfarm nonresidential properties or by multifamily residential properties; and loans to finance commercial real estate, construction, and land development activities not secured by real estate. Return to table
4. Other real estate owned is a component of other non-interest-earning assets. Return to table
5. When possible, based on the average of quarterly balance sheet data reported on schedule RC-K of the quarterly Call Report. Return to table
6. Before 1997, large time deposit open accounts were included in other time deposits. Return to table
7. Includes provisions for allocated transfer risk. Return to table
* In absolute value, less than 0.005 percent. Return to table
n.a. Not available. Return to table
MMDA Money market deposit account. Return to table
RP Repurchase agreement. Return to table
MBS Mortgage-backed securities. Return to table
| B. Ten largest banks by assets | ||||||||||
| Item | 1998 | 1999 | 2000 | 2001 | 2002 | 2003 | 2004 | 2005 | 2006 | 2007 |
|---|---|---|---|---|---|---|---|---|---|---|
| Balance sheet items as a percentage of average net consolidated assets | ||||||||||
| Interest-earning assets | 81.25 | 81.49 | 82.23 | 81.74 | 81.68 | 81.39 | 83.54 | 83.96 | 84.68 | 85.04 |
| Loans and leases (net) | 50.76 | 53.37 | 55.22 | 53.86 | 53.61 | 52.20 | 51.29 | 51.35 | 52.03 | 53.21 |
| Commercial and industrial | 18.07 | 19.20 | 19.87 | 18.82 | 16.16 | 12.98 | 10.54 | 10.61 | 11.20 | 11.58 |
| U.S. addressees | 11.76 | 13.14 | 13.95 | 13.42 | 11.69 | 9.40 | 7.49 | 7.74 | 8.08 | 8.05 |
| Foreign addressees | 6.31 | 6.06 | 5.92 | 5.41 | 4.47 | 3.59 | 3.06 | 2.87 | 3.12 | 3.53 |
| Consumer | 6.04 | 5.94 | 5.43 | 6.17 | 7.82 | 7.96 | 8.49 | 8.80 | 8.17 | 8.98 |
| Credit card | 1.30 | 1.36 | 1.34 | 1.69 | 2.90 | 2.81 | 3.19 | 3.60 | 3.05 | 3.87 |
| Installment and other | 4.74 | 4.58 | 4.09 | 4.48 | 4.92 | 5.15 | 5.30 | 5.21 | 5.13 | 5.11 |
| Real estate | 16.51 | 16.96 | 19.82 | 19.23 | 20.78 | 22.68 | 23.21 | 24.55 | 25.51 | 27.04 |
| In domestic offices | 15.08 | 15.55 | 18.48 | 18.05 | 19.70 | 21.74 | 22.21 | 23.52 | 24.50 | 26.00 |
| Construction and land development | .77 | .90 | .98 | 1.27 | 1.42 | 1.36 | 1.40 | 1.70 | 2.01 | 2.01 |
| Farmland | .09 | .10 | .11 | .11 | .12 | .10 | .10 | .10 | .10 | .09 |
| One- to four-family residential | 10.33 | 10.77 | 13.37 | 12.41 | 13.51 | 16.03 | 16.71 | 17.73 | 18.30 | 19.86 |
| Home equity | 1.72 | 1.54 | 1.61 | 1.78 | 2.35 | 2.96 | 4.04 | 5.22 | 5.40 | 5.46 |
| Other | 8.61 | 9.22 | 11.76 | 10.63 | 11.17 | 13.07 | 12.67 | 12.52 | 12.90 | 14.40 |
| Multifamily residential | .38 | .43 | .60 | .51 | .55 | .47 | .45 | .44 | .44 | .55 |
| Nonfarm nonresidential | 3.51 | 3.35 | 3.42 | 3.76 | 4.09 | 3.78 | 3.55 | 3.55 | 3.65 | 3.49 |
| In foreign offices | 1.43 | 1.41 | 1.34 | 1.18 | 1.08 | .94 | 1.00 | 1.03 | 1.01 | 1.03 |
| To depository institutions and acceptances of other banks | 4.05 | 4.34 | 3.78 | 3.23 | 3.20 | 3.54 | 4.10 | 3.15 | 2.97 | 1.71 |
| Foreign governments | .35 | .38 | .28 | .20 | .20 | .17 | .16 | .12 | .07 | .05 |
| Agricultural production | .28 | .26 | .23 | .28 | .23 | .19 | .22 | .20 | .20 | .17 |
| Other loans | 3.74 | 3.96 | 3.75 | 3.51 | 2.94 | 2.87 | 3.32 | 2.81 | 2.88 | 3.08 |
| Lease-financing receivables | 2.81 | 3.40 | 3.07 | 3.43 | 3.44 | 2.87 | 2.08 | 1.78 | 1.60 | 1.22 |
| Less: Unearned income on loans | -.06 | -.05 | -.04 | -.04 | -.08 | -.06 | -.04 | -.04 | -.02 | -.02 |
| Less: Loss reserves1 | -1.01 | -1.03 | -.97 | -.97 | -1.12 | -1.02 | -.80 | -.65 | -.56 | -.61 |
| Securities | 19.72 | 18.34 | 18.98 | 17.81 | 20.54 | 21.22 | 22.95 | 23.37 | 23.05 | 21.98 |
| Investment account | 12.12 | 13.08 | 13.71 | 12.14 | 14.35 | 15.31 | 15.99 | 15.58 | 15.12 | 12.81 |
| Debt | 11.64 | 12.57 | 13.03 | 11.88 | 14.13 | 15.11 | 15.83 | 15.44 | 14.97 | 12.66 |
| U.S. Treasury | 1.70 | 1.98 | 1.96 | .68 | .59 | .82 | .86 | .56 | .43 | .24 |
| U.S. government agency and corporation obligations | 6.31 | 6.35 | 6.59 | 6.84 | 8.69 | 9.20 | 9.92 | 9.69 | 9.48 | 8.02 |
| Government-backed mortgage pools | 5.13 | 5.03 | 4.88 | 4.99 | 6.38 | 7.59 | 8.64 | 8.65 | 8.64 | 7.53 |
| Collateralized mortgage obligations | .93 | .79 | .93 | 1.11 | 1.52 | .91 | .70 | .54 | .53 | .33 |
| Other | .26 | .52 | .78 | .74 | .79 | .70 | .58 | .50 | .32 | .16 |
| State and local government | .47 | .45 | .51 | .55 | .59 | .59 | .57 | .58 | .64 | .65 |
| Private mortgage-backed securities | .60 | .57 | .51 | .58 | .92 | 1.10 | .96 | 1.18 | 1.09 | 1.45 |
| Other | 2.57 | 3.22 | 3.47 | 3.22 | 3.34 | 3.40 | 3.52 | 3.43 | 3.33 | 2.30 |
| Equity | .47 | .51 | .68 | .26 | .22 | .20 | .16 | .14 | .15 | .16 |
| Trading account | 7.60 | 5.25 | 5.26 | 5.67 | 6.18 | 5.91 | 6.96 | 7.79 | 7.94 | 9.16 |
| Gross federal funds sold and reverse RPs | 7.81 | 6.64 | 5.02 | 6.38 | 5.26 | 5.79 | 6.37 | 6.96 | 7.60 | 7.47 |
| Interest-bearing balances at depositories | 2.96 | 3.14 | 3.01 | 3.69 | 2.28 | 2.18 | 2.93 | 2.28 | 1.99 | 2.38 |
| Non-interest-earning assets | 18.75 | 18.51 | 17.77 | 18.26 | 18.32 | 18.61 | 16.46 | 16.04 | 15.32 | 14.96 |
| Revaluation gains held in trading accounts | 7.62 | 6.66 | 5.66 | 5.48 | 5.40 | 5.79 | 4.45 | 3.50 | 3.07 | 3.03 |
| Other | 11.13 | 11.85 | 12.11 | 12.78 | 12.93 | 12.83 | 12.01 | 12.54 | 12.25 | 11.93 |
| Liabilities | 92.58 | 92.28 | 92.36 | 92.14 | 91.52 | 91.94 | 91.64 | 90.81 | 91.10 | 90.82 |
| Core deposits | 32.94 | 33.76 | 33.28 | 36.38 | 40.61 | 41.07 | 42.02 | 40.18 | 38.03 | 35.08 |
| Transaction deposits | 9.45 | 8.55 | 8.01 | 8.40 | 8.34 | 7.74 | 6.65 | 6.05 | 5.41 | 4.69 |
| Demand deposits | 8.46 | 7.83 | 7.28 | 7.50 | 7.40 | 6.72 | 5.43 | 4.90 | 4.32 | 3.80 |
| Other checkable deposits | .99 | .72 | .74 | .90 | .95 | 1.02 | 1.22 | 1.15 | 1.09 | .89 |
| Savings deposits (including MMDAs) | 17.07 | 18.94 | 19.24 | 22.21 | 26.82 | 28.99 | 31.54 | 30.11 | 28.11 | 25.55 |
| Small time deposits | 6.42 | 6.26 | 6.03 | 5.77 | 5.44 | 4.34 | 3.83 | 4.02 | 4.52 | 4.84 |
| Managed liabilities2 | 44.42 | 45.49 | 46.84 | 43.41 | 38.89 | 38.60 | 39.33 | 40.83 | 43.75 | 46.83 |
| Large time deposits | 5.04 | 5.19 | 5.55 | 5.46 | 5.13 | 5.53 | 5.21 | 6.28 | 6.85 | 6.13 |
| Deposits booked in foreign offices | 21.23 | 22.22 | 22.76 | 20.28 | 17.31 | 16.62 | 17.20 | 17.51 | 18.50 | 19.86 |
| Subordinated notes and debentures | 1.89 | 1.98 | 2.10 | 2.16 | 2.11 | 1.92 | 1.78 | 1.89 | 1.99 | 2.17 |
| Gross federal funds purchased and RPs | 9.78 | 8.84 | 8.89 | 9.04 | 8.83 | 8.62 | 7.79 | 8.39 | 9.51 | 8.42 |
| Other managed liabilities | 6.49 | 7.27 | 7.55 | 6.47 | 5.53 | 5.90 | 7.35 | 6.76 | 6.89 | 10.26 |
| Revaluation losses held in trading accounts | 7.67 | 6.51 | 5.69 | 5.10 | 4.63 | 4.88 | 3.95 | 3.21 | 2.83 | 2.78 |
| Other | 7.55 | 6.52 | 6.55 | 7.26 | 7.39 | 7.40 | 6.34 | 6.60 | 6.47 | 6.13 |
| Capital account | 7.42 | 7.72 | 7.64 | 7.86 | 8.48 | 8.06 | 8.36 | 9.19 | 8.90 | 9.18 |
| Memo | ||||||||||
| Commercial real estate loans3 | 5.61 | 5.69 | 5.87 | 6.68 | 6.92 | 6.31 | 5.99 | 6.33 | 6.73 | 6.64 |
| Other real estate owned4 | .09 | .06 | .04 | .04 | .03 | .03 | .03 | .02 | .03 | .05 |
| Mortgage-backed securities | 6.65 | 6.40 | 6.32 | 6.68 | 8.82 | 9.60 | 10.30 | 10.36 | 10.25 | 9.31 |
| Federal Home Loan Bank advances | n.a. | n.a. | n.a. | .82 | .82 | .84 | .79 | .63 | .75 | 2.33 |
| Average net consolidated assets (billions of dollars) | 1,820 | 1,935 | 2,234 | 2,527 | 2,785 | 3,148 | 3,654 | 4,232 | 4,759 | 5,469 |
| Effective interest rate (percent)5 | ||||||||||
| Rates earned | ||||||||||
| Interest-earning assets | 7.55 | 7.37 | 7.76 | 6.83 | 5.82 | 4.99 | 4.71 | 5.29 | 6.32 | 6.52 |
| Taxable equivalent | 7.57 | 7.39 | 7.78 | 6.86 | 5.85 | 5.01 | 4.73 | 5.31 | 6.34 | 6.54 |
| Loans and leases, gross | 8.21 | 7.99 | 8.46 | 7.50 | 6.52 | 5.76 | 5.52 | 6.15 | 7.36 | 7.33 |
| Net of loss provisions | 7.77 | 7.65 | 7.92 | 6.55 | 5.30 | 5.19 | 5.29 | 5.84 | 7.02 | 6.29 |
| Securities | 6.83 | 6.58 | 6.48 | 6.23 | 5.04 | 4.15 | 4.04 | 4.27 | 4.69 | 4.99 |
| Taxable equivalent | 6.89 | 6.65 | 6.55 | 6.31 | 5.11 | 4.21 | 4.10 | 4.32 | 4.75 | 5.04 |
| Investment account | 6.78 | 6.59 | 6.40 | 6.23 | 5.30 | 4.26 | 4.37 | 4.63 | 5.11 | 5.29 |
| U.S. Treasury securities and U.S. government agency obligations (excluding MBS) | n.a. | n.a. | n.a. | 5.01 | 3.74 | 2.62 | 2.92 | 3.29 | 4.15 | 4.15 |
| Mortgage-backed securities | n.a. | n.a. | n.a. | 6.42 | 5.55 | 4.51 | 4.83 | 4.92 | 5.30 | 5.41 |
| Other | n.a. | n.a. | n.a. | 6.34 | 5.30 | 4.28 | 3.76 | 4.26 | 4.81 | 5.08 |
| Trading account | 6.92 | 6.56 | 6.70 | 6.24 | 4.46 | 3.87 | 3.32 | 3.57 | 3.90 | 4.57 |
| Gross federal funds sold and reverse RPs | 5.20 | 4.52 | 4.93 | 3.86 | 2.20 | 1.60 | 1.43 | 2.46 | 4.07 | 5.06 |
| Interest-bearing balances at depositories | 7.16 | 7.22 | 7.43 | 3.73 | 3.40 | 2.49 | 1.80 | 4.06 | 5.59 | 5.36 |
| Rates paid | ||||||||||
| Interest-bearing liabilities | 4.94 | 4.52 | 5.03 | 3.78 | 2.33 | 1.67 | 1.62 | 2.52 | 3.74 | 3.87 |
| Interest-bearing deposits | 4.40 | 3.82 | 4.40 | 3.27 | 1.94 | 1.34 | 1.29 | 2.01 | 2.96 | 3.30 |
| In foreign offices | 5.83 | 4.99 | 5.67 | 4.02 | 2.59 | 1.74 | 1.81 | 2.77 | 3.88 | 4.28 |
| In domestic offices | 3.39 | 3.04 | 3.51 | 2.84 | 1.67 | 1.18 | 1.08 | 1.70 | 2.55 | 2.80 |
| Other checkable deposits | 1.67 | 1.44 | 1.61 | 1.67 | .93 | .80 | .97 | 2.27 | 2.46 | 2.36 |
| Savings deposits (including MMDAs) | 2.45 | 2.11 | 2.43 | 1.92 | 1.02 | .73 | .71 | 1.15 | 1.87 | 1.98 |
| Large time deposits6 | 4.53 | 4.36 | 5.32 | 4.40 | 3.26 | 2.36 | 2.14 | 3.06 | 4.32 | 4.72 |
| Other time deposits6 | 5.21 | 4.95 | 5.53 | 5.11 | 3.44 | 2.70 | 2.61 | 3.40 | 4.05 | 4.55 |
| Gross federal funds purchased and RPs | 5.18 | 4.53 | 5.47 | 3.81 | 2.02 | 1.39 | 1.59 | 3.11 | 4.63 | 5.15 |
| Other interest-bearing liabilities | 7.47 | 8.26 | 8.07 | 6.84 | 5.57 | 4.42 | 3.83 | 5.40 | 7.78 | 5.61 |
| Income and expense as a percentage of average net consolidated assets | ||||||||||
| Gross interest income | 6.21 | 6.01 | 6.39 | 5.55 | 4.77 | 4.05 | 3.94 | 4.47 | 5.46 | 5.61 |
| Taxable equivalent | 6.22 | 6.03 | 6.41 | 5.57 | 4.79 | 4.07 | 3.96 | 4.48 | 5.48 | 5.63 |
| Loans | 4.27 | 4.35 | 4.74 | 4.13 | 3.57 | 3.04 | 2.86 | 3.19 | 3.91 | 3.98 |
| Securities | .81 | .85 | .88 | .72 | .73 | .63 | .69 | .72 | .80 | .69 |
| Gross federal funds sold and reverse RPs | .42 | .30 | .25 | .25 | .12 | .10 | .10 | .18 | .31 | .38 |
| Other | .70 | .51 | .51 | .44 | .35 | .28 | .30 | .38 | .45 | .56 |
| Gross interest expense | 3.48 | 3.16 | 3.60 | 2.69 | 1.65 | 1.19 | 1.20 | 1.89 | 2.88 | 3.00 |
| Deposits | 2.20 | 1.97 | 2.33 | 1.74 | 1.05 | .74 | .74 | 1.17 | 1.72 | 1.87 |
| Gross federal funds purchased and RPs | .54 | .40 | .49 | .35 | .18 | .13 | .13 | .27 | .47 | .46 |
| Other | .74 | .79 | .78 | .59 | .41 | .33 | .33 | .45 | .69 | .68 |
| Net interest income | 2.73 | 2.84 | 2.78 | 2.87 | 3.12 | 2.86 | 2.74 | 2.58 | 2.58 | 2.61 |
| Taxable equivalent | 2.75 | 2.86 | 2.80 | 2.89 | 3.14 | 2.88 | 2.76 | 2.59 | 2.60 | 2.63 |
| Loss provisions7 | .31 | .26 | .38 | .59 | .73 | .35 | .16 | .20 | .22 | .60 |
| Non-interest income | 2.15 | 2.55 | 2.54 | 2.26 | 2.31 | 2.32 | 2.21 | 2.37 | 2.35 | 1.95 |
| Service charges on deposits | .33 | .37 | .40 | .44 | .48 | .46 | .45 | .42 | .41 | .40 |
| Fiduciary activities | .32 | .31 | .27 | .29 | .25 | .26 | .24 | .27 | .23 | .20 |
| Trading revenue | .33 | .46 | .48 | .43 | .32 | .30 | .23 | .31 | .37 | .05 |
| Interest rate exposures | .10 | .17 | .20 | .20 | .15 | .12 | .07 | .11 | .09 | .08 |
| Foreign exchange rate exposures | .20 | .19 | .18 | .14 | .14 | .14 | .12 | .12 | .14 | .09 |
| Other commodity and equity exposures | .03 | .09 | .11 | .08 | .03 | .04 | .04 | .07 | .13 | .06 |
| Other | 1.17 | 1.41 | 1.39 | 1.10 | 1.26 | 1.30 | 1.28 | 1.38 | 1.35 | 1.31 |
| Non-interest expense | 3.47 | 3.45 | 3.31 | 3.13 | 3.16 | 3.02 | 3.11 | 2.99 | 2.89 | 2.80 |
| Salaries, wages, and employee benefits | 1.45 | 1.57 | 1.46 | 1.38 | 1.41 | 1.39 | 1.34 | 1.38 | 1.39 | 1.32 |
| Occupancy | .47 | .50 | .47 | .45 | .46 | .45 | .43 | .43 | .40 | .37 |
| Other | 1.54 | 1.38 | 1.39 | 1.30 | 1.28 | 1.18 | 1.33 | 1.19 | 1.09 | 1.12 |
| Net non-interest expense | 1.32 | .90 | .77 | .87 | .85 | .70 | .91 | .62 | .54 | .85 |
| Gains on investment account securities | .11 | .03 | -.03 | .08 | .13 | .11 | .07 | * | -.01 | .02 |
| Income before taxes and extraordinary items | 1.22 | 1.71 | 1.60 | 1.48 | 1.67 | 1.92 | 1.74 | 1.75 | 1.82 | 1.18 |
| Taxes | .44 | .66 | .60 | .49 | .56 | .63 | .56 | .57 | .59 | .33 |
| Extraordinary items, net of income taxes | * | * | * | -.01 | * | * | * | * | .02 | * |
| Net income | .78 | 1.05 | 1.00 | .99 | 1.11 | 1.29 | 1.18 | 1.18 | 1.25 | .85 |
| Cash dividends declared | .53 | .79 | .86 | .66 | 1.05 | .99 | .65 | .59 | .64 | .60 |
| Retained income | .25 | .26 | .13 | .32 | .06 | .30 | .53 | .59 | .62 | .25 |
| Memo: Return on equity | 10.53 | 13.58 | 13.04 | 12.55 | 13.14 | 16.06 | 14.07 | 12.86 | 14.08 | 9.23 |
Note: Data are as of April 16, 2008.
1. Includes allocated transfer risk reserve. Return to table
2. Measured as the sum of large time deposits in domestic offices, deposits booked in foreign offices, subordinated notes and debentures, federal funds purchased and securities sold under repurchase agreements, Federal Home Loan Bank advances, and other borrowed money. Return to table
3. Measured as the sum of construction and land development loans secured by real estate; real estate loans secured by nonfarm nonresidential properties or by multifamily residential properties; and loans to finance commercial real estate, construction, and land development activities not secured by real estate. Return to table
4. Other real estate owned is a component of other non-interest-earning assets. Return to table
5. When possible, based on the average of quarterly balance sheet data reported on schedule RC-K of the quarterly Call Report. Return to table
6. Before 1997, large time deposit open accounts were included in other time deposits. Return to table
7. Includes provisions for allocated transfer risk. Return to table
* In absolute value, less than 0.005 percent. Return to table
n.a. Not available. Return to table
MMDA Money market deposit account. Return to table
RP Repurchase agreement. Return to table
MBS Mortgage-backed securities. Return to table
| C. Banks ranked 11 through 100 by assets | ||||||||||
| Item | 1998 | 1999 | 2000 | 2001 | 2002 | 2003 | 2004 | 2005 | 2006 | 2007 |
|---|---|---|---|---|---|---|---|---|---|---|
| Balance sheet items as a percentage of average net consolidated assets | ||||||||||
| Interest-earning assets | 87.85 | 88.40 | 88.67 | 88.09 | 88.34 | 88.10 | 88.18 | 87.87 | 87.05 | 87.01 |
| Loans and leases (net) | 64.37 | 64.22 | 64.88 | 62.14 | 60.00 | 59.48 | 60.63 | 63.37 | 62.77 | 60.99 |
| Commercial and industrial | 18.92 | 19.39 | 18.19 | 15.84 | 13.27 | 11.96 | 11.90 | 12.17 | 12.13 | 12.74 |
| U.S. addressees | 17.59 | 18.17 | 17.64 | 15.36 | 12.94 | 11.66 | 11.64 | 11.91 | 11.81 | 12.41 |
| Foreign addressees | 1.33 | 1.22 | .55 | .48 | .33 | .30 | .26 | .27 | .32 | .33 |
| Consumer | 14.52 | 13.58 | 13.79 | 13.20 | 12.79 | 12.57 | 12.74 | 12.84 | 11.94 | 9.99 |
| Credit card | 7.67 | 6.79 | 6.97 | 7.05 | 6.56 | 6.35 | 6.90 | 7.45 | 7.12 | 5.29 |
| Installment and other | 6.86 | 6.79 | 6.82 | 6.15 | 6.22 | 6.21 | 5.83 | 5.39 | 4.82 | 4.70 |
| Real estate | 24.59 | 24.79 | 26.21 | 27.29 | 28.94 | 30.67 | 32.16 | 34.89 | 35.23 | 33.53 |
| In domestic offices | 24.42 | 24.61 | 26.12 | 27.21 | 28.88 | 30.54 | 31.96 | 34.73 | 35.03 | 33.34 |
| Construction and land development | 2.03 | 2.44 | 3.00 | 3.31 | 3.36 | 3.22 | 3.51 | 4.21 | 5.27 | 5.95 |
| Farmland | .17 | .19 | .22 | .23 | .22 | .20 | .19 | .19 | .17 | .21 |
| One- to four-family residential | 14.86 | 14.14 | 14.51 | 15.51 | 17.05 | 18.79 | 19.52 | 21.05 | 20.27 | 17.80 |
| Home equity | 2.17 | 2.08 | 2.49 | 2.90 | 3.92 | 4.74 | 5.90 | 6.04 | 5.01 | 4.01 |
| Other | 12.69 | 12.06 | 12.02 | 12.60 | 13.13 | 14.05 | 13.62 | 15.01 | 15.26 | 13.79 |
| Multifamily residential | 1.00 | 1.02 | 1.11 | 1.16 | 1.20 | 1.32 | 1.34 | 1.45 | 1.45 | 1.26 |
| Nonfarm nonresidential | 6.36 | 6.81 | 7.28 | 6.99 | 7.05 | 7.00 | 7.41 | 7.83 | 7.86 | 8.13 |
| In foreign offices | .18 | .19 | .09 | .09 | .06 | .13 | .20 | .16 | .21 | .18 |
| To depository institutions and acceptances of other banks | 1.09 | .93 | 1.05 | 1.40 | 1.44 | 1.21 | .54 | .56 | .45 | 1.05 |
| Foreign governments | .06 | .06 | .03 | .03 | .02 | .02 | .01 | .02 | .01 | .01 |
| Agricultural production | .33 | .33 | .37 | .32 | .27 | .23 | .19 | .19 | .18 | .21 |
| Other loans | 3.35 | 2.99 | 2.57 | 2.03 | 1.80 | 1.59 | 1.87 | 1.62 | 1.88 | 2.43 |
| Lease-financing receivables | 2.71 | 3.28 | 3.82 | 3.18 | 2.65 | 2.35 | 2.30 | 2.07 | 1.83 | 1.80 |
| Less: Unearned income on loans | -.04 | -.04 | -.03 | -.02 | -.02 | -.02 | -.02 | -.01 | -.01 | -.01 |
| Less: Loss reserves1 | -1.16 | -1.11 | -1.12 | -1.13 | -1.17 | -1.10 | -1.06 | -.97 | -.87 | -.75 |
| Securities | 16.66 | 17.78 | 17.32 | 19.00 | 20.30 | 21.16 | 21.28 | 19.96 | 19.22 | 19.89 |
| Investment account | 16.13 | 17.27 | 16.10 | 17.71 | 19.17 | 20.09 | 20.12 | 18.80 | 17.72 | 17.99 |
| Debt | 15.58 | 16.62 | 15.50 | 17.32 | 18.82 | 19.88 | 19.96 | 18.69 | 17.60 | 17.88 |
| U.S. Treasury | 2.25 | 1.70 | 1.12 | .67 | .74 | .95 | .89 | .60 | .44 | .38 |
| U.S. government agency and corporation obligations | 9.93 | 10.57 | 9.70 | 10.09 | 11.45 | 12.99 | 12.80 | 11.62 | 10.07 | 9.06 |
| Government-backed mortgage pools | 4.98 | 5.12 | 4.31 | 5.19 | 6.00 | 6.08 | 5.74 | 4.83 | 4.04 | 3.73 |
| Collateralized mortgage obligations | 2.83 | 2.89 | 2.55 | 2.42 | 2.79 | 3.72 | 3.42 | 3.39 | 2.94 | 2.68 |
| Other | 2.12 | 2.56 | 2.84 | 2.48 | 2.65 | 3.19 | 3.64 | 3.40 | 3.10 | 2.65 |
| State and local government | .92 | .99 | .96 | .99 | .97 | .95 | .96 | .98 | 1.01 | 1.16 |
| Private mortgage-backed securities | .96 | 1.33 | 1.66 | 2.01 | 2.13 | 2.14 | 2.65 | 3.58 | 4.29 | 4.60 |
| Other | 1.53 | 2.03 | 2.06 | 3.56 | 3.53 | 2.85 | 2.66 | 1.90 | 1.78 | 2.67 |
| Equity | .55 | .65 | .60 | .39 | .34 | .21 | .16 | .11 | .12 | .12 |
| Trading account | .54 | .51 | 1.22 | 1.29 | 1.13 | 1.07 | 1.16 | 1.16 | 1.50 | 1.90 |
| Gross federal funds sold and reverse RPs | 3.57 | 3.34 | 3.76 | 4.06 | 4.71 | 4.20 | 2.98 | 2.30 | 2.84 | 3.41 |
| Interest-bearing balances at depositories | 3.24 | 3.06 | 2.71 | 2.88 | 3.33 | 3.26 | 3.29 | 2.24 | 2.22 | 2.72 |
| Non-interest-earning assets | 12.15 | 11.60 | 11.33 | 11.91 | 11.66 | 11.90 | 11.82 | 12.13 | 12.95 | 12.99 |
| Revaluation gains held in trading accounts | .75 | .56 | .40 | .55 | .47 | .60 | .42 | .33 | .30 | .48 |
| Other | 11.40 | 11.04 | 10.92 | 11.37 | 11.19 | 11.30 | 11.40 | 11.80 | 12.65 | 12.51 |
| Liabilities | 91.63 | 91.66 | 91.57 | 91.15 | 90.79 | 90.65 | 89.87 | 88.86 | 88.08 | 88.40 |
| Core deposits | 49.89 | 48.33 | 46.28 | 46.28 | 47.07 | 47.93 | 46.55 | 48.18 | 46.84 | 47.44 |
| Transaction deposits | 14.15 | 12.12 | 9.93 | 8.37 | 7.49 | 7.29 | 7.06 | 6.64 | 5.74 | 5.15 |
| Demand deposits | 12.39 | 10.52 | 8.61 | 7.17 | 6.32 | 5.96 | 5.65 | 5.35 | 4.54 | 3.90 |
| Other checkable deposits | 1.75 | 1.60 | 1.32 | 1.20 | 1.17 | 1.33 | 1.41 | 1.29 | 1.20 | 1.25 |
| Savings deposits (including MMDAs) | 22.51 | 23.89 | 24.02 | 26.62 | 30.07 | 32.34 | 31.75 | 33.33 | 32.66 | 32.99 |
| Small time deposits | 13.24 | 12.31 | 12.33 | 11.28 | 9.51 | 8.30 | 7.74 | 8.20 | 8.44 | 9.30 |
| Managed liabilities2 | 38.11 | 39.85 | 41.98 | 40.81 | 39.48 | 38.12 | 39.29 | 37.04 | 37.60 | 37.02 |
| Large time deposits | 7.83 | 8.17 | 9.54 | 9.72 | 8.99 | 8.20 | 8.76 | 10.10 | 11.44 | 10.20 |
| Deposits booked in foreign offices | 8.37 | 8.20 | 7.56 | 7.05 | 6.28 | 6.54 | 7.21 | 6.02 | 6.43 | 8.52 |
| Subordinated notes and debentures | 1.66 | 1.71 | 1.54 | 1.53 | 1.44 | 1.38 | 1.39 | 1.31 | 1.32 | 1.40 |
| Gross federal funds purchased and RPs | 9.48 | 9.78 | 9.28 | 9.71 | 9.66 | 9.69 | 8.95 | 7.17 | 6.74 | 6.79 |
| Other managed liabilities | 10.77 | 11.99 | 14.07 | 12.79 | 13.11 | 12.30 | 12.97 | 12.44 | 11.66 | 10.10 |
| Revaluation losses held in trading accounts | .76 | .58 | .41 | .52 | .44 | .56 | .40 | .34 | .29 | .47 |
| Other | 2.87 | 2.91 | 2.91 | 3.54 | 3.80 | 4.05 | 3.64 | 3.30 | 3.35 | 3.48 |
| Capital account | 8.37 | 8.34 | 8.43 | 8.85 | 9.21 | 9.35 | 10.13 | 11.14 | 11.92 | 11.60 |
| Memo | ||||||||||
| Commercial real estate loans3 | 10.11 | 11.00 | 12.06 | 12.06 | 12.24 | 12.10 | 12.85 | 13.93 | 15.05 | 15.95 |
| Other real estate owned4 | .04 | .03 | .03 | .04 | .05 | .06 | .05 | .04 | .05 | .06 |
| Mortgage-backed securities | 8.76 | 9.34 | 8.52 | 9.63 | 10.93 | 11.93 | 11.81 | 11.81 | 11.27 | 11.01 |
| Federal Home Loan Bank advances | n.a. | n.a. | n.a. | 4.07 | 4.85 | 4.75 | 4.65 | 5.19 | 5.54 | 5.35 |
| Average net consolidated assets (billions of dollars) | 1,745 | 1,879 | 2,031 | 2,130 | 2,124 | 2,287 | 2,376 | 2,403 | 2,579 | 2,798 |
| Effective interest rate (percent)5 | ||||||||||
| Rates earned | ||||||||||
| Interest-earning assets | 8.12 | 7.90 | 8.44 | 7.54 | 6.03 | 5.30 | 5.21 | 5.98 | 6.93 | 6.87 |
| Taxable equivalent | 8.16 | 7.94 | 8.48 | 7.58 | 6.07 | 5.33 | 5.24 | 6.02 | 6.97 | 6.91 |
| Loans and leases, gross | 8.81 | 8.56 | 9.14 | 8.26 | 6.80 | 6.11 | 5.98 | 6.61 | 7.58 | 7.45 |
| Net of loss provisions | 8.14 | 7.86 | 8.25 | 6.96 | 5.59 | 5.11 | 5.19 | 5.89 | 7.04 | 6.64 |
| Securities | 6.31 | 6.41 | 6.64 | 5.96 | 4.79 | 3.80 | 3.63 | 4.18 | 4.99 | 5.25 |
| Taxable equivalent | 6.46 | 6.55 | 6.77 | 6.08 | 4.91 | 3.90 | 3.73 | 4.29 | 5.10 | 5.37 |
| Investment account | 6.33 | 6.43 | 6.66 | 6.04 | 4.86 | 3.87 | 3.64 | 4.11 | 4.84 | 5.18 |
| U.S. Treasury securities and U.S. government agency obligations (excluding MBS) | n.a. | n.a. | n.a. | 5.83 | 4.28 | 3.17 | 2.94 | 3.47 | 4.28 | 4.85 |
| Mortgage-backed securities | n.a. | n.a. | n.a. | 6.60 | 5.34 | 4.20 | 4.02 | 4.34 | 5.02 | 5.23 |
| Other | n.a. | n.a. | n.a. | 5.13 | 4.22 | 3.61 | 3.29 | 4.06 | 4.87 | 5.28 |
| Trading account | 5.86 | 5.62 | 6.25 | 4.83 | 3.59 | 2.56 | 3.39 | 5.30 | 6.74 | 5.94 |
| Gross federal funds sold and reverse RPs | 5.46 | 5.13 | 6.06 | 3.86 | 1.68 | 1.14 | 1.25 | 3.24 | 4.96 | 5.12 |
| Interest-bearing balances at depositories | 5.67 | 4.82 | 5.49 | 4.38 | 2.46 | 1.93 | 2.27 | 3.20 | 4.24 | 4.84 |
| Rates paid | ||||||||||
| Interest-bearing liabilities | 4.55 | 4.23 | 4.97 | 3.94 | 2.22 | 1.61 | 1.56 | 2.44 | 3.48 | 3.72 |
| Interest-bearing deposits | 4.15 | 3.80 | 4.42 | 3.60 | 1.96 | 1.35 | 1.29 | 2.03 | 3.07 | 3.33 |
| In foreign offices | 5.22 | 4.71 | 5.38 | 3.67 | 1.70 | 1.23 | 1.42 | 2.76 | 4.10 | 4.01 |
| In domestic offices | 3.96 | 3.64 | 4.26 | 3.60 | 1.99 | 1.36 | 1.27 | 1.95 | 2.95 | 3.22 |
| Other checkable deposits | 2.41 | 2.06 | 2.57 | 2.32 | .94 | .64 | .72 | 1.29 | 2.12 | 2.60 |
| Savings deposits (including MMDAs) | 2.76 | 2.51 | 2.94 | 2.30 | 1.08 | .66 | .65 | 1.30 | 2.14 | 2.44 |
| Large time deposits6 | 5.32 | 5.00 | 5.88 | 5.11 | 3.37 | 2.70 | 2.49 | 3.31 | 4.45 | 4.46 |
| Other time deposits6 | 5.35 | 5.08 | 5.73 | 5.42 | 3.68 | 2.95 | 2.58 | 3.03 | 4.09 | 4.74 |
| Gross federal funds purchased and RPs | 5.22 | 4.91 | 6.02 | 3.86 | 1.73 | 1.20 | 1.37 | 3.04 | 4.46 | 4.71 |
| Other interest-bearing liabilities | 5.75 | 5.44 | 6.25 | 5.29 | 3.65 | 3.04 | 2.77 | 3.81 | 4.90 | 5.25 |
| Income and expense as a percentage of average net consolidated assets | ||||||||||
| Gross interest income | 7.15 | 7.03 | 7.54 | 6.70 | 5.31 | 4.67 | 4.63 | 5.28 | 6.08 | 5.99 |
| Taxable equivalent | 7.19 | 7.07 | 7.57 | 6.73 | 5.34 | 4.70 | 4.65 | 5.31 | 6.11 | 6.02 |
| Loans | 5.78 | 5.60 | 6.05 | 5.28 | 4.15 | 3.72 | 3.71 | 4.27 | 4.85 | 4.60 |
| Securities | 1.00 | 1.11 | 1.09 | 1.06 | .90 | .75 | .73 | .77 | .87 | .93 |
| Gross federal funds sold and reverse RPs | .19 | .18 | .22 | .15 | .08 | .04 | .03 | .06 | .13 | .17 |
| Other | .18 | .14 | .18 | .21 | .18 | .15 | .15 | .18 | .23 | .29 |
| Gross interest expense | 3.45 | 3.29 | 3.96 | 3.14 | 1.77 | 1.30 | 1.26 | 1.94 | 2.78 | 2.96 |
| Deposits | 2.23 | 2.04 | 2.41 | 2.01 | 1.09 | .77 | .74 | 1.18 | 1.84 | 2.04 |
| Gross federal funds purchased and RPs | .51 | .51 | .56 | .38 | .17 | .12 | .13 | .23 | .30 | .32 |
| Other | .71 | .74 | .99 | .75 | .51 | .41 | .40 | .53 | .63 | .59 |
| Net interest income | 3.70 | 3.75 | 3.58 | 3.56 | 3.54 | 3.37 | 3.36 | 3.34 | 3.30 | 3.03 |
| Taxable equivalent | 3.73 | 3.78 | 3.61 | 3.59 | 3.57 | 3.40 | 3.39 | 3.37 | 3.33 | 3.06 |
| Loss provisions7 | .53 | .55 | .68 | .91 | .80 | .67 | .55 | .52 | .41 | .55 |
| Non-interest income | 3.09 | 3.38 | 3.18 | 3.35 | 3.30 | 3.29 | 3.09 | 2.81 | 2.91 | 2.73 |
| Service charges on deposits | .42 | .42 | .42 | .42 | .42 | .42 | .40 | .37 | .35 | .33 |
| Fiduciary activities | .49 | .48 | .52 | .42 | .42 | .37 | .42 | .35 | .41 | .54 |
| Trading revenue | .09 | .08 | .07 | .08 | .08 | .08 | .07 | .06 | .07 | .09 |
| Interest rate exposures | .03 | .02 | .02 | .04 | .04 | .04 | -.01 | -.01 | .02 | * |
| Foreign exchange rate exposures | .06 | .05 | .04 | .03 | .04 | .04 | .05 | .04 | .05 | .08 |
| Other commodity and equity exposures | * | * | * | * | * | .01 | .03 | .02 | -.01 | * |
| Other | 2.09 | 2.40 | 2.18 | 2.43 | 2.37 | 2.41 | 2.20 | 2.03 | 2.09 | 1.77 |
| Non-interest expense | 4.05 | 4.15 | 4.00 | 3.95 | 3.73 | 3.64 | 3.55 | 3.36 | 3.34 | 3.45 |
| Salaries, wages, and employee benefits | 1.53 | 1.54 | 1.44 | 1.47 | 1.49 | 1.47 | 1.45 | 1.37 | 1.34 | 1.32 |
| Occupancy | .46 | .46 | .43 | .42 | .40 | .41 | .39 | .37 | .33 | .34 |
| Other | 2.06 | 2.16 | 2.14 | 2.07 | 1.84 | 1.76 | 1.70 | 1.62 | 1.68 | 1.79 |
| Net non-interest expense | .95 | .77 | .82 | .60 | .43 | .35 | .45 | .55 | .43 | .71 |
| Gains on investment account securities | .03 | -.01 | -.05 | .09 | .10 | .06 | .03 | * | -.03 | -.05 |
| Income before taxes and extraordinary items | 2.24 | 2.42 | 2.02 | 2.14 | 2.41 | 2.42 | 2.39 | 2.27 | 2.43 | 1.71 |
| Taxes | .78 | .87 | .70 | .74 | .82 | .82 | .82 | .77 | .83 | .59 |
| Extraordinary items, net of income taxes | * | * | * | * | * | * | * | .01 | .07 | -.05 |
| Net income | 1.45 | 1.55 | 1.32 | 1.39 | 1.59 | 1.59 | 1.57 | 1.50 | 1.67 | 1.06 |
| Cash dividends declared | .96 | 1.17 | .94 | .96 | .99 | 1.05 | .95 | 1.00 | 1.37 | 1.26 |
| Retained income | .49 | .38 | .38 | .43 | .60 | .54 | .62 | .50 | .30 | -.20 |
| Memo: Return on equity | 17.37 | 18.59 | 15.72 | 15.74 | 17.24 | 17.03 | 15.54 | 13.48 | 14.05 | 9.16 |
Note: Data are as of April 16, 2008.
1. Includes allocated transfer risk reserve. Return to table
2. Measured as the sum of large time deposits in domestic offices, deposits booked in foreign offices, subordinated notes and debentures, federal funds purchased and securities sold under repurchase agreements, Federal Home Loan Bank advances, and other borrowed money. Return to table
3. Measured as the sum of construction and land development loans secured by real estate; real estate loans secured by nonfarm nonresidential properties or by multifamily residential properties; and loans to finance commercial real estate, construction, and land development activities not secured by real estate. Return to table
4. Other real estate owned is a component of other non-interest-earning assets. Return to table
5. When possible, based on the average of quarterly balance sheet data reported on schedule RC-K of the quarterly Call Report. Return to table
6. Before 1997, large time deposit open accounts were included in other time deposits. Return to table
7. Includes provisions for allocated transfer risk. Return to table
* In absolute value, less than 0.005 percent. Return to table
n.a. Not available. Return to table
MMDA Money market deposit account. Return to table
RP Repurchase agreement. Return to table
MBS Mortgage-backed securities. Return to table
| D. Banks ranked 101 through 1,000 by assets | ||||||||||
| Item | 1998 | 1999 | 2000 | 2001 | 2002 | 2003 | 2004 | 2005 | 2006 | 2007 |
|---|---|---|---|---|---|---|---|---|---|---|
| Balance sheet items as a percentage of average net consolidated assets | ||||||||||
| Interest-earning assets | 91.38 | 91.68 | 91.50 | 91.16 | 91.36 | 91.34 | 91.56 | 91.31 | 91.07 | 91.29 |
| Loans and leases (net) | 61.23 | 61.48 | 62.15 | 62.46 | 61.46 | 61.32 | 63.33 | 65.15 | 67.04 | 68.85 |
| Commercial and industrial | 12.45 | 12.66 | 12.95 | 13.03 | 12.38 | 11.51 | 11.52 | 11.79 | 11.68 | 12.08 |
| U.S. addressees | 12.12 | 12.34 | 12.60 | 12.65 | 12.06 | 11.20 | 11.21 | 11.49 | 11.45 | 11.80 |
| Foreign addressees | .32 | .32 | .36 | .38 | .31 | .31 | .31 | .30 | .23 | .27 |
| Consumer | 12.56 | 10.77 | 10.19 | 9.76 | 8.13 | 6.76 | 6.33 | 5.38 | 5.50 | 5.35 |
| Credit card | 4.78 | 3.37 | 3.27 | 3.65 | 2.63 | 1.79 | 1.91 | 1.20 | 1.63 | 1.88 |
| Installment and other | 7.78 | 7.41 | 6.92 | 6.11 | 5.50 | 4.97 | 4.42 | 4.18 | 3.87 | 3.46 |
| Real estate | 33.83 | 35.89 | 36.93 | 37.64 | 38.93 | 40.97 | 43.38 | 45.88 | 47.88 | 49.49 |
| In domestic offices | 33.81 | 35.87 | 36.91 | 37.62 | 38.90 | 40.93 | 43.32 | 45.81 | 47.78 | 49.40 |
| Construction and land development | 2.87 | 3.48 | 4.15 | 4.90 | 5.40 | 5.90 | 7.01 | 8.87 | 11.01 | 12.85 |
| Farmland | .56 | .58 | .65 | .66 | .73 | .80 | .91 | .99 | 1.07 | 1.16 |
| One- to four-family residential | 18.14 | 18.26 | 17.17 | 16.18 | 15.39 | 15.71 | 15.33 | 15.18 | 14.76 | 14.08 |
| Home equity | 2.14 | 1.99 | 2.10 | 2.21 | 2.51 | 2.92 | 3.46 | 3.61 | 3.25 | 3.01 |
| Other | 16.00 | 16.26 | 15.06 | 13.97 | 12.88 | 12.79 | 11.87 | 11.57 | 11.51 | 11.07 |
| Multifamily residential | 1.25 | 1.44 | 1.58 | 1.69 | 1.83 | 2.00 | 2.24 | 2.37 | 2.32 | 2.33 |
| Nonfarm nonresidential | 10.99 | 12.11 | 13.36 | 14.18 | 15.55 | 16.52 | 17.82 | 18.40 | 18.63 | 18.98 |
| In foreign offices | .02 | .02 | .02 | .02 | .03 | .05 | .06 | .08 | .10 | .09 |
| To depository institutions and acceptances of other banks | .52 | .46 | .37 | .38 | .37 | .37 | .25 | .13 | .14 | .14 |
| Foreign governments | .03 | .03 | .03 | .03 | .02 | .02 | .01 | * | * | * |
| Agricultural production | .80 | .78 | .82 | .85 | .86 | .83 | .82 | .81 | .84 | .88 |
| Other loans | 1.30 | 1.25 | 1.22 | 1.22 | 1.18 | 1.25 | 1.32 | 1.36 | 1.20 | 1.22 |
| Lease-financing receivables | .99 | .78 | .75 | .74 | .75 | .67 | .75 | .75 | .75 | .65 |
| Less: Unearned income on loans | -.09 | -.08 | -.08 | -.07 | -.06 | -.06 | -.06 | -.06 | -.06 | -.06 |
| Less: Loss reserves1 | -1.15 | -1.06 | -1.04 | -1.12 | -1.09 | -1.02 | -.98 | -.90 | -.88 | -.91 |
| Securities | 24.19 | 25.18 | 24.34 | 22.81 | 23.85 | 24.37 | 23.59 | 21.59 | 19.55 | 18.30 |
| Investment account | 24.08 | 25.10 | 24.25 | 22.70 | 23.80 | 24.23 | 23.54 | 21.51 | 19.47 | 18.10 |
| Debt | 23.39 | 24.34 | 23.46 | 22.27 | 23.30 | 23.80 | 23.18 | 21.22 | 19.20 | 17.69 |
| U.S. Treasury | 3.91 | 2.53 | 1.81 | 1.32 | 1.23 | 1.00 | 1.02 | .83 | .59 | .47 |
| U.S. government agency and corporation obligations | 15.08 | 16.28 | 15.56 | 14.70 | 15.85 | 16.96 | 16.70 | 15.06 | 13.55 | 12.32 |
| Government-backed mortgage pools | 6.45 | 6.72 | 6.22 | 6.27 | 6.56 | 7.03 | 6.80 | 5.73 | 4.83 | 4.57 |
| Collateralized mortgage obligations | 3.21 | 3.52 | 3.04 | 3.08 | 3.69 | 3.69 | 3.41 | 3.16 | 2.81 | 2.60 |
| Other | 5.43 | 6.04 | 6.30 | 5.35 | 5.60 | 6.24 | 6.49 | 6.17 | 5.90 | 5.15 |
| State and local government | 2.69 | 2.90 | 2.91 | 2.90 | 2.89 | 2.95 | 2.92 | 2.79 | 2.74 | 2.77 |
| Private mortgage-backed securities | .65 | 1.03 | .99 | .94 | .99 | .87 | 1.08 | 1.17 | 1.08 | 1.01 |
| Other | 1.06 | 1.60 | 2.19 | 2.42 | 2.34 | 2.01 | 1.46 | 1.37 | 1.24 | 1.12 |
| Equity | .69 | .77 | .80 | .43 | .50 | .43 | .36 | .29 | .27 | .41 |
| Trading account | .11 | .08 | .09 | .11 | .05 | .14 | .05 | .08 | .07 | .20 |
| Gross federal funds sold and reverse RPs | 4.16 | 3.35 | 3.40 | 4.20 | 4.15 | 3.85 | 2.95 | 2.82 | 2.81 | 2.57 |
| Interest-bearing balances at depositories | 1.80 | 1.68 | 1.60 | 1.68 | 1.89 | 1.80 | 1.69 | 1.76 | 1.67 | 1.57 |
| Non-interest-earning assets | 8.62 | 8.32 | 8.50 | 8.84 | 8.64 | 8.66 | 8.44 | 8.69 | 8.93 | 8.71 |
| Revaluation gains held in trading accounts | * | .01 | .02 | .01 | .01 | * | * | * | .03 | .04 |
| Other | 8.62 | 8.31 | 8.49 | 8.84 | 8.64 | 8.66 | 8.44 | 8.68 | 8.90 | 8.67 |
| Liabilities | 90.55 | 90.90 | 90.95 | 90.32 | 89.93 | 89.69 | 89.18 | 89.11 | 89.01 | 88.86 |
| Core deposits | 63.87 | 62.48 | 60.80 | 60.34 | 61.27 | 61.33 | 60.40 | 59.07 | 58.04 | 59.68 |
| Transaction deposits | 16.08 | 13.93 | 12.29 | 11.48 | 11.37 | 11.51 | 11.77 | 11.16 | 9.81 | 8.43 |
| Demand deposits | 11.87 | 10.19 | 8.97 | 8.23 | 8.05 | 7.97 | 8.13 | 7.87 | 6.99 | 5.94 |
| Other checkable deposits | 4.22 | 3.75 | 3.32 | 3.25 | 3.32 | 3.54 | 3.64 | 3.28 | 2.83 | 2.49 |
| Savings deposits (including MMDAs) | 26.43 | 28.56 | 28.55 | 29.40 | 32.34 | 34.02 | 34.42 | 33.77 | 32.82 | 32.89 |
| Small time deposits | 21.36 | 19.98 | 19.96 | 19.46 | 17.55 | 15.80 | 14.20 | 14.14 | 15.41 | 18.36 |
| Managed liabilities2 | 24.65 | 26.33 | 28.01 | 27.75 | 26.57 | 26.38 | 26.98 | 28.38 | 29.32 | 27.51 |
| Large time deposits | 10.09 | 10.29 | 11.98 | 12.60 | 12.16 | 11.90 | 12.12 | 13.64 | 15.21 | 14.42 |
| Deposits booked in foreign offices | 1.31 | 1.20 | 1.28 | 1.24 | .88 | .64 | .65 | .57 | .52 | .57 |
| Subordinated notes and debentures | .37 | .35 | .30 | .31 | .34 | .35 | .35 | .27 | .24 | .22 |
| Gross federal funds purchased and RPs | 6.15 | 6.90 | 6.30 | 5.76 | 5.27 | 5.36 | 5.52 | 5.55 | 5.40 | 5.33 |
| Other managed liabilities | 6.73 | 7.58 | 8.15 | 7.84 | 7.90 | 8.13 | 8.34 | 8.35 | 7.94 | 6.97 |
| Revaluation losses held in trading accounts | .01 | .01 | * | .01 | .01 | * | * | * | .01 | .01 |
| Other | 2.02 | 2.09 | 2.13 | 2.23 | 2.08 | 1.98 | 1.81 | 1.66 | 1.64 | 1.66 |
| Capital account | 9.45 | 9.10 | 9.05 | 9.68 | 10.07 | 10.31 | 10.82 | 10.89 | 10.99 | 11.14 |
| Memo | ||||||||||
| Commercial real estate loans3 | 15.33 | 17.27 | 19.32 | 21.03 | 23.06 | 24.64 | 27.28 | 29.85 | 32.22 | 34.52 |
| Other real estate owned4 | .09 | .08 | .07 | .08 | .10 | .11 | .10 | .08 | .08 | .11 |
| Mortgage-backed securities | 10.31 | 11.27 | 10.25 | 10.29 | 11.24 | 11.60 | 11.29 | 10.07 | 8.72 | 8.18 |
| Federal Home Loan Bank advances | n.a. | n.a. | n.a. | 5.27 | 5.71 | 6.29 | 6.46 | 6.43 | 6.11 | 5.53 |
| Average net consolidated assets (billions of dollars) | 938 | 974 | 987 | 1,002 | 1,022 | 1,072 | 1,080 | 1,152 | 1,249 | 1,267 |
| Effective interest rate (percent)5 | ||||||||||
| Rates earned | ||||||||||
| Interest-earning assets | 8.38 | 7.83 | 8.48 | 7.85 | 6.42 | 5.58 | 5.46 | 6.11 | 7.01 | 7.32 |
| Taxable equivalent | 8.47 | 7.92 | 8.56 | 7.94 | 6.50 | 5.66 | 5.53 | 6.18 | 7.08 | 7.39 |
| Loans and leases, gross | 9.41 | 8.74 | 9.42 | 8.76 | 7.30 | 6.55 | 6.25 | 6.89 | 7.79 | 8.02 |
| Net of loss provisions | 8.78 | 8.26 | 8.75 | 7.87 | 6.55 | 6.00 | 5.87 | 6.63 | 7.54 | 7.47 |
| Securities | 6.30 | 6.04 | 6.45 | 5.96 | 4.95 | 3.81 | 3.79 | 4.03 | 4.53 | 4.86 |
| Taxable equivalent | 6.57 | 6.29 | 6.71 | 6.24 | 5.21 | 4.06 | 4.04 | 4.28 | 4.80 | 5.14 |
| Investment account | 6.30 | 6.03 | 6.45 | 5.96 | 4.92 | 3.82 | 3.78 | 4.02 | 4.53 | 4.86 |
| U.S. Treasury securities and U.S. government agency obligations (excluding MBS) | n.a. | n.a. | n.a. | 5.85 | 4.54 | 3.42 | 3.15 | 3.47 | 4.19 | 4.74 |
| Mortgage-backed securities | n.a. | n.a. | n.a. | 6.33 | 5.38 | 3.95 | 4.01 | 4.23 | 4.64 | 4.96 |
| Other | n.a. | n.a. | n.a. | 5.40 | 4.50 | 4.07 | 4.21 | 4.42 | 4.81 | 4.81 |
| Trading account | 6.84 | 7.33 | 9.30 | 6.60 | 14.05 | 3.07 | 10.30 | 6.59 | 4.92 | 5.25 |
| Gross federal funds sold and reverse RPs | 5.31 | 4.98 | 6.15 | 3.91 | 1.73 | 1.27 | 1.57 | 3.31 | 4.94 | 5.07 |
| Interest-bearing balances at depositories | 5.77 | 5.07 | 5.76 | 3.93 | 1.79 | 1.26 | 1.47 | 3.29 | 4.58 | 4.94 |
| Rates paid | ||||||||||
| Interest-bearing liabilities | 4.50 | 4.09 | 4.79 | 3.97 | 2.44 | 1.79 | 1.65 | 2.36 | 3.38 | 3.79 |
| Interest-bearing deposits | 4.28 | 3.84 | 4.46 | 3.81 | 2.27 | 1.60 | 1.44 | 2.09 | 3.11 | 3.59 |
| In foreign offices | 5.55 | 5.07 | 6.13 | 4.27 | 2.14 | 1.43 | 1.43 | 3.05 | 4.50 | 4.63 |
| In domestic offices | 4.25 | 3.82 | 4.43 | 3.81 | 2.28 | 1.60 | 1.44 | 2.08 | 3.10 | 3.58 |
| Other checkable deposits | 2.15 | 1.99 | 2.27 | 1.81 | 1.06 | .74 | .72 | 1.18 | 1.74 | 1.89 |
| Savings deposits (including MMDAs) | 2.96 | 2.65 | 3.07 | 2.22 | 1.17 | .76 | .74 | 1.27 | 2.06 | 2.38 |
| Large time deposits6 | 5.51 | 5.17 | 6.00 | 5.27 | 3.32 | 2.57 | 2.33 | 3.21 | 4.41 | 4.91 |
| Other time deposits6 | 5.64 | 5.11 | 5.74 | 5.51 | 3.77 | 2.86 | 2.51 | 3.10 | 4.19 | 4.83 |
| Gross federal funds purchased and RPs | 5.13 | 4.82 | 5.95 | 3.82 | 1.83 | 1.29 | 1.45 | 2.94 | 4.52 | 4.62 |
| Other interest-bearing liabilities | 5.93 | 5.47 | 6.46 | 5.32 | 4.22 | 3.57 | 3.37 | 4.02 | 4.75 | 5.04 |
| Income and expense as a percentage of average net consolidated assets | ||||||||||
| Gross interest income | 7.66 | 7.19 | 7.79 | 7.16 | 5.84 | 5.07 | 4.99 | 5.57 | 6.40 | 6.68 |
| Taxable equivalent | 7.74 | 7.27 | 7.86 | 7.24 | 5.91 | 5.14 | 5.06 | 5.63 | 6.46 | 6.74 |
| Loans | 5.89 | 5.47 | 5.96 | 5.59 | 4.56 | 4.06 | 4.01 | 4.55 | 5.29 | 5.58 |
| Securities | 1.50 | 1.51 | 1.58 | 1.33 | 1.15 | .91 | .88 | .86 | .89 | .88 |
| Gross federal funds sold and reverse RPs | .22 | .17 | .21 | .16 | .07 | .05 | .05 | .09 | .14 | .13 |
| Other | .06 | .04 | .04 | .08 | .06 | .05 | .05 | .07 | .09 | .09 |
| Gross interest expense | 3.44 | 3.20 | 3.79 | 3.14 | 1.92 | 1.41 | 1.29 | 1.84 | 2.67 | 3.01 |
| Deposits | 2.70 | 2.44 | 2.87 | 2.48 | 1.49 | 1.04 | .92 | 1.34 | 2.04 | 2.41 |
| Gross federal funds purchased and RPs | .32 | .34 | .38 | .22 | .09 | .07 | .08 | .16 | .24 | .25 |
| Other | .42 | .42 | .54 | .44 | .34 | .30 | .29 | .34 | .39 | .36 |
| Net interest income | 4.21 | 3.99 | 4.00 | 4.02 | 3.92 | 3.66 | 3.70 | 3.72 | 3.73 | 3.67 |
| Taxable equivalent | 4.29 | 4.07 | 4.07 | 4.10 | 3.99 | 3.73 | 3.77 | 3.79 | 3.79 | 3.73 |
| Loss provisions7 | .49 | .39 | .52 | .65 | .54 | .40 | .30 | .23 | .23 | .45 |
| Non-interest income | 2.26 | 2.31 | 2.35 | 2.37 | 2.37 | 2.30 | 2.26 | 2.01 | 1.98 | 1.88 |
| Service charges on deposits | .39 | .38 | .36 | .39 | .41 | .41 | .39 | .36 | .35 | .36 |
| Fiduciary activities | .37 | .38 | .44 | .40 | .35 | .34 | .37 | .35 | .30 | .31 |
| Trading revenue | .02 | .02 | .01 | * | * | .01 | .01 | .01 | .01 | .01 |
| Interest rate exposures | .01 | .01 | .01 | -.01 | * | .01 | .01 | .01 | * | * |
| Foreign exchange rate exposures | * | * | * | * | * | * | * | * | * | * |
| Other commodity and equity exposures | * | * | * | * | * | * | * | * | * | * |
| Other | 1.49 | 1.53 | 1.55 | 1.58 | 1.60 | 1.54 | 1.49 | 1.29 | 1.32 | 1.20 |
| Non-interest expense | 3.86 | 3.70 | 3.84 | 3.88 | 3.72 | 3.59 | 3.54 | 3.37 | 3.35 | 3.26 |
| Salaries, wages, and employee benefits | 1.56 | 1.56 | 1.59 | 1.61 | 1.64 | 1.64 | 1.64 | 1.61 | 1.59 | 1.57 |
| Occupancy | .47 | .47 | .47 | .46 | .45 | .43 | .43 | .41 | .40 | .40 |
| Other | 1.83 | 1.68 | 1.78 | 1.81 | 1.63 | 1.52 | 1.47 | 1.35 | 1.35 | 1.28 |
| Net non-interest expense | 1.60 | 1.39 | 1.48 | 1.52 | 1.35 | 1.29 | 1.29 | 1.36 | 1.36 | 1.38 |
| Gains on investment account securities | .04 | -.01 | -.04 | .05 | .04 | .05 | .02 | -.01 | -.01 | -.01 |
| Income before taxes and extraordinary items | 2.16 | 2.19 | 1.96 | 1.90 | 2.07 | 2.02 | 2.13 | 2.12 | 2.12 | 1.83 |
| Taxes | .74 | .74 | .67 | .66 | .67 | .66 | .68 | .68 | .69 | .58 |
| Extraordinary items, net of income taxes | .06 | .01 | * | .01 | * | .03 | * | * | * | * |
| Net income | 1.47 | 1.46 | 1.29 | 1.25 | 1.39 | 1.39 | 1.45 | 1.45 | 1.43 | 1.25 |
| Cash dividends declared | 1.01 | 1.06 | .92 | 1.33 | 1.19 | 1.64 | .78 | .86 | .89 | .91 |
| Retained income | .46 | .40 | .37 | -.08 | .20 | -.25 | .68 | .58 | .54 | .34 |
| Memo: Return on equity | 15.60 | 16.10 | 14.21 | 12.94 | 13.83 | 13.48 | 13.42 | 13.30 | 13.03 | 11.21 |
Note: Data are as of April 16, 2008.
1. Includes allocated transfer risk reserve. Return to table
2. Measured as the sum of large time deposits in domestic offices, deposits booked in foreign offices, subordinated notes and debentures, federal funds purchased and securities sold under repurchase agreements, Federal Home Loan Bank advances, and other borrowed money. Return to table
3. Measured as the sum of construction and land development loans secured by real estate; real estate loans secured by nonfarm nonresidential properties or by multifamily residential properties; and loans to finance commercial real estate, construction, and land development activities not secured by real estate. Return to table
4. Other real estate owned is a component of other non-interest-earning assets. Return to table
5. When possible, based on the average of quarterly balance sheet data reported on schedule RC-K of the quarterly Call Report. Return to table
6. Before 1997, large time deposit open accounts were included in other time deposits. Return to table
7. Includes provisions for allocated transfer risk. Return to table
* In absolute value, less than 0.005 percent. Return to table
n.a. Not available. Return to table
MMDA Money market deposit account. Return to table
RP Repurchase agreement. Return to table
MBS Mortgage-backed securities. Return to table
| E. Banks not ranked among the 1,000 largest by assets | ||||||||||
| Item | 1998 | 1999 | 2000 | 2001 | 2002 | 2003 | 2004 | 2005 | 2006 | 2007 |
|---|---|---|---|---|---|---|---|---|---|---|
| Balance sheet items as a percentage of average net consolidated assets | ||||||||||
| Interest-earning assets | 92.64 | 92.55 | 92.52 | 92.26 | 92.22 | 92.14 | 92.34 | 92.30 | 92.37 | 92.40 |
| Loans and leases (net) | 59.11 | 59.76 | 62.31 | 62.67 | 62.72 | 62.31 | 63.80 | 65.44 | 66.65 | 67.29 |
| Commercial and industrial | 10.33 | 10.64 | 11.09 | 11.10 | 10.71 | 10.42 | 10.29 | 10.21 | 10.17 | 10.25 |
| U.S. addressees | 10.25 | 10.55 | 11.02 | 11.02 | 10.65 | 10.36 | 10.25 | 10.15 | 10.12 | 10.22 |
| Foreign addressees | .08 | .08 | .07 | .08 | .06 | .05 | .04 | .06 | .05 | .04 |
| Consumer | 8.46 | 8.17 | 7.98 | 7.42 | 6.77 | 6.16 | 5.45 | 4.97 | 4.63 | 4.36 |
| Credit card | .70 | .69 | .59 | .59 | .49 | .51 | .40 | .36 | .37 | .37 |
| Installment and other | 7.76 | 7.47 | 7.39 | 6.83 | 6.28 | 5.65 | 5.05 | 4.61 | 4.25 | 3.99 |
| Real estate | 36.04 | 36.83 | 39.29 | 40.30 | 41.52 | 42.30 | 44.75 | 46.97 | 48.54 | 49.28 |
| In domestic offices | 36.04 | 36.83 | 39.29 | 40.30 | 41.52 | 42.30 | 44.75 | 46.97 | 48.53 | 49.28 |
| Construction and land development | 3.02 | 3.28 | 3.70 | 4.23 | 4.51 | 4.99 | 6.01 | 7.46 | 9.10 | 10.01 |
| Farmland | 2.83 | 2.95 | 3.06 | 3.04 | 3.08 | 3.13 | 3.22 | 3.25 | 3.26 | 3.38 |
| One- to four-family residential | 18.04 | 17.66 | 18.43 | 18.24 | 17.91 | 17.09 | 17.18 | 17.12 | 16.69 | 16.30 |
| Home equity | 1.21 | 1.17 | 1.28 | 1.37 | 1.62 | 1.79 | 2.11 | 2.20 | 2.06 | 2.01 |
| Other | 16.83 | 16.49 | 17.15 | 16.87 | 16.29 | 15.29 | 15.06 | 14.93 | 14.63 | 14.30 |
| Multifamily residential | .93 | .98 | 1.04 | 1.06 | 1.16 | 1.28 | 1.41 | 1.48 | 1.47 | 1.50 |
| Nonfarm nonresidential | 11.22 | 11.96 | 13.06 | 13.71 | 14.86 | 15.82 | 16.93 | 17.66 | 18.01 | 18.09 |
| In foreign offices | * | * | * | * | * | * | * | * | * | * |
| To depository institutions and acceptances of other banks | .14 | .14 | .12 | .12 | .10 | .09 | .07 | .05 | .05 | .06 |
| Foreign governments | * | .01 | .01 | * | * | * | * | * | * | * |
| Agricultural production | 4.27 | 4.06 | 3.85 | 3.76 | 3.64 | 3.40 | 3.26 | 3.21 | 3.22 | 3.26 |
| Other loans | .67 | .67 | .69 | .67 | .65 | .66 | .68 | .70 | .70 | .70 |
| Lease-financing receivables | .24 | .26 | .27 | .27 | .31 | .26 | .25 | .24 | .26 | .27 |
| Less: Unearned income on loans | -.20 | -.15 | -.11 | -.09 | -.07 | -.06 | -.06 | -.05 | -.05 | -.04 |
| Less: Loss reserves1 | -.86 | -.87 | -.88 | -.88 | -.90 | -.92 | -.89 | -.87 | -.87 | -.87 |
| Securities | 26.69 | 26.91 | 25.40 | 22.80 | 23.34 | 23.47 | 23.34 | 21.92 | 20.54 | 19.65 |
| Investment account | 26.66 | 26.88 | 25.38 | 22.79 | 23.32 | 23.44 | 23.33 | 21.90 | 20.52 | 19.57 |
| Debt | 26.12 | 26.34 | 24.82 | 22.49 | 23.05 | 23.12 | 23.07 | 21.70 | 20.35 | 19.41 |
| U.S. Treasury | 5.05 | 3.34 | 2.12 | 1.33 | 1.04 | .90 | .81 | .71 | .61 | .47 |
| U.S. government agency and corporation obligations | 15.43 | 16.89 | 16.95 | 15.27 | 16.07 | 16.23 | 16.57 | 15.64 | 14.73 | 14.02 |
| Government-backed mortgage pools | 3.90 | 3.95 | 3.47 | 3.78 | 4.54 | 4.84 | 4.76 | 4.23 | 3.62 | 3.55 |
| Collateralized mortgage obligations | 2.02 | 2.00 | 1.70 | 1.94 | 2.30 | 2.20 | 1.96 | 1.71 | 1.50 | 1.55 |
| Other | 9.51 | 10.93 | 11.78 | 9.56 | 9.23 | 9.19 | 9.85 | 9.70 | 9.61 | 8.92 |
| State and local government | 4.80 | 4.96 | 4.64 | 4.51 | 4.56 | 4.73 | 4.67 | 4.49 | 4.30 | 4.20 |
| Private mortgage-backed securities | .16 | .26 | .23 | .27 | .26 | .21 | .19 | .22 | .24 | .29 |
| Other | .69 | .89 | .88 | 1.11 | 1.12 | 1.05 | .83 | .65 | .48 | .43 |
| Equity | .54 | .53 | .56 | .30 | .27 | .31 | .26 | .20 | .17 | .17 |
| Trading account | .04 | .03 | .02 | .01 | .01 | .04 | .01 | .02 | .02 | .07 |
| Gross federal funds sold and reverse RPs | 5.13 | 4.17 | 3.22 | 5.01 | 4.26 | 4.27 | 3.33 | 3.24 | 3.53 | 3.92 |
| Interest-bearing balances at depositories | 1.72 | 1.71 | 1.59 | 1.78 | 1.90 | 2.08 | 1.86 | 1.70 | 1.65 | 1.55 |
| Non-interest-earning assets | 7.36 | 7.45 | 7.48 | 7.74 | 7.78 | 7.86 | 7.66 | 7.70 | 7.63 | 7.60 |
| Revaluation gains held in trading accounts | * | * | * | * | * | * | * | * | * | * |
| Other | 7.36 | 7.45 | 7.48 | 7.74 | 7.78 | 7.86 | 7.66 | 7.70 | 7.63 | 7.60 |
| Liabilities | 89.53 | 89.75 | 89.88 | 89.59 | 89.73 | 89.58 | 89.55 | 89.49 | 89.35 | 88.95 |
| Core deposits | 73.75 | 72.74 | 70.87 | 69.92 | 70.04 | 69.97 | 69.24 | 67.68 | 65.74 | 65.12 |
| Transaction deposits | 24.26 | 23.87 | 23.20 | 22.35 | 22.67 | 23.18 | 23.36 | 22.72 | 20.81 | 18.66 |
| Demand deposits | 13.08 | 12.80 | 12.64 | 12.16 | 12.24 | 12.58 | 12.77 | 12.77 | 11.97 | 10.74 |
| Other checkable deposits | 11.18 | 11.07 | 10.57 | 10.19 | 10.42 | 10.60 | 10.59 | 9.95 | 8.84 | 7.93 |
| Savings deposits (including MMDAs) | 19.06 | 19.77 | 19.19 | 19.38 | 21.32 | 22.42 | 23.24 | 22.98 | 22.66 | 22.68 |
| Small time deposits | 30.43 | 29.10 | 28.48 | 28.19 | 26.05 | 24.36 | 22.64 | 21.98 | 22.28 | 23.77 |
| Managed liabilities2 | 14.76 | 16.09 | 18.08 | 18.67 | 18.79 | 18.77 | 19.57 | 21.04 | 22.76 | 22.92 |
| Large time deposits | 11.11 | 11.52 | 12.51 | 13.55 | 13.21 | 13.07 | 13.16 | 14.53 | 16.49 | 16.91 |
| Deposits booked in foreign offices | .07 | .08 | .05 | .06 | .07 | .06 | .07 | .06 | .06 | .05 |
| Subordinated notes and debentures | .01 | .01 | .02 | .02 | .04 | .03 | .04 | .03 | .03 | .03 |
| Gross federal funds purchased and RPs | 1.49 | 1.79 | 2.06 | 1.55 | 1.51 | 1.52 | 1.76 | 1.74 | 1.82 | 1.82 |
| Other managed liabilities | 2.08 | 2.69 | 3.44 | 3.49 | 3.96 | 4.09 | 4.55 | 4.68 | 4.36 | 4.11 |
| Revaluation losses held in trading accounts | * | * | * | * | * | * | * | * | * | * |
| Other | 1.03 | .92 | .93 | 1.00 | .90 | .84 | .74 | .77 | .84 | .91 |
| Capital account | 10.47 | 10.25 | 10.12 | 10.41 | 10.27 | 10.42 | 10.45 | 10.51 | 10.65 | 11.05 |
| Memo | ||||||||||
| Commercial real estate loans3 | 15.27 | 16.33 | 17.91 | 19.15 | 20.67 | 22.22 | 24.50 | 26.76 | 28.81 | 29.89 |
| Other real estate owned4 | .13 | .11 | .11 | .12 | .14 | .15 | .14 | .13 | .12 | .16 |
| Mortgage-backed securities | 6.07 | 6.22 | 5.39 | 5.99 | 7.10 | 7.25 | 6.91 | 6.15 | 5.36 | 5.39 |
| Federal Home Loan Bank advances | n.a. | n.a. | n.a. | 3.34 | 3.72 | 3.87 | 4.32 | 4.47 | 4.14 | 3.93 |
| Average net consolidated assets (billions of dollars) | 644 | 651 | 655 | 674 | 704 | 741 | 768 | 804 | 840 | 862 |
| Effective interest rate (percent)5 | ||||||||||
| Rates earned | ||||||||||
| Interest-earning assets | 8.35 | 8.04 | 8.44 | 7.92 | 6.79 | 5.93 | 5.73 | 6.23 | 7.01 | 7.26 |
| Taxable equivalent | 8.48 | 8.17 | 8.56 | 8.03 | 6.90 | 6.04 | 5.84 | 6.33 | 7.10 | 7.36 |
| Loans and leases, gross | 9.69 | 9.27 | 9.51 | 9.01 | 7.83 | 7.08 | 6.71 | 7.17 | 7.94 | 8.13 |
| Net of loss provisions | 9.34 | 8.89 | 9.14 | 8.60 | 7.39 | 6.71 | 6.45 | 6.94 | 7.74 | 7.83 |
| Securities | 6.04 | 5.88 | 6.15 | 5.86 | 5.03 | 3.87 | 3.74 | 3.87 | 4.28 | 4.68 |
| Taxable equivalent | 6.45 | 6.29 | 6.54 | 6.27 | 5.43 | 4.26 | 4.11 | 4.24 | 4.65 | 5.06 |
| Investment account | 6.04 | 5.88 | 6.15 | 5.86 | 5.02 | 3.87 | 3.73 | 3.86 | 4.28 | 4.68 |
| U.S. Treasury securities and U.S. government agency obligations (excluding MBS) | n.a. | n.a. | n.a. | 5.97 | 4.80 | 3.74 | 3.38 | 3.53 | 4.12 | 4.70 |
| Mortgage-backed securities | n.a. | n.a. | n.a. | 6.20 | 5.47 | 3.58 | 3.90 | 4.16 | 4.59 | 4.96 |
| Other | n.a. | n.a. | n.a. | 5.29 | 4.87 | 4.43 | 4.18 | 4.16 | 4.25 | 4.33 |
| Trading account | 5.26 | 3.60 | 4.01 | 6.43 | 15.38 | 2.89 | 18.95 | 7.52 | 7.51 | 4.97 |
| Gross federal funds sold and reverse RPs | 5.35 | 4.96 | 6.24 | 3.82 | 1.63 | 1.08 | 1.32 | 3.21 | 4.95 | 5.05 |
| Interest-bearing balances at depositories | 5.65 | 5.65 | 6.38 | 4.56 | 2.68 | 1.97 | 2.02 | 3.21 | 4.64 | 5.05 |
| Rates paid | ||||||||||
| Interest-bearing liabilities | 4.63 | 4.32 | 4.84 | 4.43 | 2.93 | 2.14 | 1.88 | 2.44 | 3.42 | 3.91 |
| Interest-bearing deposits | 4.52 | 4.21 | 4.67 | 4.31 | 2.78 | 2.02 | 1.75 | 2.29 | 3.28 | 3.81 |
| In foreign offices | 4.84 | 4.12 | 5.13 | 3.97 | 1.67 | .85 | 1.04 | 2.86 | 4.27 | 4.66 |
| In domestic offices | 4.52 | 4.21 | 4.67 | 4.31 | 2.78 | 2.02 | 1.75 | 2.29 | 3.28 | 3.81 |
| Other checkable deposits | 2.44 | 2.27 | 2.47 | 1.97 | 1.16 | .78 | .69 | .99 | 1.45 | 1.61 |
| Savings deposits (including MMDAs) | 3.38 | 3.20 | 3.56 | 2.81 | 1.72 | 1.13 | 1.04 | 1.53 | 2.34 | 2.67 |
| Large time deposits6 | 5.53 | 5.21 | 5.89 | 5.52 | 3.61 | 2.78 | 2.47 | 3.21 | 4.37 | 4.90 |
| Other time deposits6 | 5.63 | 5.24 | 5.70 | 5.60 | 3.88 | 2.96 | 2.55 | 3.04 | 4.12 | 4.79 |
| Gross federal funds purchased and RPs | 4.96 | 4.73 | 5.69 | 3.92 | 1.85 | 1.31 | 1.45 | 2.89 | 4.37 | 4.45 |
| Other interest-bearing liabilities | 9.56 | 8.25 | 9.13 | 8.08 | 6.82 | 5.32 | 4.59 | 5.01 | 5.70 | 5.82 |
| Income and expense as a percentage of average net consolidated assets | ||||||||||
| Gross interest income | 7.74 | 7.48 | 7.83 | 7.33 | 6.31 | 5.46 | 5.32 | 5.78 | 6.49 | 6.74 |
| Taxable equivalent | 7.86 | 7.60 | 7.95 | 7.44 | 6.41 | 5.56 | 5.41 | 5.87 | 6.58 | 6.82 |
| Loans | 5.80 | 5.62 | 5.99 | 5.73 | 5.01 | 4.47 | 4.35 | 4.76 | 5.35 | 5.53 |
| Securities | 1.59 | 1.58 | 1.57 | 1.32 | 1.16 | .89 | .87 | .85 | .88 | .92 |
| Gross federal funds sold and reverse RPs | .29 | .22 | .21 | .20 | .07 | .05 | .05 | .11 | .18 | .20 |
| Other | .06 | .06 | .05 | .08 | .06 | .06 | .05 | .06 | .08 | .08 |
| Gross interest expense | 3.46 | 3.26 | 3.64 | 3.33 | 2.22 | 1.60 | 1.41 | 1.82 | 2.56 | 2.95 |
| Deposits | 3.25 | 3.02 | 3.30 | 3.07 | 1.98 | 1.41 | 1.22 | 1.58 | 2.27 | 2.67 |
| Gross federal funds purchased and RPs | .07 | .08 | .12 | .06 | .03 | .02 | .02 | .05 | .08 | .08 |
| Other | .13 | .15 | .21 | .20 | .21 | .17 | .17 | .19 | .21 | .20 |
| Net interest income | 4.28 | 4.22 | 4.20 | 4.00 | 4.08 | 3.86 | 3.91 | 3.96 | 3.94 | 3.79 |
| Taxable equivalent | 4.40 | 4.34 | 4.31 | 4.10 | 4.19 | 3.96 | 4.00 | 4.05 | 4.03 | 3.87 |
| Loss provisions7 | .29 | .31 | .32 | .33 | .35 | .29 | .23 | .21 | .20 | .27 |
| Non-interest income | 1.52 | 1.44 | 1.31 | 1.30 | 1.39 | 1.47 | 1.38 | 1.33 | 1.31 | 1.33 |
| Service charges on deposits | .42 | .42 | .43 | .44 | .45 | .43 | .43 | .40 | .38 | .37 |
| Fiduciary activities | .23 | .26 | .21 | .25 | .27 | .28 | .31 | .33 | .36 | .38 |
| Trading revenue | * | * | * | * | * | * | * | * | * | * |
| Interest rate exposures | * | * | * | * | * | * | * | * | * | * |
| Foreign exchange rate exposures | * | * | * | * | * | * | * | * | * | * |
| Other commodity and equity exposures | * | * | * | * | * | * | * | * | * | * |
| Other | .86 | .75 | .67 | .61 | .67 | .76 | .64 | .61 | .57 | .58 |
| Non-interest expense | 3.74 | 3.73 | 3.57 | 3.54 | 3.57 | 3.56 | 3.52 | 3.48 | 3.49 | 3.53 |
| Salaries, wages, and employee benefits | 1.82 | 1.82 | 1.78 | 1.79 | 1.82 | 1.82 | 1.81 | 1.79 | 1.82 | 1.84 |
| Occupancy | .49 | .49 | .47 | .47 | .46 | .45 | .45 | .44 | .44 | .44 |
| Other | 1.43 | 1.42 | 1.31 | 1.28 | 1.28 | 1.28 | 1.26 | 1.25 | 1.24 | 1.25 |
| Net non-interest expense | 2.23 | 2.29 | 2.26 | 2.24 | 2.18 | 2.09 | 2.14 | 2.15 | 2.18 | 2.19 |
| Gains on investment account securities | .02 | * | -.01 | .04 | .05 | .04 | .01 | * | -.01 | * |
| Income before taxes and extraordinary items | 1.79 | 1.62 | 1.61 | 1.46 | 1.60 | 1.53 | 1.55 | 1.60 | 1.55 | 1.32 |
| Taxes | .53 | .47 | .45 | .39 | .41 | .38 | .37 | .38 | .36 | .29 |
| Extraordinary items, net of income taxes | * | * | * | * | -.01 | * | * | * | * | * |
| Net income | 1.26 | 1.15 | 1.17 | 1.07 | 1.18 | 1.14 | 1.18 | 1.21 | 1.19 | 1.03 |
| Cash dividends declared | .81 | .70 | .79 | .64 | .68 | .67 | .64 | .67 | .65 | .67 |
| Retained income | .45 | .45 | .38 | .43 | .50 | .47 | .54 | .54 | .53 | .36 |
| Memo: Return on equity | 12.00 | 11.25 | 11.52 | 10.28 | 11.49 | 10.97 | 11.26 | 11.54 | 11.15 | 9.30 |
Note: Data are as of April 16, 2008.
1. Includes allocated transfer risk reserve. Return to table
2. Measured as the sum of large time deposits in domestic offices, deposits booked in foreign offices, subordinated notes and debentures, federal funds purchased and securities sold under repurchase agreements, Federal Home Loan Bank advances, and other borrowed money. Return to table
3. Measured as the sum of construction and land development loans secured by real estate; real estate loans secured by nonfarm nonresidential properties or by multifamily residential properties; and loans to finance commercial real estate, construction, and land development activities not secured by real estate. Return to table
4. Other real estate owned is a component of other non-interest-earning assets. Return to table
5. When possible, based on the average of quarterly balance sheet data reported on schedule RC-K of the quarterly Call Report. Return to table
6. Before 1997, large time deposit open accounts were included in other time deposits. Return to table
7. Includes provisions for allocated transfer risk. Return to table
* In absolute value, less than 0.005 percent. Return to table
n.a. Not available. Return to table
MMDA Money market deposit account. Return to table
RP Repurchase agreement. Return to table
MBS Mortgage-backed securities. Return to table
| Millions of dollars | ||||||||||
| Item | 1998 | 1999 | 2000 | 2001 | 2002 | 2003 | 2004 | 2005 | 2006 | 2007 |
|---|---|---|---|---|---|---|---|---|---|---|
| Gross interest income | 359,478 | 367,128 | 423,840 | 404,250 | 349,583 | 329,138 | 348,663 | 426,535 | 551,042 | 617,099 |
| Taxable equivalent | 361,941 | 369,763 | 426,475 | 406,935 | 352,330 | 331,919 | 351,647 | 429,490 | 554,296 | 620,563 |
| Loans | 271,262 | 279,223 | 326,801 | 311,539 | 269,384 | 257,619 | 269,404 | 328,023 | 421,872 | 464,903 |
| Securities | 56,581 | 62,412 | 67,664 | 63,061 | 59,305 | 53,315 | 58,575 | 65,864 | 78,913 | 82,714 |
| Gross federal funds sold and reverse repurchase agreements | 14,999 | 12,336 | 13,545 | 12,647 | 6,221 | 5,015 | 5,142 | 11,045 | 21,296 | 28,737 |
| Other | 16,636 | 13,158 | 15,829 | 17,006 | 14,672 | 13,187 | 15,538 | 21,602 | 28,959 | 40,744 |
| Gross interest expense | 178,133 | 175,399 | 222,159 | 188,746 | 118,731 | 94,098 | 98,539 | 162,499 | 263,372 | 310,496 |
| Deposits | 125,197 | 119,971 | 151,145 | 132,310 | 81,691 | 62,377 | 63,638 | 105,922 | 173,878 | 212,784 |
| Gross federal funds purchased and repurchase agreements | 22,175 | 21,210 | 26,859 | 19,583 | 9,920 | 7,590 | 8,842 | 19,161 | 33,775 | 37,797 |
| Other | 30,759 | 34,216 | 44,155 | 36,852 | 27,121 | 24,131 | 26,058 | 37,416 | 55,720 | 59,914 |
| Net interest income | 181,345 | 191,729 | 201,681 | 215,504 | 230,852 | 235,040 | 250,124 | 264,036 | 287,670 | 306,603 |
| Taxable equivalent | 183,808 | 194,364 | 204,316 | 218,189 | 233,599 | 237,821 | 253,108 | 266,991 | 290,924 | 310,067 |
| Loss provisions | 21,413 | 21,222 | 29,386 | 43,084 | 45,205 | 32,702 | 23,893 | 25,540 | 25,384 | 56,445 |
| Non-interest income | 124,047 | 144,794 | 153,101 | 160,897 | 168,231 | 183,745 | 188,998 | 201,628 | 222,887 | 218,586 |
| Service charges on deposits | 19,769 | 21,590 | 23,720 | 26,872 | 29,628 | 31,692 | 33,454 | 33,830 | 36,194 | 39,185 |
| Fiduciary activities | 19,267 | 20,532 | 22,212 | 21,988 | 21,403 | 22,453 | 25,088 | 26,381 | 28,312 | 32,973 |
| Trading revenue | 7,693 | 10,437 | 12,235 | 12,380 | 10,790 | 11,585 | 10,303 | 14,375 | 19,170 | 5,278 |
| Other | 77,316 | 92,235 | 94,934 | 99,658 | 106,409 | 118,015 | 120,154 | 127,038 | 139,214 | 141,149 |
| Non-interest expense | 194,103 | 205,205 | 216,373 | 225,979 | 230,120 | 243,180 | 263,301 | 274,063 | 294,890 | 321,390 |
| Salaries, wages, and employee benefits | 79,543 | 86,394 | 89,015 | 94,196 | 100,443 | 108,434 | 115,253 | 124,037 | 135,868 | 144,700 |
| Occupancy | 24,162 | 25,944 | 26,761 | 27,939 | 29,309 | 31,312 | 33,252 | 35,050 | 36,393 | 38,526 |
| Other | 90,397 | 92,867 | 100,598 | 103,846 | 100,365 | 103,433 | 114,797 | 114,976 | 122,628 | 138,164 |
| Net non-interest expense | 70,056 | 60,411 | 63,272 | 65,082 | 61,889 | 59,435 | 74,303 | 72,435 | 72,003 | 102,804 |
| Gains on investment account securities | 3,090 | 246 | -2,280 | 4,630 | 6,410 | 5,633 | 3,392 | -220 | -1,320 | -618 |
| Income before taxes | 92,966 | 110,342 | 106,740 | 111,971 | 130,173 | 148,553 | 155,323 | 165,841 | 188,964 | 146,738 |
| Taxes | 31,946 | 39,314 | 37,248 | 37,284 | 42,816 | 48,493 | 50,264 | 53,534 | 60,956 | 44,323 |
| Extraordinary items, net of income taxes | 506 | 169 | -31 | -324 | -68 | 427 | 59 | 241 | 2,647 | -1,674 |
| Net income | 61,524 | 71,197 | 69,461 | 74,363 | 87,288 | 100,489 | 105,116 | 112,546 | 130,656 | 100,739 |
| Cash dividends declared | 41,144 | 52,280 | 52,547 | 54,844 | 67,230 | 77,757 | 59,523 | 64,523 | 82,309 | 85,244 |
| Retained income | 20,380 | 18,917 | 16,914 | 19,518 | 20,059 | 22,733 | 45,591 | 48,024 | 48,346 | 15,495 |
Note: Data are as of April 16, 2008.


