Employer-to-Employer Flows in the United States:
Estimates Using Linked Employer-Employee Data1
We use administrative data linking workers and firms to study employer-to-employer flows. After discussing how to identify such flows in quarterly data, we investigate their basic empirical patterns. We find that the pace of employer-to-employer flows is high, representing about 4 percent of employment and 30 percent of separations each quarter. The pace of employer-to-employer flows is highly procyclical, and varies systematically across worker, job and employer characteristics. Our findings regarding job tenure and earnings dynamics suggest that for those workers moving directly to new jobs, the new jobs are generally better jobs; however, this pattern is highly procyclical. There are rich patterns in terms of origin and destination of industries. We find somewhat surprisingly that more than half of the workers making employer-to-employer transitions switch even broadly-defined industries (NAICS super-sectors).
I. Introduction
An enormous amount of worker and job reallocation continually takes place in the U.S. economy. For example, Davis, Faberman and Haltiwanger (2006) (hereafter DFH) report that the quarterly job creation and destruction rates each average around 6 to 8 percent of total employment and that accession and separation rates are 2-3 times as large.6 Job reallocation induces worker reallocation with less profitable firms shedding jobs and thus workers and more productive firms adding them. Much of the observed job reallocation occurs within narrowly defined sectors, so the primary drivers of the continual reallocation of jobs evidently include idiosyncratic shocks to technology, demand and costs. The pace of job reallocation does, however, fluctuate both secularly and cyclically, and as such is related both to the overall pace of technological change and to macroeconomic shocks. In addition to these job dynamics, workers also continuously sort themselves over a given distribution of jobs. Workers switch jobs and change employment status because of "supply-side" events such as labor force entry, family relocation and retirement, or for reasons of career development, better pay and preferable working conditions.
There is a large and growing empirical and theoretical literature quantifying and studying these worker and job flows and their interactions with the outcomes of firms and workers. The U.S. statistical agencies now have a variety of data products - e.g., the Business Employment Dynamics (BED) and the Job Openings and Labor Turnover Survey (JOLTS) programs at BLS and the Longitudinal Business Database (LBD) and Longitudinal Employer Household Dynamics program (LEHD) programs at the Census Bureau - that tabulate these flows by a variety of worker and firm characteristics. Given the huge volume of these flows and the inherent frictions involved in the reallocation of jobs and workers, there is considerable interest in understanding the nature and implications of these frictions at the micro and aggregate level. One important element largely missing from the expanding measurement of worker and job flows is the flows of workers in a time period directly from one employer to another. The measurement and analysis of employer-to-employer flows sheds light on how the frictions in the labor market are being resolved over time, across sectors, and across different types of firms and workers. Such direct employer-to-employer flows are not without frictions, but by construction they reflect flows that do not involve a period of frictional unemployment.
Quantifying and studying employer-to-employer flows is of interest not only because of what it tells us about frictions in the labor market, but also because employer-to-employer flows include origin and destination information about the employers. It is of interest to know about origin and destination of transitions for workers of different characteristics (age, gender, education, ethnic and foreign born status). It is also of interest to know how earnings change with such transitions, and origin-destination information permits measurement of earnings changes.
In this paper, we use the recently developed longitudinal linked employer-employee data from the LEHD program at Census Bureau to measure and study employer-to-employer flows. These data are exceptionally well suited to an examination of quarterly worker flows as they trace the job histories of a large proportion of employed individuals over several years. As we discuss in section II, the long histories of workers as well as the rich set of employer characteristics yield advantages over related measurement of employer-to-employer flows from the CPS (see Fallick and Fleishman 2001 and 2004). The CPS based flows have alternative advantages, as we also discuss in section II, so we regard these measurement efforts as complementary.
Our main findings are as follows. First, we find that the flow of workers from employer to employer is large and is an important component of overall worker flows. Using our preferred measurement method, we find that quarterly employer-to-employer flows account for about 3.9% percent of employment on average and 29% percent of main job separations. These patterns vary systematically over time - with interesting secular, seasonal, and cyclical variation. We find that employer-to-employer flows are procyclical, rising throughout the late 1990s and falling sharply in 2001. We also find that the pace of employer-to-employer flows as a fraction of employment and separations has remained low in the post-2001 period following the recession. This latter finding is consistent with related findings in the recent literature of a declining pace of worker and job flows in the U.S. economy in the post-2000 period (see DFH).
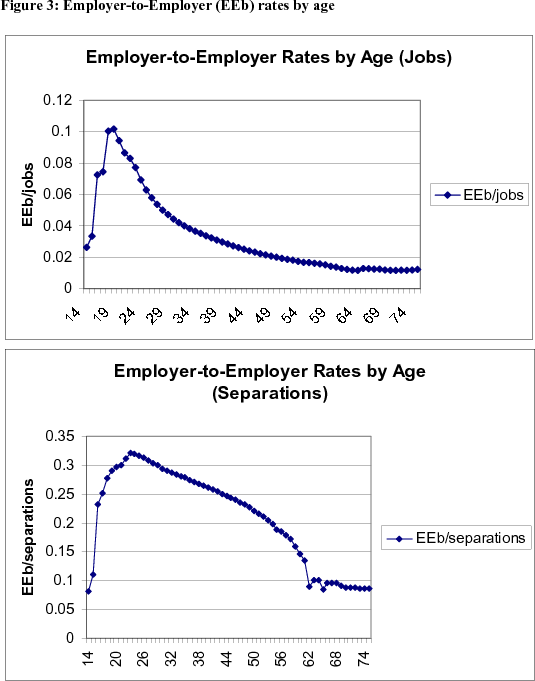
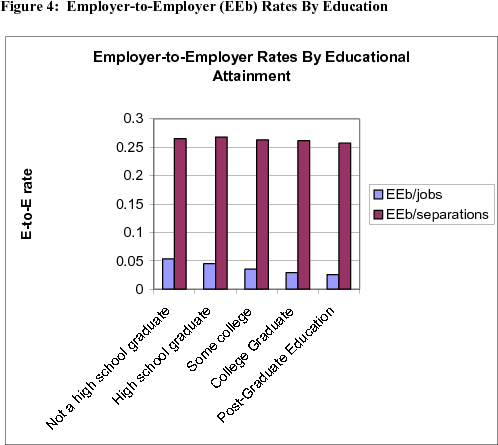
The pace of employer-to-employer flows varies systematically by worker, job and firm characteristics. For workers, employer-to-employer flows as a fraction of employment and separations declines with age through the mid 60s and then flattens out - the decline with age as a fraction of separations is especially rapid in the age range 50-65 when retirements presumably become a more important form of separation than employer-to-employer transitions. We find that less educated workers have a higher pace of employer-to-employer flows as a fraction of employment but there is no discernable pattern by education as a fraction of separations. The pattern by education reflects the higher overall rate of worker flows of less educated but conditional on a separation, education is not an important factor.
Employer-to-employer (henceforth E-to-E) flows are somewhat concentrated among frequent job changers, and even more so among the employees of high-turnover firms. Firms in the highest quintile of turnover - those where more than 6.6% of workers experience an E-to-E flow in an average quarter - account for over 60% of total E-to-E flows. Concentration of E-to-E flows among highly mobile workers is less pronounced but still in evidence - over 50% of total E-to-E flows in a representative quarter are from workers who changed jobs at least twice in the previous three years. Yet fully 20% of employer-to-employer flows in a given year involve workers separating from a job held for more than two years.
Our findings regarding job tenure and earnings dynamics suggest that for those workers moving directly to new jobs, the new jobs are generally better jobs, and that moving directly to a better job is easier in boom than a bust. Tenure at new jobs is generally longer than at separating jobs, with 25% of destination job matches lasting more than two years. We find that on average workers who make employer-to-employer transitions see large increases in earnings. However, this pattern is highly procyclical. The average worker making a direct employer-to-employer transition in a recession sees a smaller increase in earnings than a worker making such a transition in a boom. This hit on earnings gains for making a transition during a recession is especially large for younger workers. We also find larger quarterly growth in earnings for workers making employer-to-employer transitions than workers who remain in their same job. This latter pattern holds for all quarters and age groups we observe.
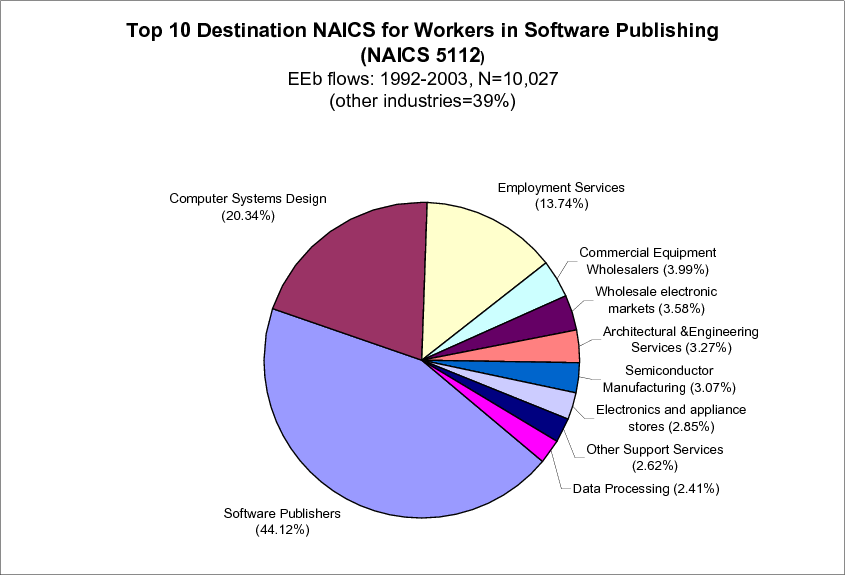
There are rich patterns in terms of origin and destination of industries. We find, to our surprise, that a very large fraction of the workers making employer-to-employer transitions switch even broadly defined industries. More than half of workers making an employer-to-employer transition switch NAICS super-sectors. Some of this finding is explained by looking at the details of the origin and destination sectors. For example, for workers employed in the software publishing industry we find that just over 1/4 of the workers making an employer-to-employer transition remain in software publishing. However, the destination industries reflect closely related activities, such as Custom Computer Programming Services, Computer Systems Design Services and Semiconductor Manufacturing.
The paper proceeds as follows. Section II discusses the LEHD data infrastructure and its suitability for measuring employer-to-employer flows. Section III describes the measurement methodology for measuring employer-to-employer flows in the LEHD data. Section IV presents the main empirical findings and Section V has concluding remarks.
II. Advantages of Using LEHD Data to Estimate Employer-to Employer Flows
Recent research on employer-to-employer flows in the United States exploited the dependent interviewing techniques used in the Current Population Survey (CPS) to provide nationally representative estimates of high-frequency flows of workers between employers. Fallick and Fleischman (2004) estimated that 2.6% of employed persons change employers each month, and that employer-to-employer flows fell markedly during the recession that began in 2001. The CPS has several advantages for estimating E-to-E flows of workers. The CPS is already the primary source of the data on flows of workers across labor market states, so the estimated E-to-E flows can be joined consistently with the other flows in generating a more complete picture of labor market dynamics. The CPS sample is representative of the entire civilian noninstitutional population in that it is not limited to particular cohorts, household members, or sectors. The data measures flows at a monthly frequency, and so is likely to capture movements from one employer to another that do not involve a significant period of nonemployment. And, of course, the CPS contains a rich set of demographic and other information on individuals.7
However, the CPS also has several important limitations. The size of its sample, while large for a survey of households, remains small for some purposes. The representativeness of the CPS is compromised by significant attrition, especially because, by design, it does not follow workers when they change residences. The CPS follows individuals for only four consecutive months, so long employment histories cannot be constructed. As a household survey, it relies on the responses of individuals or other members of their households. And the survey design is such that it can be used to measure flows only between a worker's main jobs. The CPS also measures worker flows from only one side of the market: the worker's side.
The LEHD data offer several advantages for estimating the magnitude of job-to-job flows. First, the LEHD is based on comprehensive administrative data covering a large fraction of the U.S. workforce. This makes possible analysis of flows of workers across detailed industries, detailed demographic groups, and even flows of workers following specific regional economic shocks. In particular, the universe of the LEHD data is employment covered by the state unemployment insurance (UI) system. State unemployment insurance system coverage is broad and basically comparable from state to state. Covered employment generally includes all employees of firms within a state with some notable exceptions.8 UI and associated ES-202 data are provided to the Census Bureau by over 40 participating state partners. These data are supplemented with Census demographic data, providing worker characteristics such as age, race, and gender.
Second, unlike the CPS, which follows individuals for only four consecutive months, the longitudinal nature of the LEHD data means individual work histories can be followed continuously for years. This is important as it allows us to examine the extent to which gross job-to-job flows in the U.S. economy are driven by a small but mobile segment of the workforce. The LEHD data follows workers across employers as long as they continue to collect UI-covered wages, and follows workers who change residence so long as they continue to work in one of the over 40 states participating in the program.9
Lastly perhaps the most unique aspect of the LEHD data is the presence of the link between the worker and the employer. The longitudinal nature of the linked data on both the individual and business side allow us to track the flows of workers between a large sample of firms in the U.S. economy, while also identifying workers' employment histories and the dynamics of the firms across which workers are being redistributed. This link allows us to determine to what extent flows between employers are driven by the dynamics of the employers themselves. For instance, we can examine to what extent are employer-to-employer flows concentrated among employees in high turnover firms. Or to what extent flows are driven by job creation at destination firms, or job destruction at separating firms.
The LEHD data do have a few disadvantages in identifying employer-to-employer flows. There is some potential to miss employer-to-employer transitions that involve cross-state migrations in employment. Employment in the federal government, unincorporated self-employment, religious and charitable organizations, and certain agricultural enterprises are not covered.10 Most fundamentally, the LEHD data do not measure employment at a point in time. The unemployment insurance records that underlie the data report only quarterly earnings. They contain no information regarding how many hours or weeks were worked within the quarter- or which weeks were worked if the worker was at the firm for less than a full quarter. In addition to limiting the analysis to quarterly frequency, this presents some problems in distinguishing between true E-to-E flows and multiple-job-holding, and in determining the direction of some employer-to-employer flows in the presence of short-duration jobs. These are not insignificant problems given that short-job to short-job flows account for a substantial fraction of employer-to-employer flows. We will discuss in detail how we deal with this feature of the data in the next section.
Golan, Lane, and McEntarfer (2006) used LEHD data to examine annual flows of significantly attached workers between employers within and across industries. They found that 25% of workers who demonstrated some attachment to their employer changed jobs in a given year, split almost evenly between industry stayers and industry changers. As the focus of the current paper is to estimate the quarterly frequency of employer-to-employer flows in both main and secondary jobs, our methodology differs from theirs. The next section explains in greater detail the methodology we use estimate the quarterly flows of workers between employers in the LEHD data.
Before proceeding to the measurement methodology and the estimates of the employer-to-employer flows, we note that the underlying source data for all of the statistics reported in this paper are administrative data that provide universal coverage of workers in covered sectors. Unlike estimates of employer-to-employer flows from survey data (e.g., the CPS), with about 6-7 million jobs and 200,000 to 360,000 employer-to-employer flows observed each quarter there is no significant sampling error in our estimates and we report no sampling error statistics. There may of course be measurement error from a variety of sources (e.g., measurement error in longitudinal identifiers or industrial classification for employers or reported earnings for workers) that impact the reliability of these estimates but such error reflects non-sampling error. A comprehensive description of the LEHD data infrastructure files, the measurement methodology and in turn the possible sources of nonsampling error is provided in Abowd et. al. (2006). In the current paper, only descriptive statistics of the employer-to-employer flows are provided with little or no statistical analysis of hypotheses about the causes and consequences of employer-to-employer flows.
III. Defining Employer-to-Employer Flows in LEHD data
The quarterly nature of the LEHD data presents some unique methodological issues with regard to measuring job-to-job flows. As mentioned in the previous section, the unemployment insurance records that underlie the data do not measure employment at a point in time, but only report quarterly earnings. They contain no information regarding which weeks during the quarter the worker was employed or how many hours or weeks she worked within the quarter. Table 1 below provides a hypothetical example of wage history data, in this case the quarterly wage histories for two individuals who were each employed with two different employers during the year.
Our goal is to characterize quarterly job transitions, including those involving shorter jobs or secondary jobs. We begin by defining the existence of a job match in quarter![]() if worker
if worker
![]() has positive earnings from employer
has positive earnings from employer ![]() in that period (denoted
in that period (denoted ![]()
![]() = 1). Matches in only one of two consecutive quarters indicate that either an accession or
separation has occurred. That is, workers with positive earnings in one period but none in the subsequent period are assumed to have separated from their employers at some point during the quarter with positive earnings. Similarly, individuals who are observed to move from receiving no earnings
from a firm to earning a positive amount are assumed to have acceded to the employer sometime during the quarter with positive earnings. In Table 1, we would say that Person 2 separated from Employer B and acceded to Employer Z during quarter 2. Formally, we define accessions and separations as
follows:
= 1). Matches in only one of two consecutive quarters indicate that either an accession or
separation has occurred. That is, workers with positive earnings in one period but none in the subsequent period are assumed to have separated from their employers at some point during the quarter with positive earnings. Similarly, individuals who are observed to move from receiving no earnings
from a firm to earning a positive amount are assumed to have acceded to the employer sometime during the quarter with positive earnings. In Table 1, we would say that Person 2 separated from Employer B and acceded to Employer Z during quarter 2. Formally, we define accessions and separations as
follows:
(1) Accessions (a![]() : individual
: individual ![]() acceded to employer
acceded to employer
![]() during quarter
during quarter ![]()

(2) Separations (s![]() : individual
: individual ![]() separated from
separated from ![]() during
during ![]()

where ![]()
![]() = 1 if worker
= 1 if worker ![]() had positive earnings at employer
had positive earnings at employer ![]() in quarter
in quarter ![]() , and
, and ![]()
![]() = 0 otherwise.
= 0 otherwise.
If we define an employer-to-employer flow simply as an accession to a new employer ![]() that occurs in the same quarter as that same worker separated from employer
that occurs in the same quarter as that same worker separated from employer ![]() , we have the following definition of an employer-to-employer flow:11
, we have the following definition of an employer-to-employer flow:11
(3) Flow Employer-to-Employer Transition (
![]() ): individual
): individual ![]() transitions from firm
transitions from firm ![]() and to firm
and to firm ![]() during
during ![]() :
:

where ![]()
![]() and
and ![]()
![]() are defined as above.
are defined as above.
A limitation of the definition in (3) is that in the case of matches that appear in only one quarter, we cannot distinguish with any confidence between an employer-to-employer flow and multiple job holding. For instance, imagine a work history such that of Person 1 in Table 1. Although Person 1 would be defined as experiencing an employer-to-employer flow in the second quarter according to the definition (EEm) in equation (3), it is also possible that Person 1 held jobs at firm A and firm Q simultaneously. The inclusion of multiple job holding in this measure is likely to result in an over-counting of employer-to-employer flows. Another problem with one-quarter jobs is that, even if we treat them as representing an E-to-E flow, it is difficult to decide which is the origin job and which is the destination job. Preliminary estimates of E-to-E rates using the EEm measure in LEHD data found rates as high as 16% using this measure. This seems an improbably high rate of job-to-job flows and thus, this measure is likely over-counting the true number of flows.
For these reasons, for most of our analysis we use a more restrictive definition of employer-to-employer flows that requires that two quarters of positive earnings be observed both at the separating and the acceding employer. Formally,
(4) Consecutive-Quarter Employer-to-Employer Transition (
![]() : individual
: individual ![]() transitions from firm
transitions from firm ![]() and to firm
and to firm ![]() during
during ![]() :
:

where ![]()
![]() = 1 if
= 1 if ![]()
![]() = 1 and
= 1 and ![]()
![]() = 1 and
= 1 and ![]()
![]() = 1 if
= 1 if ![]()
![]() = 1 and
= 1 and ![]()
![]() = 1.
= 1.
Here we use consecutive quarters of earnings to construct an estimate of point in time employment. If a worker has positive earnings at an employer in both quarter t-1 and quarter t, we can say with reasonable confidence that he was an employee of that firm on the first day of quarter t (as well as the last day of quarter t-1). Thus the restrictions we add here amount to (a) the worker must be employed at the separating job on the first day of the relevant quarter, and (b) the worker must be employed at the acceding job on the last day of the relevant quarter, with both the separation and the accession occurring during the quarter.12 The additional attachment restriction in EEb compared to EEm provides greater confidence that the transition we have identified is, in fact, an employer-to-employer flow, as well as making clear the direction of this flow. Of course, the greater clarity comes at the cost of excluding some employer-to-employer flows that include very short jobs, so this definition may underestimate the true magnitude of employer-to-employer flows.
One can go farther in this direction to restrict attention to jobs that more clearly have some traction to them. In this spirit we also examine a definition of E-to-E flows that includes only jobs that we can tell last for at least one full quarter, which, in our quarterly data, means that
positive earnings in the match were observed in three consecutive quarters. That is, we can infer that individual ![]() worked for firm
worked for firm ![]() for the entirety of quarter
for the entirety of quarter ![]() if
if ![]()
![]() = 1,
= 1, ![]()
![]() = 1, and
= 1, and ![]()
![]() = 1.
Full-quarter E-to-E flows are then defined as flows in
= 1.
Full-quarter E-to-E flows are then defined as flows in ![]() from one full-quarter job in
from one full-quarter job in ![]() to another full-quarter job in
to another full-quarter job in ![]() . More formally:
. More formally:
(5) Full-Quarter Employer-to-Employer Transition (EEf![]() : individual
: individual ![]() transitions from firm
transitions from firm ![]() and to firm
and to firm ![]() during
during ![]() :
:

This definition excludes a greater number of true E-to-E transitions involving short-term jobs than does the EEb definition. This may be an advantage or a disadvantage depending on the question and the population under consideration, but we expect the EEf definition to understate the overall number of E-to-E flows. This measure does have the advantage of allowing us to better examine earnings transitions associated with flows between employers, because we observe a full quarter of earnings at both the origin and the destination jobs. We will use full-quarter flows mainly when estimating earnings growth associated with flows from employer to employer.
Applying these definitions is straightforward if a person experiences no more than one separation and no more than one accession each quarter. However, the application is more complicated if a person experiences multiple separations or accessions in a quarter such that more than one pair of jobs would fit the definition of an E-to-E flow. For purposes of counting the number of E-to-E transitions, we impose the rule that a given separation or accession can contribute to only one E-to-E transition. Even so, for more general purposes there remains the problem of pairing the separations with the accessions so as to identify the origin and destination job in each transition. We would like to pair origin and destination jobs that play similar roles in the worker's career, those that the worker herself would identify as replacing each other. To take an extreme example, we would not like to pair a separation from a full-time job with an accession to a part-time weekend job, if more equal pairings are possible.13
Given the limited information at our disposal, we do this by pairing jobs with the most similar relative earnings. Lacking data on the number of hours or weeks worked during a quarter, we recognize that the relative earnings of jobs in a single quarter can be influenced by when during the quarter each job began or ended, and by transitory fluctuations in hours worked. In order to minimize these influences, we compare earnings-weighted average quarterly earnings.14 When there exist multiple job separations or job accessions for a worker in a particular quarter, we take the separating job with the greatest average earnings over the previous four quarters and match it to the accession with the greatest average earnings in the subsequent four quarters. We refer to this match as the `primary' employer-to-employer flow in a quarter. If after pairing the separation and accession with the greatest earnings there remains another unmatched separation/accession pair, the separation and accession with the next highest earnings are matched. And so on until there is no potential accession/separation pair that matches the job attachment criteria for the particular flows measure. As it happens, multiple E-to-E flows in a quarter are fairly rare, generally less than 0.5% of flows in any quarter.
A related issue is identifying the importance of the separating and acceding jobs to the person's career. For example, we would like to differentiate between transitions from a main job to another main job versus transitions involving secondary jobs. To do this, we compare earnings weighted average earnings in the previous four quarters for separating jobs to those in all other jobs (both separating and otherwise) in that same period; the job with the highest average earnings we define as a main job. We do the same for acceding jobs, looking forward four quarters. Employer-to-employer flows involving main jobs as both the origin and destination job we define as `main-to-main' job flows. About 96% of E-to-E flows in an average quarter of our sample are main job to main job flows by this definition.
IV. Empirical Patterns of E-to-E Flows
For the current analysis, we construct a 13-year panel of linked employer-employee data by pooling the wage histories of three large LEHD states that have data from 1991-2003.15 We include in our sample both male and female workers, age 15-99, although we break out much of our subsequent analysis by age groups. We impose no earnings restrictions other than those discussed in the previous methodology section requiring positive earnings to identify employment at the firm. We have calculated transitions only within each state; transitions from an employer located in one state to an employer located in another state are lost. None of the selected states have a large metropolitan areas at the border of the state that would be conducive to a large number of cross-state transitions. 16
A. The overall size of E-to-E flows
Table 2 summarizes the magnitude of employer-to-employer flows in LEHD data, using both our primary flows measure (EEb) as well as our more restrictive measure (EEf). First we will discuss the results for our primary EEb flows measure. Overall, we find that 3.9% of jobs held on the first day of the quarter experience a separation from that job and an accession to a new employer during the quarter. Using employment as a denominator instead of jobs, the figure is very similar: 4.1% of persons employed on the first day of the quarter separate from an employer during the quarter and are employed at the new job on the last day of the quarter. As a percentage of separations, 27% of workers separating from jobs during the quarter have a new employer on the last day of that quarter. This is a significant amount of job reallocation occurring in the economy in any given quarter. Note that while our estimate of a 4% quarterly E-to-E rate is somewhat lower than the quarterly employer-to-employer transition rate implied by the 2.6% monthly E-to-E rate Fallick and Fleischman found in the CPS, it is much closer than the very high rate we found in our preliminary analysis of EEm flows, which likely included instances of multiple job holding. This gives us greater confidence in using EEb as our primary E-to-E flow measure.
Table 2 also summarizes the magnitude of flows for the more restrictive EEf flows measure. The EEf measure restricts itself to longer jobs - those that last at least one quarter. We find that 2.2% of jobs held for all of the previous quarter experience a separation from that job and an accession to a new job that lasts at least one quarter. This is lower than the transition rate that includes shorter jobs, not surprisingly. This is partly due to the lower separation rate from longer jobs but also due to the lower percentage of full-quarter separations that involve an EEf flow. Only 20% of separations from jobs held at least one quarter are to a new job held at least one quarter. Although this restriction is interesting for some purposes, particularly the analysis of employer-to-employer transitions involving longer jobs, our primary purpose for introducing it is to utilize the full quarter of earnings at separating and acceding jobs to have an apples-to-apples comparison for measuring earnings changes. We will not impose it until we come to discuss the earnings changes associated with E-to-E transitions.
Table 3 breaks out employer-to-employer transitions by whether the flows involve main or secondary jobs.17 Most jobs in our data are main jobs, with only 5.9% of workers in our data holding multiple jobs on the first day of a given quarter. The overwhelming majority of our E-to-E flows are flows from one main job to another (96%). Our estimate of the E-to-E rate for main jobs, 3.9%, is similar to that for all jobs. We would expect that most workers would be less likely to leave their main jobs voluntarily without another job already lined up or particularly good prospects, than they would be to leave a secondary job under such circumstances, and our results confirm this. We find that separations are less common from main jobs (13%) than from secondary jobs (31%), and that separations from main jobs are much more likely to result in a flow to another employer (29%) than separations from secondary jobs (8%).
The E-to-E flow rates derived from the CPS by Fallick and Fleischman, mentioned above, are based on comparisons of main jobs from one month to the next. The main job measures in Table 3 should therefore be more comparable to the CPS definition. Our estimate of a 3.9% quarterly E-to-E rate is lower than three times the 2.6% monthly E-to-E rate Fallick and Fleischman found in the CPS. There are several reasons that estimates of E-to-E flows may differ between the LEHD and the CPS. First, our definition of the main job, based on an explicit ranking by earnings, need not match the subjective concept of a main job used in the CPS. However, the similarity of our estimates of E-to-E flow with and without the restriction to main jobs suggests that this does not explain much of the discrepancy. Probably more important are differences between a monthly point-in-time measure of employment as in the CPS and the quarterly earnings measures developed with the LEHD. In particular, the requirement in our preferred definition that separating jobs are held on the first day of the quarter and acceding jobs are held on the last day of the quarter eliminates many E-to-E flows involving very short-duration jobs.18 Other differences between the CPS and our LEHD pooled state sample will result in differences between the two estimates. First, as noted at the outset, the figures reported here from the LEHD represent only 3 states. Second, the two sources differ in scope (for example, the CPS includes the unincorporated self-employed). Third, the sample periods do not match exactly (1992-2002 vs. 1994 to 2003). Nevertheless, despite these differences in data and methodology, the two sources yield estimates that are roughly comparable in magnitude when it comes to the importance of E-to-E flows, with Fallick and Fleischman finding that E-to-E transitions constitute 39% of main job separations, compared to the 29% figure in our data.
B. Fluctuations and Trends in E-to-E transitions.
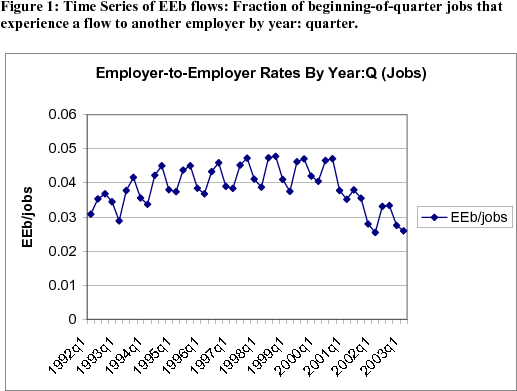
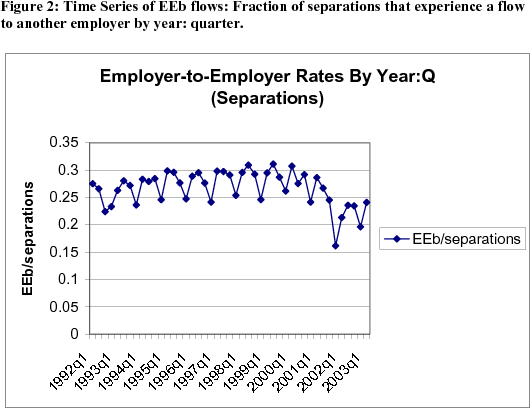
Figures 1 and 2 show our estimates of how the quarterly E-to-E rate has changed over time between 1992 and 2003. The popular perception is that United States has become an ever more transient labor market, wherein workers change jobs more often, both from choice and necessity, and contingent work arrangements have become more common. As background, in the states in our study, overall labor market transitions - both the rates of separation and of accession - rose slightly during the 1990s and fell beginning in 2001. Similarly, as discussed in DFH, the BED data shows that job creation and job destruction both increased slightly over the expansion of the 1990s and fell during the recession, with some recovery having begun only in since 2003. In addition, DFH show that unemployment inflows and outflows (measured from the CPS) also exhibit a declining trend over this period. These patterns of worker, job and unemployment flows suggest if anything a declining trend in the pace of churning of workers and jobs over the last 15 years or so.
E-to-E flows provide a unique measure of churning since this flow inherently reflects both sides of the separations/accessions accounts. What we see, whether looking at E-to-E transitions as a fraction of employment or as a fraction of separations, is that E-to-E rates rose from 1992 to 2000, fell dramatically in 2001, and stabilized in 2002 and 2003 at a lower level than in the 1990s. We find that the correlation between the underlying net growth rate of employment (for the states we use for this analysis) and the E-to-E flows is strongly positive - at an annual frequency the correlation is 0.82 (with a standard error of 0.006).19 While this is just one cyclical episode, it is nevertheless striking that employer-to-employer transitions are so cyclically sensitive. Unfortunately, our data stop just as the labor market began to seriously recover. Thus, we cannot infer a secular trend from our period of study. However, our finding that the pace of the E-to-E flows remains low in the post-2001 period is consistent with the declining pattern of job and worker flows found in DFH.
There is also a pronounced seasonal cycle in the pattern of E-to-E flows. In our sample, E-to-E flows as a fraction of jobs are more common in the third quarter, with the second quarter also high for much of the period. On average over our sample period, the E-to-E rate, as a fraction of jobs, is 4.0% in the third quarter, compared to a low of 3.5% in the first quarter. Interestingly, the seasonal pattern is different as a fraction of separations, where the stand-out is the low rate at which separators move to new employers in the fourth quarter of the year. Not surprisingly, however, these patterns are not entirely uniform either across states or across industries. The seasonality of E-to-E flows raises many interesting questions and deserves further exploration. We leave such exploration for future work.
C. The distribution of E-to-E flows
We have documented that employer-to-employer flows are common, in the sense that the magnitude is large. We would also like to know how common such flows are in the sense of being experienced widely across workers and firms. In terms of the limited demographic characteristics available to us at this point, E-to-E flows are fairly widespread. Age is the major source of concentration, although education also plays some role. The difference across gender is minimal.
It has been well known from sources like the NLSY that turnover, including E-to-E rates, falls rapidly with age from the early post-schooling years through early middle age. Less was known about E-to-E flows at older ages. Fallick and Fleischman found that E-to-E rates (relative to employment) were fairly stable from about the mid-40s on, despite an increase in separation rates that becomes quite steep around retirement ages. The LEHD data tell a somewhat different story. Figure 3a shows that E-to-E rates fall continuously with age before flattening out in the mid 60s.20 Figure 3b shows that the fraction of separations that are E-to-E transitions, not surprisingly, falls rapidly in ages in the early 60s, as retirements presumably take up a large share of separations.
Figure 4 shows that differences by education are not as pronounced. Relative to employment, E-to-E rates are lower for workers with more education. However, much of this simply reflects greater general turnover among less educated workers. When viewed relative to separations, E-to-E rates fall more gently as education rises.21
These demographic differences show that while E-to-E flows are quite widespread, some workers are more likely than others to change employers. But, of course, there is a great deal of heterogeneity not accounted for by the crude demographic characteristics we have available, and many workers change employers repeatedly. Table 4 examines to what extent frequent job changers dominate the overall rate of flows. It shows the frequency of E-to-E transitions (conditional on being employed) in the first quarter of 1997, broken down by the number of E-to-E transitions a person has made in the three-year period 1994-1996. Even among those who have made no E-to-E transitions during the 1994-1996 period, 2.6% changed employers in 1997q1. Not surprisingly, however, the likelihood of an E-to-E transition (conditional on being employed) is higher for those who have made such a transition recently, and rises with the number of recent E-to-E transitions. For the most part, this is because workers who changed employers more frequently in the previous few years are more likely to separate in general from their current employers, but, as the right-most column shows, even as a fraction of separations E-to-E rates are higher for those who recently changed employers more often.
This pattern of Aoccurrence-dependence@ is reflected in the concentration of E-to-E flows among workers. As shown in second panel of Table 4, about 4% of E-to-E transitions in a three-year period (1994-1996) are accounted for by the 1% of workers who change employers most frequently (who happen to make at least 5 E-to-E transitions in the 1994-96 period). About 53% percent of E-to-E flows are accounted for by the 25% of workers who have had more than one E-to-E flow over the period.
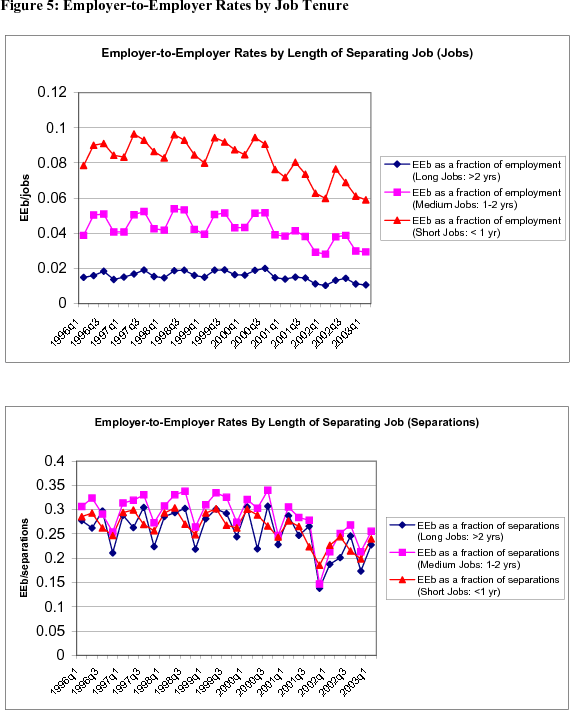
Another side to this die is the way in which the rates of E-to-E flows vary by job tenure. Figure 5 shows that the fraction of workers who change employers is lower among workers with more tenure, in keeping with their overall lower rates of separation. But among those who do separate, there is not a straightforward relationship between tenure and the probability that the separation is an E-to-E transition. As a fraction of separations, higher-tenure workers (defined as those with their employer for more than two years) have similar E-to-E rates as low-tenure workers (defined as those with their employer less than one year), but lower E-to-E rates than medium-tenure workers (with their employers one to two years).
Similarly, some employers are more likely than others to be a source of E-to-E flows. The top panel of figure 6 divides the firms in our sample into five approximate quintiles, weighted by employment, according to the percentage of their average workforce that changes employer each quarter. In the middle quintile, firms with "average" E-to-E outflows see about 1.8% of their workforce change employers each quarter. But E-to-E flows are highly concentrated: The highest-EE quintile of employers accounts for nearly two-thirds of all E-to-E flows, while the bottom quintile accounts for almost none. As you can see from the right-most bar in each set, this concentration of E-to-E flows is not entirely attributable to the concentration of overall separations among firms. While there is some association between the two, the highest quintiles share of E-to-E flows exceeds its share of separations in general by 20 percentage points, while the lowest quintile, which sees almost no E-to-E flows, accounts for a little more than 10% of overall separations.
D. Destination jobs
To the extent that employer-changes are voluntary, we would expect workers to be more satisfied, on average, with their new jobs than with their old. One manifestation of this would be longer average tenures at the destination jobs than at the jobs of origin. Especially among young workers, who account for a disproportionately large share of E-to-E flows, aging and experience gained would also tend toward progressively more stable employment relationships, and so longer average tenure at the new jobs. The long temporal reach of the LEHD allows us to examine this question. We find that E-to-E flows do appear to move workers toward longer job tenures. Table 5 divides the employer-employee matches in our sample into three categories: those that last less than one year (short), those that last 1-2 years (medium), and those that last more than 2 years (long).22 Short jobs constitute a disproportionately large share of both the origins and the destinations of E-to-E flows. However, a larger proportion of E-to-E flows begin in short jobs than end there (53% vs. 47%), and a considerably larger share of E-to-E flows end in long jobs than begin there (25% vs.19%). One would also expect that workers voluntarily switching from relatively good job matches (i.e. longer tenure jobs) would also be, on average, more satisfied with their new job than those leaving worse matches. The high rate at which workers separating from longer tenured jobs move to another long job - 43% of E-to-E flows involving separations from longer jobs are to another long job - suggests this is indeed the case.
Similarly, to the extent that employer changes are voluntary, we would expect them to be associated, on average, with increases in earnings. This appears to be the case as well. Figure 7 shows the median percent change in earnings for moves from one full-quarter employer to another.23 For comparison, the figure also shows the median changes for full-quarter workers who do not separate from their employers. The median changes in earnings for employer-changers are large, and much larger than the median changes for non-separators. And for employer-changers, more than for non-separators, the earnings changes dropped off markedly when the labor market weakened moving toward the recession in 2001. Presumably a much larger proportion of the employer-changers during this period lost their jobs and faced earnings losses, or at least smaller gains, upon reemployment.
While the median worker who makes a job-to-job transition experiences an earning increase, there is substantial dispersion in the distribution of earnings changes. The earnings change from job-to-job transitions at the 25th percentile is -14 percent and is 37 percent at the 75th percentiles. Like for the median, these patterns are procyclical with the 25th percentile earnings change falling to -17 percent and the 75th percentile falling to 33 percent in 2001. The finding of substantial earnings reductions for a non-trivial fraction of job-to-job transitions suggests that not all such transitions are voluntary at least in the sense that they reflect transitions initiated solely by the worker in order to obtain earnings gains.
As seen in Figure 8, the earnings gains upon changing employers are greatest for younger workers. This is most marked for the youngest group of workers, the black line in Figure 8, where many of the workers may be moving from part-time in-school or summer jobs to career jobs. However, consistent with theories of job matching, it is also true for prime age groups. For the oldest group, the median earnings changes are often negative, perhaps reflecting bridge jobs with lower wage rates and reduced hours.
Many E-to-E flows serve to reallocate workers across industries. The bar chart in Figure 9 illustrates the great extent of industry-switching among employer-changers. Among workers of all ages (the right-most set of bars), approximately 60% of E-to-E movements are movements from one of the eleven NAICS super sectors to another, and only 16% of E-to-E transitions remain within the same most narrowly defined (6-digit) NAICS industry. The frequency of industry-switching varies by age, with younger workers naturally more likely to change sectors and least likely to remain within the same 6-digit industry. But even among the oldest category of workers, changing broad industries when changing employers is the norm.
The prevalence of industry-switching among E-to-E flows is thus widespread, but its extent does vary considerably by industry. The rows of Table 6 shows the percentage of E-to-E flows out of jobs in each of the eleven NAICS super sectors that remain in that super sector (the diagonal elements) or move to each other super sector. Even at this high level of industry aggregation, movements across industries are the rule. Remaining in the same supersector typically characterizes the plurality of E-to-E moves, but in only two cases does staying in the same super sector characterize even a bare majority.
Naturally, the most popular destinations for workers who switch industries via E-to-E movements differ from industry to industry. Thus, for example, workers leaving the professional & business services super sector (which includes temporary help firms) are quite likely to move into manufacturing, while those leaving leisure & hospitality are quite likely to move into trade, transportation & utilities. These patterns are often not reciprocal. For example, many of the E-to-E flows out of information are into trade, transportation & utilities, but few E-to-E flows go in the opposite direction.
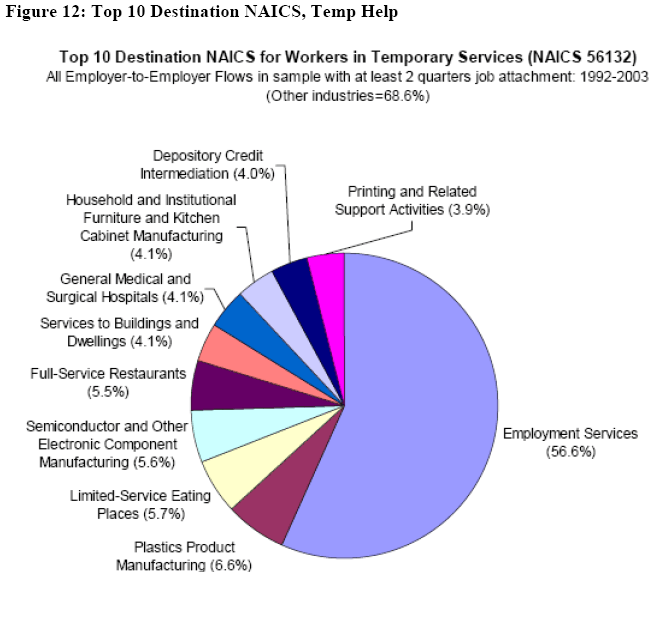
The LEHD data allow us to examine these movements across industries in great detail. Figures 10 through 12 show the top ten most common destination industries for E-to-E flows from three particular detailed industries. Two of these industries B software publishing and temporary help services B grew over the period of our data, both in absolute numbers of jobs and in their share of jobs in the economy. The third industry B textile mills B shrank both in absolute numbers and in share. For software publishing and temporary help (figures 11 and 12), which are 6-digit industries, we defined destination industries at the 4-digit level. For textile mills (figure 10), which is a 3-digit industry, we defined destination industries at the 3-digit level.
The top-ten destinations comprise almost 2/3 of the E-to-E transitions from software publishing. The most common destination - 27% of total flows - is other employers in software publishing. The remainder is dominated by other computer-related industries, mostly producers but also wholesalers and retailers. The one exception is employment services/temporary help (8% of flows), where the employees may, in fact, be working at computer-related companies.
Not surprisingly, the destinations for E-to-E transitions from temporary help agencies are more diverse, with the top ten destinations comprising a little less than 1/3 of the total. Within the top ten, the majority are other companies in employment services, with the remainder moving into a variety of manufacturing, food service, and other industries, presumably industries in which a large share of temporary help employees actually work.
For E-to-E transitions from textile mills, the top ten destinations comprise 38% of transitions. Among these, other textile mills and establishments in the related apparel manufacturing industry make up the majority. Employment services (both temporary help and professional employer organizations) and restaurants round out the top ten.
We obviously do not want to draw conclusions from just a few industries, but these examples do suggest the importance of sector-related skills and of geographic proximity, as well as the substantial role of the temporary help industry in job mobility.
V. Conclusion
In this paper, we used longitudinal linked employer-employee data from the LEHD program at Census Bureau to measure and study employer-to-employer flows. These data provide a uniquely comprehensive source of information on workers and employers, while their quarterly nature present particular challenges to measurement of flows. We find that the pace of employer-to-employer flows is high - representing about 4 percent of employment and 30 percent of separations each quarter. The pace of employer-to-employer flows is highly procyclical. The cyclicality of employer-to-employer flows is a feature of the worker and job flows that should be taken into account in interpreting and modeling labor market dynamics.
The pace of employer-to-employer flows varies systematically across worker, job and employer characteristics. For workers, employer-to-employer flows as a fraction of employment and separations declines with age through the mid 60s and then flattens out - the decline as a fraction of separations with age is especially rapid in the age range 50-65 when retirements presumably become a more important form of separation than employer-to-employer transitions. We find that less educated workers have a higher pace of employer-to-employer flows as a fraction of employment but there is no discernable pattern by education as a fraction of separations. The pattern by education reflects the higher overall rate of worker flows of less educated but conditional on a separation, education is not an important factor.
Our findings regarding job tenure and earnings dynamics suggest that for those workers moving directly to new jobs, the new jobs are generally better jobs, and that moving directly to a better job is easier during a boom than a bust. Tenure at new jobs is generally longer than at separating jobs. We find that on average workers who make employer-to-employer transitions see large increases in earnings. However, this pattern is highly procyclical. We also find a larger quarterly growth in earnings for workers making employer-to-employer transitions than for workers who remain in their same job.
There are rich patterns in terms of origin and destination of industries. We find somewhat surprisingly that a very large fraction of the workers making employer-to-employer transitions switch even broadly-defined industries. More than half of workers making an employer-to-employer transition switch NAICS super-sectors.
The focus of the current paper is primarily measurement and reporting of basic empirical patterns of employer-to-employer flows from a rich, new longitudinal employer-employee database at the U.S. Census Bureau. The magnitude and variation in employer-to-employer flows we have reported make clear that this measure of labor market dynamics should become a standard measure incorporated with measures of accessions, separations, job creation and job destruction. This measurement oriented paper is just the first step in the analysis of employer-to-employer flows. To understand the implications of employer-to-employer flows for our understanding of labor market dynamics, an obvious next step is to compare the outcomes for those workers who separate and immediately move to another job vs. those who separate and experience a spell of joblessness before finding another job. We know from the literature on job displacement (e.g., Jacobson, LaLonde and Sullivan (1992)) that workers who suffer a job loss from a business experiencing a mass layoff experience substantial earnings losses that are at least partly driven by spells of joblessness. It is clearly of interest to understand the relationship between the dynamics of the types of separations we have focused on in the current work and the type of separations associated with displacement. Exploring these issues is a high priority for future research.
Abowd, John M., John Haltiwanger, and Julia I. Lane, 2004. "Integrated Longitudinal Employee-Employer Data for the United States." American Economic Review Papers and Proceedings, 94(2): 224-229.
Abowd, John, Bryce Stephens, Lars Vilhuber, Fredrik Andersson, Kevin L. McKinney, Marc Roemer, and Simon Woodcock. "The LEHD Infrastructure Files and the Creation of the Quarterly Workforce Indicators" LEHD Technical Paper No. 2006-01.
Acs, Zolton J., Catherine Armington, and Alicia Robb, "Measures of Job Flow Dynamics in the U.S.", CES 99-1, U.S. Bureau of the Census, January 1999.
Burgess, Simon, Lane, Julia I., and Stevens, David, 2000. "Job flows, worker flows, and churning." Journal of Labor Economics 18(3): 473-502.
Davis, Steven J., Faberman, R. Jason, and Haltiwanger, John, 2006. "The Flow Approach to Labor Markets: New Evidence and Micro-Macro Links." Journal of Economic Perspectives, 20(3): 3-26.
Davis, Steven J., John C. Haltiwanger, and Scott Schuh, Job Creation and Destruction (Cambridge, MA: MIT Press, 1996).
Fallick, Bruce and Charles A. Fleischman, 2001, "The Importance of Employer-to-Employer Flows in the U.S. Labor Market," Finance and Economics Discussion Series #2001-18, Federal Reserve Board, Washington, DC.
Fallick, Bruce and Charles A. Fleischman, 2004, "Employer-to-Employer Flows in the U.S. Labor Market: The Complete Picture of Gross Worker Flows," Finance and Economics Discussion Series #2004-34, Federal Reserve Board, Washington, DC.
Golan, Amos, Lane, Julia I. and McEntarfer, Erika, 2006. "The Dynamics of Worker Reallocation Within and Across Industries." Economica (forthcoming).
Jacobson, Louis, Robert LaLonde and Daniel Sullivan, 1993 "Earnings Losses of Displaced Workers." American Economic Review, vol. 83(4), pages 685-709.
| Person/Employer Match (Job) | Q1 | Q2 | Q3 | Q4 |
|---|---|---|---|---|
| Person 1 Firm A | $0 | $500 | $0 | $0 |
| Person 1 Firm Q | $0 | $1000 | $0 | $0 |
| Person 2 Firm B | $2500 | $1500 | $0 | $0 |
| Person 2 Firm Z | $0 | $750 | $3000 | $3000 |
| Employer-to-Employer Flow Rate | Consecutive-Quarter E-to-E Flows (EEb) | Full-Quarter E-to-E Flows (EEf) |
|---|---|---|
| E-to-E flows/jobs | 0.0387 | 0.0220 |
| Persons experiencing E-to-E/employment | 0.0410 | 0.0230 |
| E-to-E flows/job separations | 0.2647 | 0.2020 |
| Persons experiencing E-to-E/persons separating from jobs | 0.2727 | 0.2045 |
Notes: Employer-to-employer flow rates are calculated as the ratio of the number of job flows (or person flows) of the flow type to the number of jobs (or separations) that have the same attachment criteria as the separating job in the E-to-E flow. Thus the denominator for EEb/separations is all
jobs for which ![]()
![]() = 1, for EEf/separations it is all jobs for which
= 1, for EEf/separations it is all jobs for which ![]()
![]() = 1. The jobs denominator is EEb flow rates is all jobs for which
= 1. The jobs denominator is EEb flow rates is all jobs for which ![]()
![]() = 1 and
= 1 and ![]()
![]() = 1. The jobs denominator for EEf flow rates is all jobs for which
= 1. The jobs denominator for EEf flow rates is all jobs for which ![]()
![]() = 1 and
= 1 and ![]()
![]() = 1 and
= 1 and![]()
![]() =
1.
=
1.
| Description: | Rate: |
|---|---|
| Proportion of workers with only a main job in a quarter | 0.9407 |
| Proportion of workers with secondary jobs in a quarter | 0.0593 |
| Separation rate from main jobs | 0.1345 |
| Separation rate from secondary jobs | 0.3145 |
| E-to-E flows/jobs: main job to main job flows only | 0.0393 |
| E-to-E flows/jobs: secondary job flows only | 0.0288 |
| Percentage of Flows: | |
| Percentage of Flows: Main job-to-Main Job | 0.9558 |
| Percentage of Flows: Main job-to-Secondary job | 0.0057 |
| Percentage of Flows: Secondary-to-Main job | 0.0102 |
| Percentage of Flows: Secondary-to-Secondary job | 0.0283 |
| Percentage of Separations: | |
| Percentage of Separations: Separation from main job into new main job | 0.2899 |
| Percentage of Separations: Separation from main job into new secondary job | 0.0017 |
| Percentage of Separations: Separations from main job that do not involve a E-to-E flow | 0.7084 |
| Percentage of Separations: Separation from secondary job into new main job | 0.0219 |
| Percentage of Separations: Separation from secondary job into new secondary job | 0.0587 |
| Percentage of Separations: Separations from secondary jobs that do not involve a E-to-E flow | 0.9194 |
Notes: All E-to-E flows are EEb flows. Separations from main jobs are defined as separations from jobs with positive earnings in t and t-1 that have the greatest earnings weighted average earnings over the last four quarters (i.e. max[(![]()
![]()
![]() w
w![]()
![]() /4]). Accessions to main jobs are defined as accessions to jobs with positive earnings
in t and t+1 that have the greatest earnings weighted average earnings in the subsequent four quarters (i.e. max[(
/4]). Accessions to main jobs are defined as accessions to jobs with positive earnings
in t and t+1 that have the greatest earnings weighted average earnings in the subsequent four quarters (i.e. max[(![]()
![]()
![]() w
w![]()
![]() /4]).
/4]).
| Flow | Proportion of workers in this group having a E-to-E flow in 1997q1 |
Proportion of separating workers in this group having a E-to-E flow in 1997q1 |
|---|---|---|
| Number of E-to-E Flows in 3 years (1994-1996) | ||
| Number of E-to-E Flows in 3 years (1994-1996): 0 | 0.02654 | 0.24878 |
| Number of E-to-E Flows in 3 years (1994-1996): 1 | 0.05833 | 0.35135 |
| Number of E-to-E Flows in 3 years (1994-1996): 2 | 0.08388 | 0.39164 |
| Number of E-to-E Flows in 3 years (1994-1996): 3 | 0.10837 | 0.41851 |
| Number of E-to-E Flows in 3 years (1994-1996): 4+ | 0.14520 | 0.44791 |
| Number of Separations in 3 years (1994-1996) | ||
| Number of Separations in 3 years (1994-1996): 0 | 0.01927 | 0.22853 |
| Number of Separations in 3 years (1994-1996): 1 | 0.03645 | 0.28907 |
| Number of Separations in 3 years (1994-1996): 2 | 0.05610 | 0.32221 |
| Number of Separations in 3 years (1994-1996): 3 | 0.07585 | 0.35161 |
| Number of Separations in 3 years (1994-1996): 4+ | 0.11191 | 0.39526 |
Percent of Total E-to-E Flows During 1994q1-1996q4 Accounted for by the Top X% of Persons Ranked by Number of E-to-E Flows During the Interval
| Number of E-to-E Flows During the Interval | % of Total E-to-E Flows |
|---|---|
| Top 1% (5+ flows) | 4.13% |
| Top 5% (3+ flows) | 24.70% |
| Top 25% (2+ flows) | 53.46% |
| Tenure at Separating Job | Tenure at Acceding Job: Short Job (2-3 quarters) | Tenure at Acceding Job: Mid-Length Job (1-2 years) | Tenure at Acceding Job: Longer Job ( |
Tenure at Acceding Job: % of all E-to-E flows |
|---|---|---|---|---|
| Short Job (2-3 quarters) | 29.49 / 55.50 | 14.35 / 27.01 | 9.29 / 17.49 | 53.13 |
| Mid-Length Job (1-2 years) | 11.94 / 49.74 | 8.42 / 30.12 | 7.59 / 27.15 | 27.94 |
| Longer Job
( |
5.51 / 29.12 | 5.32 / 28.12 | 8.09 / 42.76 | 18.93 |
| % of all E-to-E flows | 46.94 | 28.09 | 24.97 |
Notes: Tenure at separating jobs is calculated using contiguous quarters of positive wages for this worker-employer match from t to the beginning of the time series (1991q1). Tenure at acceding jobs is calculated using contiguous quarters of positive wages from t to the end of the time series (2003q4). As tenure in our data is censored on both the right and on the left, we use a mid-range year of the panel for this analysis, where there are six years of data looking backwards as well as forwards.
| Sector | A: Nat'l Resources & Mining | B: Construction | C: Manufacturing | D: Trade, Trans. & Utilities | E: Information | F: Finance Activities | G: Prof. & Bus. Services | H: Educ. & Health Services | I: Leisure & Hospitality | J: Other Services | K: Public Administration | N |
|---|---|---|---|---|---|---|---|---|---|---|---|---|
| A: Natural Resources & Mining | 34.4 | 7.66 | 17.87 | 15.07 | 0.54 | 1.16 | 12.45 | 2.65 | 5.47 | 1.63 | 1.11 | 15991 |
| B: Construction | 1.24 | 52.1 | 10.51 | 11.84 | 0.79 | 1.97 | 11.47 | 2.88 | 4.17 | 1.7 | 1.36 | 78732 |
| C: Manufacturing | 1.19 | 5.57 | 48.14 | 14.77 | 1.03 | 1.63 | 15.95 | 4.07 | 4.89 | 1.77 | 1 | 180022 |
| D: Trade, Transportation & Utilities | 0.8 | 4.48 | 11.64 | 42.74 | 1.31 | 3.93 | 13.6 | 6.75 | 10.2 | 3 | 1.54 | 276662 |
| E: Information | 0.39 | 3.19 | 8.75 | 15.63 | 31.4 | 6.59 | 18.75 | 5.77 | 6.19 | 1.81 | 1.51 | 20534 |
| F: Finance Activities | 0.3 | 3.43 | 6.24 | 14.16 | 3.26 | 37.2 | 16.85 | 8.18 | 6.51 | 2.21 | 1.64 | 51805 |
| G: Professional & Business Services | 0.76 | 4.71 | 23.99 | 15.92 | 2.56 | 5.3 | 29.82 | 7.36 | 6.08 | 2.04 | 1.46 | 239267 |
| H: Educational & Health Services | 0.3 | 1.73 | 5.55 | 10.09 | 0.83 | 3.09 | 11.73 | 54.18 | 6.17 | 2.52 | 3.8 | 136867 |
| I: Leisure & Hospitality | 0.47 | 2.6 | 7.78 | 20.14 | 0.92 | 2.71 | 11.02 | 6.9 | 43.84 | 2.45 | 1.18 | 189723 |
| J: Other Services (expt Public Admin) | 0.79 | 4.89 | 10.3 | 21.63 | 1.12 | 3.68 | 14.31 | 10.39 | 9.96 | 20.9 | 2.03 | 35414 |
| K: Public Administration | 0.69 | 5.34 | 6.81 | 15.3 | 1.3 | 3.76 | 13.16 | 22.98 | 7.92 | 3.42 | 19.31 | 19319 |
![Figure 6: Concentration of E-to-E flows in firms with many flows. Two panels. In each panel the data are plotted as five sets of three bars. Each set represents one quintile of EEb flows. In the top panel the firms are weighted by employment; in the bottom panel they are weighted by [EEb flows]. In each set, there is one (left-most) bar for the share of total E-to-E flows contained in that quintile, one (middle) bar for the share of employment contained in that quintile, and one (right-most) bar for the share of separations contained in that quintile. In the middle quintile, firms with 'average' E-to-E outflows see about 1.8% of their workforce change employers each quarter. But E-to-E flows are highly concentrated: The highest-EE quintile of employers accounts for nearly two-thirds of all E-to-E flows, while the bottom quintile accounts for almost none. This concentration of E-to-E flows is not entirely attributable to the concentration of overall separations among firms. While there is some association between the two, the highest quintiles share of E-to-E flows exceeds its share of separations in general by 20 percentage points, while the lowest quintile, which sees almost no E-to-E flows, accounts for a little more than 10% of overall separations.](figure_6.gif)
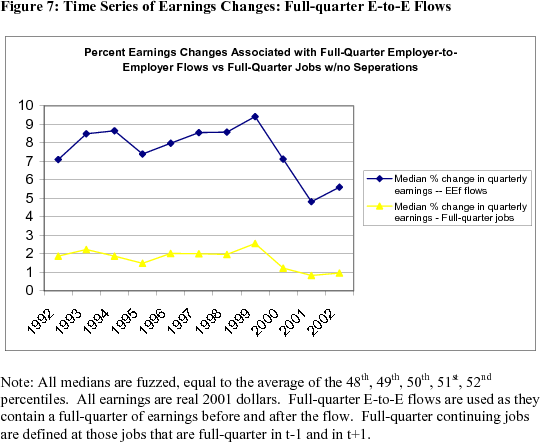
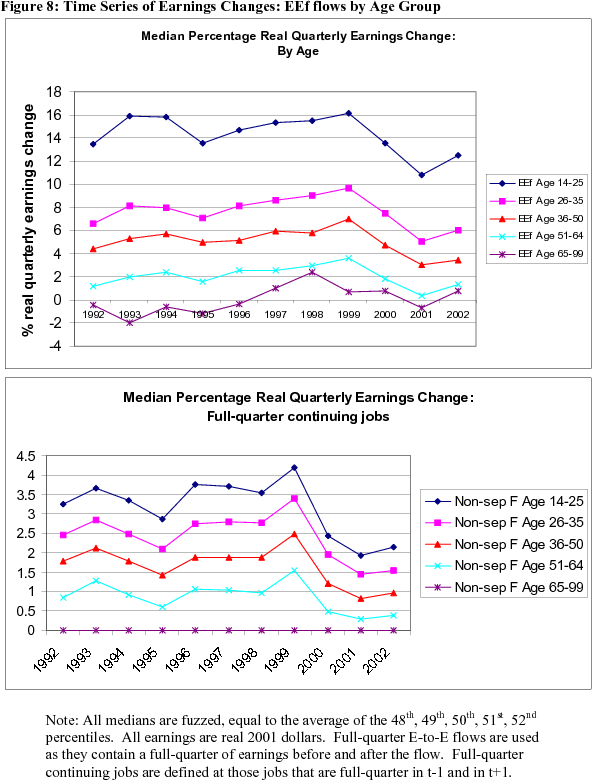
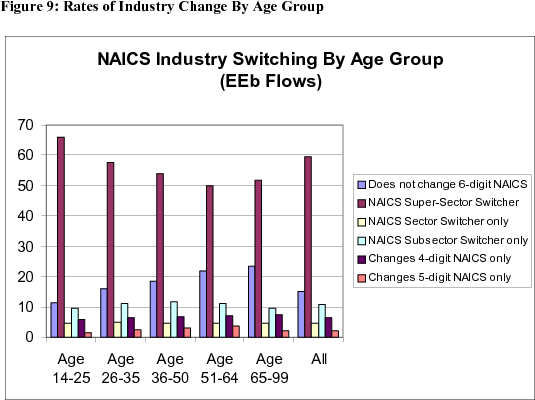
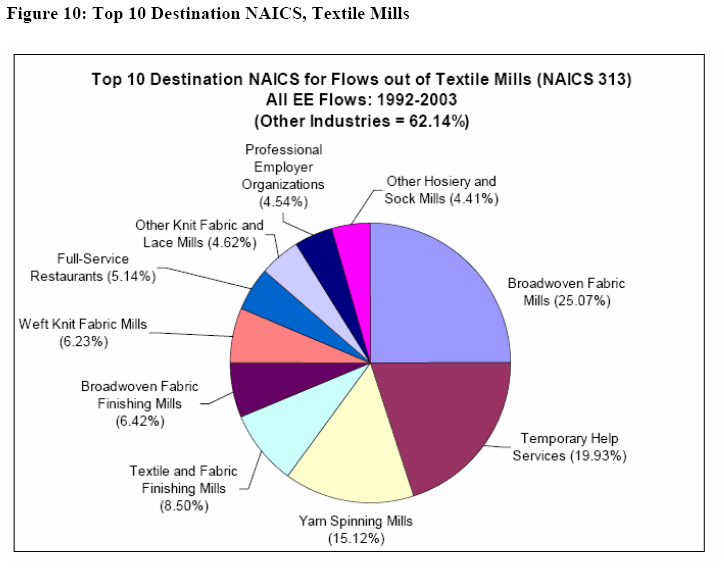
Figure 11: Top 10 destination 4-digit NAICS industries for E-to-E flows out of software publishing (NAICS 5112).
