
Board of Governors of the Federal Reserve System
International Finance Discussion Papers
Number 830r, April 2005, revised September 2006-Screen Reader Version*
Order Flow and Exchange Rate Dynamics in Electronic Brokerage System Data
NOTE: International Finance Discussion Papers are preliminary materials circulated to stimulate discussion and critical comment. References to International Finance Discussion Papers (other than an acknowledgment that the writer has had access to unpublished material) should be cleared with the author or authors. Recent IFDPs are available on the Web at http://www.federalreserve.gov/pubs/ifdp/. This paper can be downloaded without charge from the Social Science Research Network electronic library at http://www.ssrn.com/.
Abstract:
We analyze the association between order flow and exchange rates using a new dataset representing a majority of global interdealer transactions in the two most-traded currency pairs. The data consist of six years (1999-2004) of order flow and exchange rate data for the euro-dollar and dollar-yen currency pairs at the one-minute frequency from EBS, the electronic broking system that now dominates interdealer spot trading in these currency pairs. This long span of high-frequency data allows us to gain new insights about the joint behavior of these series. We first confirm the presence of a substantial association between interdealer order flow and exchange rate returns at frequencies ranging from one minute to one week, but, using our long span of data, we find that the association is weaker at lower frequencies, with far less long-term association between cumulative order flow and long-term exchange rate movements. We study the linearity and time-variation of the association between high-frequency exchange rate returns and order flow, and document an intradaily pattern to the relationship: it is weakest at times when markets are most active. Overall, our study tends to support the view that, while order flow plays a crucial role in high-frequency exchange rate movements, its role in driving long-term fluctuations is much more limited.
Keywords: order flow, foreign exchange, high-frequency data, news announcements, micro exchange rate economics, private information.
JEL Classification: F31, G14
1 Introduction
A strong positive contemporaneous association between exchange
rate returns and order flow has been documented in a number of
recent studies. Evans and Lyons (2002), for instance, in a seminal
paper, reported that a regression of Deutsche mark/dollar daily
returns on daily order flow yielded an R![]() in excess of 60%, an amazingly
strong result in the study of price discovery in foreign exchange
markets. Other authors have since confirmed the association between
order flow and returns at daily or intradaily frequencies using
several other foreign exchange datasets. However the various papers
have come to very different conclusions as to the role of order
flow in price discovery in foreign exchange markets and the
permanence of its impact.
in excess of 60%, an amazingly
strong result in the study of price discovery in foreign exchange
markets. Other authors have since confirmed the association between
order flow and returns at daily or intradaily frequencies using
several other foreign exchange datasets. However the various papers
have come to very different conclusions as to the role of order
flow in price discovery in foreign exchange markets and the
permanence of its impact.
On the one hand, Evans and Lyons (2002, 2005, 2006) argue that much of the impact of order flow in their data is permanent and that fundamental macroeconomic information is revealed to the market and becomes embedded in prices via order flow. Love and Payne (2004) and Marsh and O'Rourke (2005), among others, find that their data lead them to the same general conclusion. On the other hand, Froot and Ramadorai (2005), for example, conclude that, in their data, order flow is associated only with transitory exchange rate movements and does not convey information to market participants about macroeconomic fundamentals. They label their conclusion the ``weak flow-centric'' view, in contrast to Evans and Lyons' ``strong flow-centric'' view. Among other papers falling more on the side of Froot and Ramadorai, Breedon and Vitale (2004) conclude that ``the strong contemporaneous correlation between order flow and exchange rates is mostly due to liquidity effects.''
It is difficult to reconcile these sharply-contrasting conclusions, as the various papers have used datasets with very different characteristics in their empirical work. The datasets vary in frequency, span, period of coverage, and segment of the market in which the order flow is recorded. The work of Evans and Lyons (2002), for instance, was based on their analysis of 4 months of high-frequency data from the Reuters direct-dealing interdealer electronic platform in 1996, and the same data were used in Evans and Lyons (2006) to study the role of order flow at times of news releases. Breedon and Vitale (2004) studied high-frequency brokered electronic interdealer data, spanning 6 months in 2000 and 2001, but reached conclusions different from Evans and Lyons. Long spans of daily customer-to-dealer order flow, each from a single institution, were used by Evans and Lyons (2005) and Froot and Ramadorai (2005) to reach their opposite conclusions. Overall, the existing literature has analyzed either relatively short spans of high-frequency interdealer data from various trading platforms or longer samples of daily single-institution customer-to-dealer data.
The structure of the foreign exchange market has, however, changed considerably over the past few years, yielding new data that may help resolve some of this uncertainty. Since the late 1990s, two electronic platforms have taken a leading role in interdealer spot trading, one offered by EBS and the other offered by Reuters, both electronic limit order books. Importantly, on a global scale, interdealer trading in each major currency pair has become very highly concentrated on one of the two systems. Of the most-traded currency pairs, the top two, euro-dollar and dollar-yen are, across the globe, have, for several years, been traded primarily on EBS, while the third, sterling-dollar is traded primarily on Reuters. As a result, for instance, the current EBS euro-dollar exchange rate is now universally used to generate customer quotes and to price derivatives.
In this paper, we analyze a new dataset of minute-by-minute order flow and exchange rate returns on the EBS platform for the euro-dollar and dollar-yen currency pairs from January 1999 through December 2004, data which have not been previously available. This dataset represents a clear majority of global trading in the interdealer spot market for the two major currency pairs over a span of six years, and is unique in having all of these features.1
Using these data, we find a strong contemporaneous association
between exchange rate returns and interdealer order flow at
intradaily and daily frequencies: a regression of daily exchange
rate returns on contemporaneous daily order flow yields a
significant positive coefficient with an R![]() of about 45% for euro-dollar and
50% for dollar-yen, in line with previous results. However, our
long span of data gives us more power to test the strength of the
association at lower frequencies, and we find that the association
weakens notably at the one- and three-month frequencies. Thus,
longer swings in the euro-dollar and dollar-yen exchange rates over
the period do not seem to be as strongly associated with
interdealer order flow as the analysis of shorter spans of data may
have led us to believe. Next, we uncover a pattern of non-linearity
in the return-order flow relationship at very high frequency and
document an intradaily pattern to the association between
one-minute order flow and one-minute exchange rate returns —
the relationship is weakest at times when markets are most active.
Using rolling regressions, we also consider lower-frequency
time-variation in the relationship between order flow and exchange
rate returns, finding in particular that the association seems to
have weakened somewhat since 2001, likely consistent with an
improvement in market liquidity. Finally, we study patterns in
order flow around important scheduled U.S. macroeconomic data
releases. Overall, our analysis of this important dataset offers
far more support for the ``weak flow-centric'' view of the role of
order flow than for the ``strong flow-centric'' view: global
interdealer order flow has an undeniable short- and medium-term
impact on exchange rate variations, but much less explanatory power
for long-term exchange rate movements.
of about 45% for euro-dollar and
50% for dollar-yen, in line with previous results. However, our
long span of data gives us more power to test the strength of the
association at lower frequencies, and we find that the association
weakens notably at the one- and three-month frequencies. Thus,
longer swings in the euro-dollar and dollar-yen exchange rates over
the period do not seem to be as strongly associated with
interdealer order flow as the analysis of shorter spans of data may
have led us to believe. Next, we uncover a pattern of non-linearity
in the return-order flow relationship at very high frequency and
document an intradaily pattern to the association between
one-minute order flow and one-minute exchange rate returns —
the relationship is weakest at times when markets are most active.
Using rolling regressions, we also consider lower-frequency
time-variation in the relationship between order flow and exchange
rate returns, finding in particular that the association seems to
have weakened somewhat since 2001, likely consistent with an
improvement in market liquidity. Finally, we study patterns in
order flow around important scheduled U.S. macroeconomic data
releases. Overall, our analysis of this important dataset offers
far more support for the ``weak flow-centric'' view of the role of
order flow than for the ``strong flow-centric'' view: global
interdealer order flow has an undeniable short- and medium-term
impact on exchange rate variations, but much less explanatory power
for long-term exchange rate movements.
The plan for the remainder of this paper is as follows. In section 2, we describe the data that we use in this paper. Section 3 reports our results on the relationship between order flow and exchange rate movements at different frequencies. Section 4 considers non-linearity and time-variation in the link between order flow and exchange rates, including variation over the full sample and intradaily patterns in the association. Section 5 studies the patterns in order flow around important scheduled U.S. macroeconomic data releases. Section 6 concludes.
2 The Data
The EBS data that we use in this study consist of three time series at the one-minute frequency: the volume (in base currency) of buyer-initiated trades in each minute, the volume of seller-initiated trades in each minute, and the one-minute exchange rate returns. The data span January 1999 to December 2004 for the dollar-yen and euro-dollar currency pairs. These EBS data, which are proprietary and confidential, do not contain any information on the identity of market participants.2
A buyer-initiated trade is a transaction where a quote offering to sell euros for dollars, or dollars for yen, placed in the EBS system by one dealer is dealt on by another dealer, who is then seen as the aggressor, or the initiator of the transaction (and buys euros or yen, respectively). A seller-initiated trade is of course defined similarly. The trades in our dataset are signed as buyer-initiated or seller-initiated by the EBS computer system, so we do not have to rely on an algorithm to estimate the direction of trade. Order flow is defined as the difference between the volume of buyer-initiated trades and that of seller-initiated trades, measured in base currency. A positive value of order flow therefore indicates a net excess of buyer-initiated trades. 3
We exclude all data collected from Friday 17:00 New York time through Sunday 17:00 New York time from our sample, as foreign exchange trading activity during these hours is minimal. We also drop certain holidays and days of unusually light volume: December 24-December 26, December 31-January 2, Good Friday, Easter Monday, Memorial Day, Labor Day, Thanksgiving and the following day, and July 4 (or, if this is on a weekend, the day on which the Independence Day holiday is observed). Similar conventions were adopted by Andersen, Bollerslev, Diebold and Vega (2003). To construct a minute-by-minute price series, we use the midpoint of the best bid and the best ask price in the system at the start of each minute and calculate continuously compounded one-minute returns. That is, we compute our returns as 10,000 times the one-minute change in the log exchange rate. Our returns have therefore the interpretation of (approximately) the percentage change in the exchange rate multiplied by 100, and so the units can be thought of as basis points of exchange rate movements.
Table 1 reports some summary statistics. The table shows the mean, standard deviation, minimum, and maximum of the order flow at several frequencies ranging from one minute to one month. The proportion of observations for which the order flow is positive at each frequency is also shown. For both currency pairs, the mean order flow is positive. Although it is only very slightly positive at the one-minute frequency, it turns out that if one aggregates to, for instance, the daily frequency, about 70 percent of days have positive order flow. This is somewhat surprising and puzzling, but the same phenomenon has been found by other authors including Dunne, Hau and Moore (2004) and Evans and Lyons (2002) and, in analysis of the GovPX Treasury market trading platform, by Brandt and Kavajecz (2004).4 Table 2 reports autocorrelation coefficients for order flow at frequencies ranging from one minute to one month. Order flow tends to be positively autocorrelated at the highest frequencies. We also note some first-order autocorrelation at the daily and weekly frequencies in both currencies.
3 Order Flow and Exchange Rate Returns: the Basic Relationship
To study the contemporaneous relationship between order flow and exchange rate movements at various frequencies, we first ran regressions of the form
where
Figure 1 plots the estimated slope coefficients and
R![]() s from this
regression against
s from this
regression against ![]() , for
the euro-dollar and dollar-yen currency pairs. The plots of the
estimated slope coefficients include 95 percent confidence
intervals, constructed using heteroskedasticity-robust standard
errors.5 At the
one-minute frequency, the coefficient
, for
the euro-dollar and dollar-yen currency pairs. The plots of the
estimated slope coefficients include 95 percent confidence
intervals, constructed using heteroskedasticity-robust standard
errors.5 At the
one-minute frequency, the coefficient ![]() is significantly positive and the
R
is significantly positive and the
R![]() is 36% for the
euro-dollar and 30% for the dollar-yen. An excess of
buyer-initiated trades is associated with a rising price, with an
order imbalance of 1 billion (of the base currency) estimated to
lead to about a half-percent appreciation (precisely 55 basis
points in euro-dollar and 72 basis points in dollar-yen). At the
daily frequency, the R
is 36% for the
euro-dollar and 30% for the dollar-yen. An excess of
buyer-initiated trades is associated with a rising price, with an
order imbalance of 1 billion (of the base currency) estimated to
lead to about a half-percent appreciation (precisely 55 basis
points in euro-dollar and 72 basis points in dollar-yen). At the
daily frequency, the R![]() s are about 50%, and the estimates of
s are about 50%, and the estimates of ![]() are very significantly positive,
about 40 basis points per billion for each currency pair, only a
bit less than the Evans and Lyons (2002) estimates. However, at the
monthly frequency, the R
are very significantly positive,
about 40 basis points per billion for each currency pair, only a
bit less than the Evans and Lyons (2002) estimates. However, at the
monthly frequency, the R![]() s fall to about 20% and 30% for the euro-dollar
and dollar-yen currency pairs respectively, and the
s fall to about 20% and 30% for the euro-dollar
and dollar-yen currency pairs respectively, and the![]() is estimated to be about 20
basis points. At the two- and three-month frequencies, the
R
is estimated to be about 20
basis points. At the two- and three-month frequencies, the
R![]() s continue to
decline. The pattern is clear--the association between order flow
and exchange rate returns is strong at the intradaily, daily, and
weekly frequencies, but then declines gradually at lower
frequencies.6
s continue to
decline. The pattern is clear--the association between order flow
and exchange rate returns is strong at the intradaily, daily, and
weekly frequencies, but then declines gradually at lower
frequencies.6
Figure 2 shows a daily time series of the euro-dollar and dollar-yen exchange rates and of the corresponding demeaned cumulative order flows from 1999 through 2004. The relationship between the two time series appears consistent with the regression results displayed in Figure 1. An association between high-frequency movements in order flow and exchange rates is often apparent. Indeed, there are many periods where cumulative order flow and exchange rates track each other quite closely. However, overall, there is little evidence of a strong low-frequency association between cumulative order flow and exchange rate returns. Evans and Lyons (2002), for instance, showed graphs of cumulative order flow and exchange rates over a four month period and found a remarkably close relationship. Studying Figure 2, there are clearly periods with a similarly tight link between cumulative order flow and exchange rates, some lasting perhaps a year or more, but there are also obvious periods of similar length with little or no association.
Figure 3 shows cross-correlograms of returns and order flow for
both currency pairs at weekly and monthly frequencies, with leads
and lags of 30 weeks and 6 months, respectively. Critical values
for these cross-correlations to be significantly different from
zero at the 5% level are also shown. The strong positive
contemporaneous association between returns and order flow found in
the regression results is obvious. However, we also note the
presence of negative cross-correlations between returns and order
flow at a number of leads and lags in both currency pairs, often
statistically significant, particularly at a monthly frequency. The
results are also consistent with those displayed in Figures 1 and
2, with the negative autocorrelations at some weekly and monthly
intervals linked to the reduced R![]() s observed at longer horizons in the estimation of
equation (1).
s observed at longer horizons in the estimation of
equation (1).
The findings shown in Figures 1, 2, and 3, are consistent with
an interpretation of the association between exchange rate returns
and order flow as reflecting principally a temporary--although
relatively long-lasting--liquidity effect. They are also perhaps
consistent with a behavioral interpretation of the sort advocated
by authors such as Barberis and Shleifer (2003) and discussed by
Froot and Ramadorai (2005), who found that, in their sample,
institutional-investor order flow was highly correlated with
exchange rate returns at short horizons but essentially
uncorrelated at long horizons.7 But our
results appear to offer little support to the idea that order flow
has a central role in driving long-run fundamental currency values
— the ``strong flow-centric'' view. Still, it seems worth
remembering that the R![]() s near 0.2 that we find for our return-order flow
regressions at longer horizons would have been viewed as a great
advance in explaining exchange rate movements prior to the work of
Evans and Lyons.
s near 0.2 that we find for our return-order flow
regressions at longer horizons would have been viewed as a great
advance in explaining exchange rate movements prior to the work of
Evans and Lyons.
Our finding that the association between returns and interdealer
order flow is simultaneously quite strong at high frequencies and
much weaker at horizons of one month and longer implies some
predictability in either exchange rate returns or order flow (or
both) at lower frequencies. But we would expect any out-of-sample
predictability of either of these variables, especially the
exchange rate, to be slight. Recently, Bacchetta and van Wincoop
(2006), proposed a model that gives a micro-founded theoretical
basis for the role of order flow in exchange rate movements. The
benchmark parameterization of this model gives monotonically
increasing R![]() s in the
regression of returns on order flow (our equation (1)) as the frequency of observation decreases. However,
Bacchetta and van Wincoop note that, under some other parameter
values, the relationship between returns and order flow gets weaker
at longer horizons, with R
s in the
regression of returns on order flow (our equation (1)) as the frequency of observation decreases. However,
Bacchetta and van Wincoop note that, under some other parameter
values, the relationship between returns and order flow gets weaker
at longer horizons, with R![]() s decreasing, consistent with our results.8
s decreasing, consistent with our results.8
We conclude this section with a little more discussion about what these results mean for the existence of information asymmetries about long-run fundamentals in the foreign exchange market. Order flow is simply a way of partitioning market participants into two groups: the active parties (the initiators of the trades) and the passive parties. A correlation between this measure and long-run exchange rate movements would indicate that the active parties had superior information about factors driving the fundamental values of exchange rates. We find little such correlation, implying only limited evidence for information asymmetry between the active and passive parties in the interdealer foreign exchange market. Our results are however quite agnostic as to the existence of an informational advantage by some foreign exchange market participants about the long-run fundamental values of exchange rates. It could be that there exists some other way of partitioning agents into informed and uninformed groups such that the net buying orders of the informed group would be highly correlated with long-run exchange rate movements, implying an important information asymmetry. Such information asymmetries might be apparent when using order flow from the customer-to-dealer sector of the market, if certain groups of customers have informational advantages or disadvantages, as suggested by Evans and Lyons (2005). Still, given that the EBS data we use represent the central site of price discovery for these two exchange rates, our findings clearly cast some doubt on the idea that the short-term explanatory power of order flow comes from it containing substantial information about factors driving the long-run fundamental values of exchange rates.
4 Non-Linearity and Variation over Time of the Return/Order Flow Relationship
Our long span of data at very high frequency also allows us to study the linearity and the stability of the relationship between exchange rate returns and order flow. Figure 4 shows scatterplots of the returns and order flow in the euro-dollar and dollar-yen currency pairs at the one-minute and one-day frequencies, along with fitted lines from the OLS regressions and non-parametric estimates of the relationship derived using the Nadaraya-Watson estimator. The scatterplots clearly show the systematic positive relation obtained in the linear regressions, and it is obvious that the relations at the one-minute and one-day frequencies are not the result of a small number of outliers. However, at the one-minute frequency, the scatterplots do suggest some nonlinearity in the association, and this is confirmed by the non-parametric estimation. At this very high frequency, the nature of the nonlinearity is that large order flow imbalances, both positive and negative, have a smaller incremental effect on the exchange rate. This concurs with the findings of Jones, Kaul and Lipson (1994) in equity markets. It is, however, not consistent with the idea (and the common wisdom among traders) that large order imbalances are more likely to convey information and should therefore have a proportionally larger impact on prices. At the daily frequency, in contrast, the association between returns and order flow is quite linear, and the OLS estimates and the non-parametric estimates are very close to each other.
The association between order flow and exchange rate returns may vary over time, and any such time-variation may shed light on the source and interpretation of the relationship between order flow and exchange rates. We first studied intradaily variation in the association between order flow and exchange rate returns. To this end, we considered the regression
where ![]() and
and ![]() denote one-minute returns and
order flow, respectively, and
denote one-minute returns and
order flow, respectively, and ![]() is a dummy variable that takes on the value
1 iff observation
is a dummy variable that takes on the value
1 iff observation ![]() is in
the
is in
the ![]() th half-hour interval
of the day (measured in New York time). This regression was run at
the one-minute frequency. Estimates of the coefficients
th half-hour interval
of the day (measured in New York time). This regression was run at
the one-minute frequency. Estimates of the coefficients![]() , along with 95 percent
confidence intervals, are shown for both currency pairs in Figure
5. Considerable variation within the day in the association between
order flow and exchange rate returns is evident. Figure 5 also
shows the average per-minute trading volume in each half-hour
window of the day.9 The
slope coefficient
, along with 95 percent
confidence intervals, are shown for both currency pairs in Figure
5. Considerable variation within the day in the association between
order flow and exchange rate returns is evident. Figure 5 also
shows the average per-minute trading volume in each half-hour
window of the day.9 The
slope coefficient![]() is lowest at times within the day when
trading is most active. For example, for the euro-dollar currency
pair, the slope coefficient is lowest between around 3am and 11am
New York time, the hours during which European and/or North
American markets are most active. This pattern of negative
correlation between trading volume and the price impact of trades
is consistent with interpreting estimates of the contemporaneous
association between high-frequency returns and high-frequency order
flow as a measure of liquidity.10
is lowest at times within the day when
trading is most active. For example, for the euro-dollar currency
pair, the slope coefficient is lowest between around 3am and 11am
New York time, the hours during which European and/or North
American markets are most active. This pattern of negative
correlation between trading volume and the price impact of trades
is consistent with interpreting estimates of the contemporaneous
association between high-frequency returns and high-frequency order
flow as a measure of liquidity.10
Figure 6 focuses on the lower-frequency variation over time of the return/order flow relationship. It shows rolling regression estimates for equation (1) with 30-day windows at the one-minute frequency and with 250-day windows (corresponding to about one calendar year of data) at the one-day frequency. The resulting slope coefficient estimates, along with 95 percent confidence intervals, are shown for both currency pairs. The one-minute estimates over a 30-day window show a large amount of variation over time, with the slope coefficients ranging from about 40 basis points per billion of order flow to about 80 basis points in euro-dollar and from 40 to more than 100 basis points in dollar-yen. This highlights the sensitivity of the estimates to the sample period, and it may explain some of the differences found in past work done on short samples from different time periods. The one-day estimates over a yearly window show, of course, less variation, but the same overall trends can be seen at both frequencies and for both currency pairs--the estimates of the slope coefficients rose in the early part of the sample, and peaked for windows ending in 2001, before trending downwards subsequently.11 If one interprets these slope coefficients as a measure of market liquidity, these results are consistent with the conclusion that foreign exchange market liquidity may have decreased during the last U.S. recession, but has improved overall since then.
5 Order Flow and Macroeconomic News Announcements
A scheduled data release is the canonical public news event and one might theorize that the role of asymmetric information would be minimal at these times and that rational agents would instantaneously impound the news in asset prices without requiring any trading activity. To be sure, the mapping from a multi-dimensional data release into future economic outcomes is complex, and working out the implications of a news release is something that could well be thought of as private information, as in the skilled information process models of Kim and Verrecchia (1994, 1997). However, in a rational expectations and efficient markets framework, there should be no systematic relationship between order flow and the headline surprise (the unexpected component of the headline news announcement). Nonetheless, some authors including Love and Payne (2004) and Evans and Lyons (2006) have shown that, in their data, macroeconomic news surprises are correlated with order flow, which, they have argued, could be evidence of a role for order flow in price discovery at these times. A quite mundane explanation for this correlation is, however, also possible. Leaving live quotes near the pre-announcement price in an anonymous limit order book at the moment of a news announcement is surely not a profit-maximizing strategy, as it amounts to taking a one-sided bet against oneself. Yet, Carlson and Lo (2004), studying in great detail the impact in the foreign exchange market of one news announcement, argue that some foreign exchange traders choose to do precisely this.12 If the price jumps following an announcement, any such quotes on one-side of the original price will be swept out. Under this scenario, the observed order flow will then be, at least in part, simply a byproduct of the price movement arising from the direct reaction of the exchange rate to the surprise component of the news announcement.
Using our long span of high-frequency data, we study the behavior of order flow at times of U.S. macroeconomic announcements that come out at 8:30am. We regress order flow from 8:30 to 8:31 and from 8:31 to 9:00 on the day of a news announcement on the surprise component of the data that were released at 8:30 that day. A separate regression is run for each type of data announcement. The releases that we consider are GDP (the quarterly advance release), and, all at monthly frequency, the employment report, CPI, housing starts, retail sales, PPI, durable goods sales, the trade balance and the unemployment rate. For each type of news release, the surprise component of that release, is measured as the difference between the actual released value and the ex-ante median expectation taken from the Money Market Services survey, scaled by its standard deviation. Love and Payne (2004) considered very similar regressions, but, because of the short span of their sample, they had to pool all the different announcement types. Our results are shown in Table 3. The sign of the unemployment rate has been flipped, so that, for each announcement type, a positive surprise means stronger-than-expected economic activity. In the 8:30 to 8:31 minute, all announcement surprises are estimated to have a negative effect on euro-dollar order flow and a positive effect on dollar-yen order flow, meaning news of stronger economic activity is associated with orders by market ``takers'' to buy dollars. The association is statistically significant at the 5 percent level in a majority of cases (one of the exceptions being the non-farm payrolls in euro-dollar). However, the headline data surprise only impacts order flow for a very short interval after each type of announcement. Most announcement surprises do not have a significant correlation with the order flow from 8:31 to 9:00, and the estimated signs of the effects are mixed.
Our results in the first minute are entirely consistent with the findings of Love and Payne (2004) and therefore highlight the same puzzle: in a rational expectations framework with efficient markets, the surprise component of these data releases, released simultaneously to all the trading public, should not be correlated with order flow. The fact that, for both currency pairs, every single type of macroeconomic announcement is accompanied by this pattern in order flow is consistent with the behavior highlighted by Carlson and Lo (2004) accounting for at least some of the order flow seen in the first minute. The fact that there is, in contrast, no consistent relationship in the next 29 minutes, may be further evidence to support that interpretation.
6 Conclusion
We have studied the relationship between exchange rates and order flow in an important new dataset from EBS which represents a majority of global interdealer foreign exchange trading in the top two currency pairs from 1999 to 2004. Using these data, we confirm the presence of a strong association between exchange rate returns and interdealer order flow at horizons of up to two weeks. The magnitude of this association is generally in line with several previous studies conducted on shorter spans of data. However, at horizons beyond two weeks, the strength of the association between exchange rate returns and order flow becomes substantially smaller than at shorter horizons. We document a clear intraday pattern to the sensitivity of exchange rates to order flow, with higher sensitivity associated with periods of lower trading volume, as well as some non-linearity in the high-frequency relationship, with large amounts of order flow associated with proportionally smaller exchange rate movements. Overall, our study offers more support for the ``weak flow-centric'' view of the role of order flow in exchange rate determination than for the ``strong flow-centric'' view: interdealer foreign exchange order flow has a strong impact on short- and medium-term exchange rate returns, but much less explanatory power for long-term exchange rate fluctuations.
References
Anderson, T.G., T. Bollerslev, F.X. Diebold and C. Vega (2003): Micro Effects of Macro Announcements: Real-Time Price Discovery in Foreign Exchange, American Economic Review, 93, pp.38-62.
Bacchetta, P., and E. Van Wincoop (2006): Can Information Heterogeneity Explain the Exchange Rate Determination Puzzle?, American Economic Review, 96, pp. 552-576.
Barberis, N. and A. Shleifer (2003): Style Investing, Journal of Financial Economics, 68, pp.161-199.
Brandt, Michael, and K. A. Kavajecz (2004): Price Discovery in the U.S. Treasury Market: The Impact of Orderflow and Liquidity on the Yield Curve, Journal of Finance, 59: pp.2623-2654.
Breedon, F. and P. Vitale (2004): An Empirical Study of Liquidity and Information Effects of Order flow on Exchange Rates, European Central Bank Working Paper, 424.
Carlson, J.A. and M. Lo (2004): One Minute in the Life of the DM/US$: Public News in an Electronic Market, forthcoming, Journal of International Money and Finance.
Chaboud, A.P., S.V. Chernenko, E. Howorka, R.S. Krishnasami Iyer, D. Liu and J.H. Wright (2004): The High-Frequency Effects of U.S. Macroeconomic Data Releases on Prices and Trading Activity in the Global Interdealer Foreign Exchange Market , International Finance Discussion Paper, 823.
Diether, K.D., K.H. Lee and I.M. Werner (2005): It's SHO Time! Short-Sale Price-Tests and Market Quality, working paper, Fisher College of Business, Ohio State University.
Dunne P., H. Hau and M. Moore (2004): Macroeconomic Order Flows: Explaining Equity and Exchange Rate Returns, unpublished manuscript.
Evans, M.D.D. (2002): FX Trading and Exchange Rate Dynamics, Journal of Finance, 57, pp.2405-2447.
Evans, M.D.D. and R.K. Lyons (2002): Order Flow and Exchange Rate Dynamics, Journal of Political Economy, 110, pp.170-180.
Evans, M.D.D. and R.K. Lyons (2005): Exchange Rate Fundamentals and Order Flow unpublished manuscript.
Evans, M.D.D. and R.K. Lyons (2006): How is Macro News Transmitted to Exchange Rates? unpublished manuscript.
Froot, K.A. and T. Ramadorai (2005): Currency Returns, Intrinsic Value and Institutional-Investor Flow, Journal of Finance, 60, pp.1535-1566.
Giradin, E. and R.K. Lyons (2006): Does Intervention Alter Private Behavior?, unpublished manuscript.
Hau, H., W. Killeen and M. Moore (2002): How Has the Euro Changed the Foreign Exchange Market?, Economic Policy, 0, pp.149-177.
Jones, C.M., G. Kaul and M.L. Lipson (1994): Transactions, Volume and Volatility, Review of Financial Studies, 7, pp.631-651.
Killeen, W., R. Lyons and M. Moore (2001): Fixed versus Flexible: Lessons from EMS Order Flow, NBER Working Paper 8491.
Kim, O. and R. Verrecchia (1994): Market Liquidity and Volume Around Earnings Announcements, Journal of Accounting and Economics, 17, pp.41-67.
Kim, O. and R. Verrecchia (1994): Pre-announcement and Event-period Information, Journal of Accounting and Economics, 24, pp.395-419.
Love, R. and R. Payne (2004): Macroeconomic News, Order Flow and Exchange Rates, LSE Financial Markets Group Discussion Paper 475.
Marsh, I.W. and C. O'Rourke (2005): Customer Order Flow and Exchange Rate Movements: Is There Really Information Content?, unpublished manuscript.
Payne, R.K. (2003): Informed Trade in Spot Foreign Exchange Markets: An Empirical Investigation, Journal of International Economics, 61, pp.307-329.
Table 1: Order Flow Summary Statistics
| Horizon, h | Euro | Yen |
|---|---|---|
| 1 minute (n = 2,152,800): Mean | 0.4471 | 0.4491 |
| 1 minute (n = 2,152,800): Standard Deviation | 19.63 | 13.71 |
| 1 minute (n = 2,152,800): Min | -457 | -639 |
| 1 minute (n = 2,152,800): Max | 615 | 667 |
| 1 minute (n = 2,152,800): Proportion Positive | 0.52 | 0.53 |
| 5 minute (n = 430,560): Mean | 2.235 | 2.245 |
| 5 minute (n = 430,560): Standard Deviation | 52.86 | 38.62 |
| 5 minute (n = 430,560): Min | -1049 | -1423 |
| 5 minute (n = 430,560): Max | 1158 | 1120 |
| 5 minute (n = 430,560): Proportion Positive | 0.53 | 0.53 |
| 1 hour (n = 35880): Mean | 26.82 | 26.95 |
| 1 hour (n = 35880): Standard Deviation | 205.1 | 177.4 |
| 1 hour (n = 35880): Min | -1795 | -3319 |
| 1 hour (n = 35880): Max | 2150 | 3324 |
| 1 hour (n = 35880): Proportion Positive | 0.56 | 0.57 |
| 1 day (n = 1495): Mean | 643.8 | 646.7 |
| 1 day (n = 1495): Standard Deviation | 1177 | 1252 |
| 1 day (n = 1495): Min | -3407 | -3984 |
| 1 day (n = 1495): Max | 4755 | 7750 |
| 1 day (n = 1495): Proportion Positive | 0.72 | 0.70 |
| 1 week (n = 299): Mean | 3219 | 3234 |
| 1 week (n = 299): Standard Deviation | 2897 | 3474 |
| 1 week (n = 299): Min | -6494 | -10109 |
| 1 week (n = 299): Mix | 13644 | 18596 |
| 1 week (n = 299): Proportion Positive | 0.87 | 0.82 |
| 1 month (n = 72): Mean | 13367 | 13428 |
| 1 month (n = 72): Standard Deviation | 6807 | 8207 |
| 1 month (n = 72): Min | -2639 | -1079 |
| 1 month (n = 72): Max | 31375 | 33010 |
| 1 month (n = 72): Proportion Positive | 0.99 | 0.96 |
This table reports some summary statistics for order flow (in millions of base currency) at the one-minute frequency, and aggregated to five-minute, hourly, daily, weekly and monthly frequencies. Proportion positive means the number of observations at that frequency for which the measured order flow is positive, divided by the total number of observations for which it is nonzero.
Table 2: Order Flow Autocorrelation Coefficients
| Horizon, h: Lead | Euro | Yen |
|---|---|---|
| 1 minute: 1 | 0.1956* | 0.2253* |
| 1 minute: 2 | 0.0779* | 0.1137* |
| 1 minute: 3 | 0.0376* | 0.0775* |
| 1 minute:10 | 0.0047* | -0.0012 |
| 1 minute: 30 | -0.0039* | -0.0009 |
| 5 minute: 1 | 0.0873* | 0.1839* |
| 5 minute: 2 | 0.0125* | 0.0742* |
| 5 minute: 3 | 0.0064* | 0.0550* |
| 5 minute: 10 | 0.0047* | 0.0244* |
| 5 minute: 30 | -0.0011 | 0.0093* |
| 1 hour: 1 | 0.0096 | 0.1720* |
| 1 hour: 2 | -0.0025 | 0.0756* |
| 1 hour: 3 | -0.0058 | 0.0507* |
| 1 hour: 10 | 0.0032 | 0.0235* |
| 1 hour: 30 | -0.0081 | 0.0118* |
| 1 day: 1 | 0.1067* | 0.1902* |
| 1 day: 2 | 0.0245 | 0.1143* |
| 1 day: 3 | 0.0295 | 0.0329 |
| 1 day: 10 | 0.0265 | 0.0280 |
| 1 day: 30 | 0.0300 | -0.0223 |
| 1 week: 1 | 0.1358* | 0.1861* |
| 1 week: 2 | 0.0803 | 0.0829 |
| 1 week: 3 | 0.0245 | 0.0189 |
| 1 week: 10 | -0.0400 | 0.1029 |
| 1 week: 30 | 0.0805 | -0.0673 |
| 1 month: 1 | 0.2365* | 0.0089 |
| 1 month: 2 | 0.0803 | 0.0891 |
| 1 month: 3 | -0.1474 | 0.2431* |
This table reports autocorrelation coefficients for order flow at one-minute, five-minute, hourly, daily, weekly and monthly frequencies. We report results for leads of 1, 2, 3, 10, and 30 intervals. * indicates statistical significance of an individual coefficient at the 5% level.
Table 3: Slope Coefficient Estimates in Regression of Order Flow on Standardized Announcement Surprises
| Currency Pair: Surprise | 8:30-8:31 | 8:31-9:00 |
|---|---|---|
| Euro-Dollar: Nonfarm Payrolls | -27.16 | -9.53 |
| Euro-Dollar: CPI | -2.68 | 11.06 |
| Euro-Dollar: GDP | -61.05 *** | 2.58 |
| Euro-Dollar: Housing Starts | -21.58 *** | -52.25 ** |
| Euro-Dollar: PPI | -4.41 | 62.07 *** |
| Euro-Dollar: Retail Sales | -35.33 ** | -30.91 |
| Euro-Dollar: Trade Balance | -46.12 *** | -35.85 |
| Euro-Dollar: Unemployment |
-41.06 *** | 0.14 |
| Dollar-Yen: Nonfarm Payrolls | 58.93 *** | 96.67* |
| Dollar-Yen: CPI | 0.72 | -15.35 |
| Dollar-Yen: GDP | 43.81 *** | 67.04 |
| Dollar-Yen: Housing Starts | 6.23 ** | 23.69 |
| Dollar-Yen: PPI | 5.55 ** | -0.73 |
| Dollar-Yen: Retail Sales | 19.70 *** | 17.86 |
| Dollar-Yen: Trade Balance | 24.91 *** | 34.21* |
| Dollar-Yen: Unemployment |
8.14 | 16.71 |
![]() The sign of this countercylical indicator
has been flipped. * denotes statistical significance at the 10% level, ** denotes statistical significance at the 5% level, and *** denotes statistical significance at the 1% level.
The sign of this countercylical indicator
has been flipped. * denotes statistical significance at the 10% level, ** denotes statistical significance at the 5% level, and *** denotes statistical significance at the 1% level.
Figure 1: Estimates of Excess Returns Regressed on Order Flow at Different Horizons
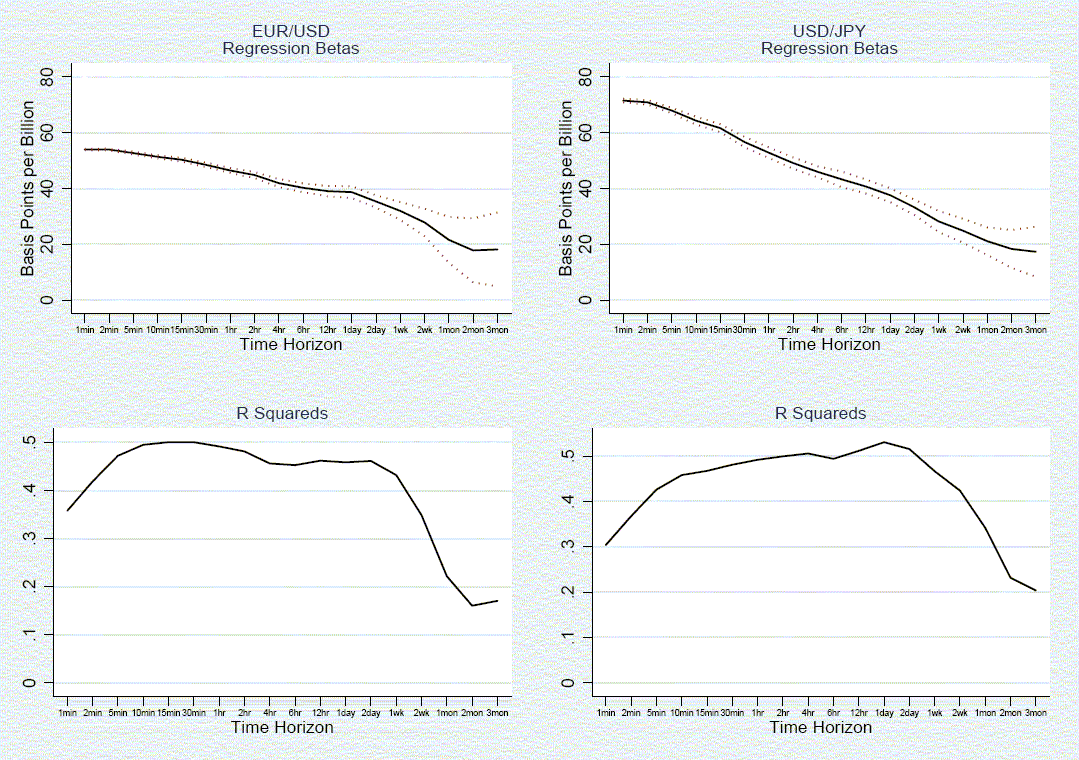
Figure 2: Exchange Rate Level and Cumulative Order Flow (Daily: 1999-2004)
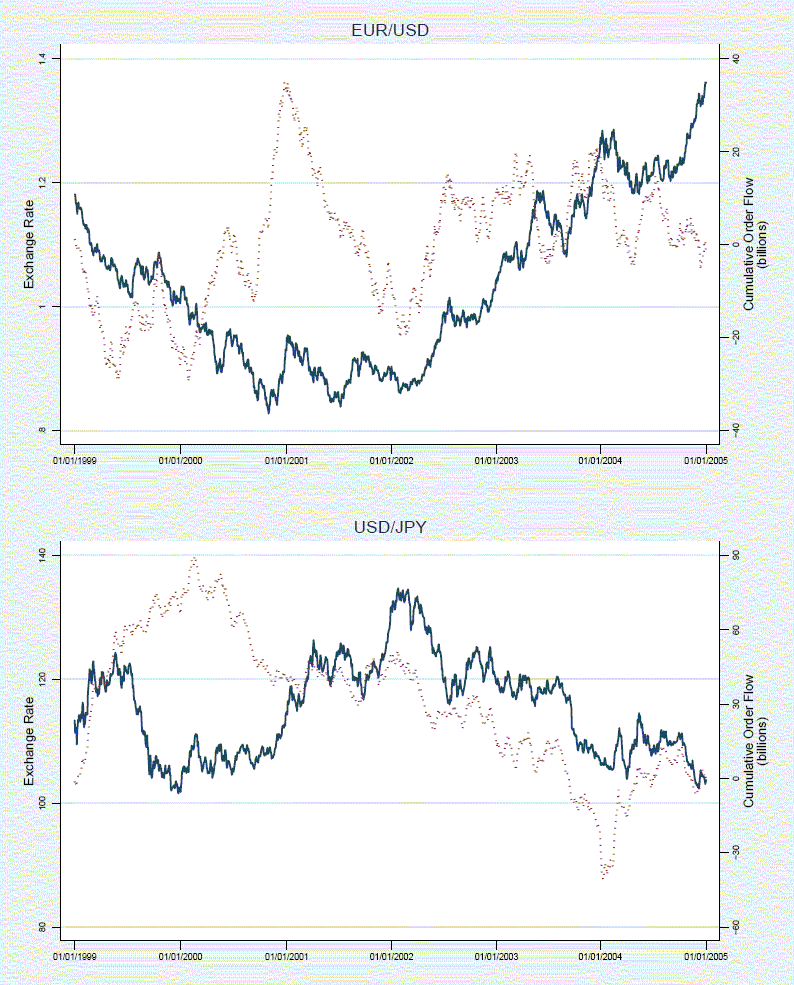
The dotted line is the order flow series; the solid line is the exchange rate level
Figure 3: Cross-Correlograms of Returns and Order Flow
In each panel, the correlation at lag zero denotes the contemporaneous correlation between returns and order flow. Positive lags denote correlations between order flow and future returns. Negative lags denote correlations between order flow and past returns
Dashed lines show 5% critical values for null of zero.
Figure 4: Scatter Plot of Exchange Rate Returns and Order Flow
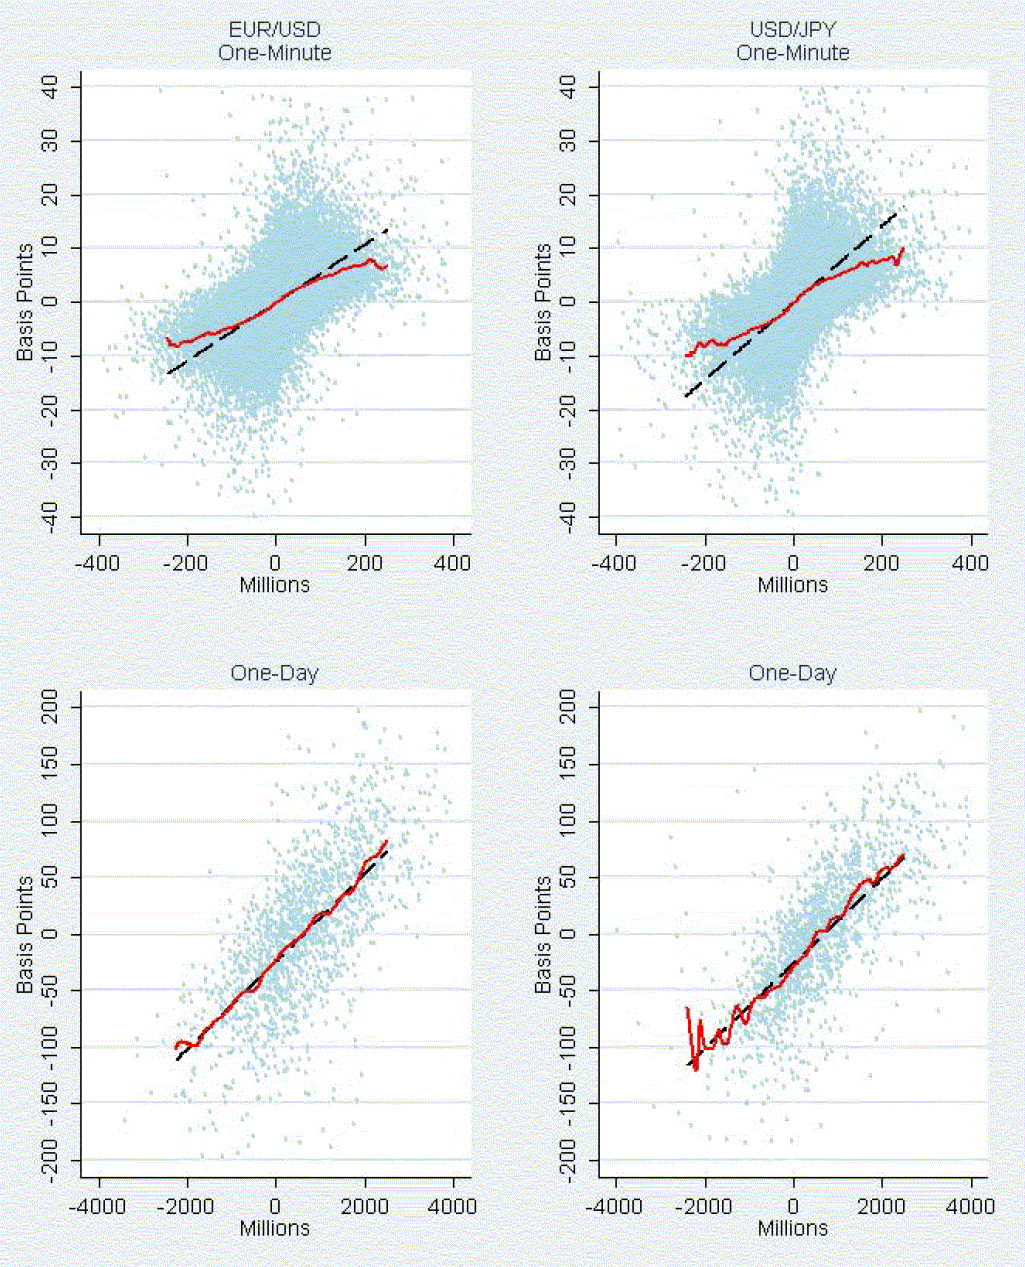
Dashed line is the OLS estimate; solid line is the Nadaraya-Watson nonparametric estimate
Figure 5: Intraday Regression Betas and Average Trading Volume
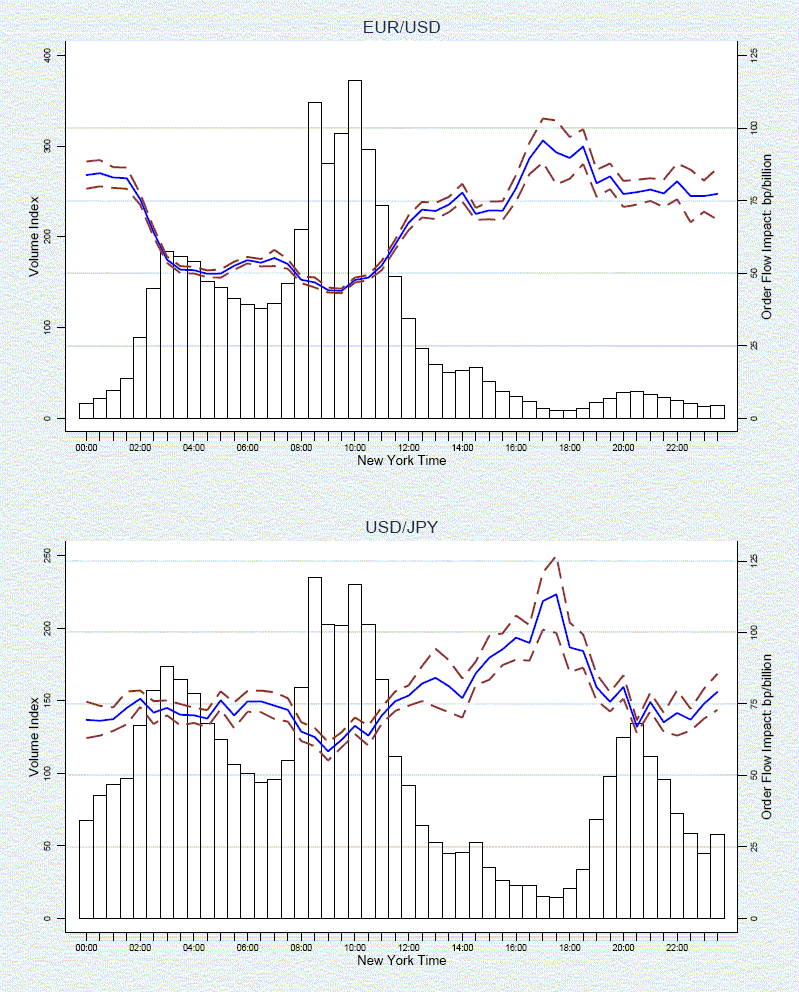
95 percent confidence intervals constructed using heteroscedasticity robust standard errors are also shown
Index 100: Average Volume per one-minute period over the whole sample period (seperate index for each currency pair)
Figure 6: Rolling Regressions of Return Regressed on Order Flow (1999-2004)
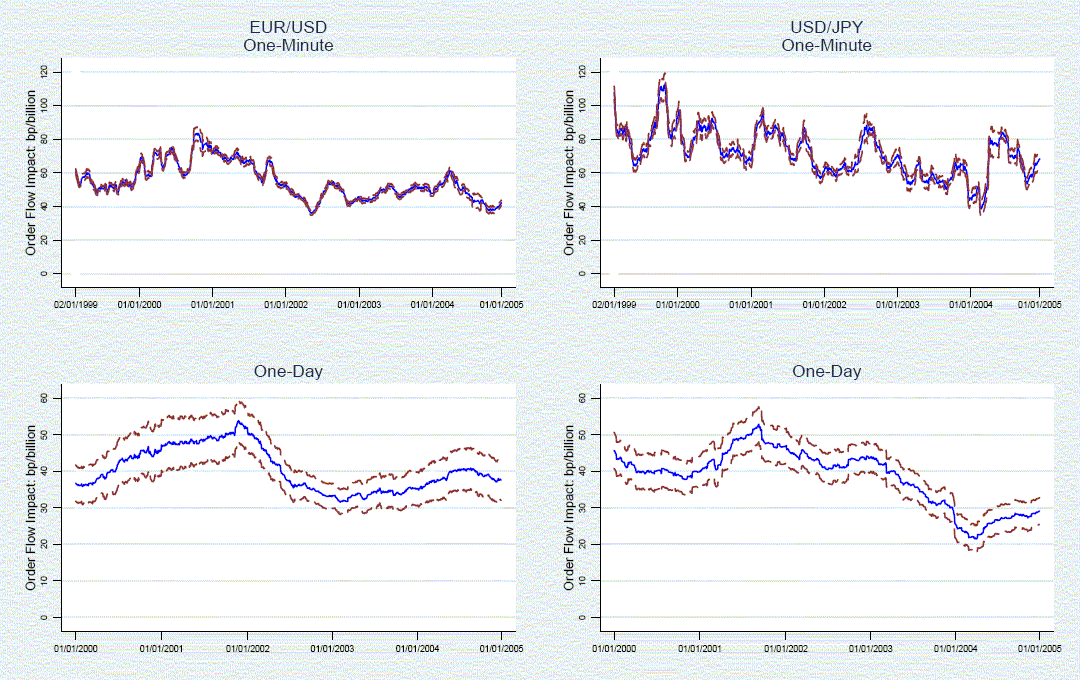
95 percent confidence intervals constructed using heteroscedasticity robust standard errors are also shown
One-minute rolling regressions constructed using a 30 day moving window; Daily rolling regressions used a 252 day moving window
Footnotes
* International Finance Division (Berger, Chaboud) and Division of Monetary Affairs (Wright), Board of Governors of the Federal Reserve System, Washington DC 20551, Harvard Business School, Boston, MA, 02163 (Chernenko), and EBS, 535 Madison Avenue, New York, NY 10022 (Howorka). Contact: [email protected]. We are grateful to Jon Faust, Mico Loretan, Richard Lyons, Dagfinn Rime, Krista Schwarz and Eric van Wincoop for helpful discussions. The views in this paper are solely the responsibility of the authors and should not be interpreted as reflecting the views of the Board of Governors of the Federal Reserve System or of any person associated with the Federal Reserve System. Return to text
1. Killeen, Lyons, and Moore (2001) and Hau, Killeen, and Moore (2002) have studied EBS order flow data at daily frequency from 1998 and 1999. Breedon and Vitale (2004) collected and studied six months of partial EBS order flow data from 2000 and 2001. Return to text
2. We refer the reader to Chaboud et al. (2004) for details of the EBS trading system. Return to text
3. In the study of equity markets, much of the microstructure literature has focused on the signed-order count measure. We also analyzed EBS order flow data based on counts of trades per minute, and the results, which are very similar, are available from the authors. In practice, as the size of most individual trades on EBS are within a small range (almost always below $10 million), and the average trade size varies little over time, it is not surprising that the two order flow measures give us very similar results. Return to text
4. The phenomenon has also been noted in equity trading platforms, where it is less surprising, as investors naturally tend to build long equity positions. Constraints on short sales may also contribute to the recorded imbalance in equity markets (Diether, Lee and Werner, 2005). Return to text
5. At frequencies lower than one day, we use overlapping observations, and control for the resulting serial correlation in the errors by using Newey-West standard errors. Return to text
6. We also ran regression (1) at the same horizons using excess returns instead of simple returns as a dependent variable, that is accounting for interest rate differentials over horizons of one day or more. LIBOR rates in dollar, euro, and yen were used to calculate excess returns. The results at all horizons, available from then authors on request, were almost identical to the estimates obtained with simple returns. This is not surprising given the typical relative magnitudes of interest differentials (small) and exchange rate movements (large) over these horizons in these currency pairs, in addition to the well-known failure of uncovered interest parity. Return to text
7. We note that the data used in this study and those used in Froot and Ramadorai (2005) come from very different sectors of the foreign exchange market and overlap in time for only about 2 years. Return to text
8. See footnote 39, page 567 in Bacchetta and van Wincoop (2006). Return to text
9. Volume refers to the total value in base currency of all trades conducted regardless of whether they are buyer-initiated or seller-initiated. To preserve data confidentiality, volume is expressed in index form. EBS does not publicly release trading volume data for individual currency pairs. Return to text
10. Given this intradaily pattern, one may suspect that the non-linearity observed in the one-minute return/order flow relationship (Figure 5) could simply result from the aggregation of observations obtained at different times of the trading day. We find that this is not the case, however, as the non-linearity is still evident when using only observations obtained between 3 am and 11 am, the busiest time of the trading day. Return to text
11. We note that, at a daily frequency, the lowest coefficient estimate in dollar-yen is for a one-year window ending in March 2004, precisely at the end of the 14-month-long episode of massive foreign exchange intervention by Japan's Ministry of Finance. In contrast, Girardin and Lyons (2006), using daily customer order flow data from Citibank, do not detect a significant change in the return/order flow slope coefficients during Japanese intervention. Return to text
12. Carlson and Lo (2004) argue that these traders follow at all times a rigid strategy of attempting to cover in the interdealer market, with only a small fixed profit margin, positions open while trading with their customers. Return to text
This version is optimized for use by screen readers. Descriptions for all mathematical expressions are provided in LaTex format. A printable pdf version is available. Return to text