
Board of Governors of the Federal Reserve System
International Finance Discussion Papers
Number 868, September 2006 --- Screen Reader Version*
How Do FOMC Actions and U.S. Macroeconomic Data Announcements Move Brazilian Sovereign Yield Spreads and Stock Prices?
NOTE: International Finance Discussion Papers are preliminary materials circulated to stimulate discussion and critical comment. References in publications to International Finance Discussion Papers (other than an acknowledgment that the writer has had access to unpublished material) should be cleared with the author or authors. Recent IFDPs are available on the Web at http://www.federalreserve.gov/pubs/ifdp/. This paper can be downloaded without charge from the Social Science Research Network electronic library at http://www.ssrn.com/.
Abstract:
This paper provides a robust structural identification of the effects of U.S. interest rates on an emerging economy�s asset values. Using newly available intraday data, we investigate how surprises associated with U.S. macro data and FOMC announcements move the yield spread on a benchmark Brazilian government dollar-denominated bond and the Brazilian broad stock price index. Our study covers the period February 1999 to April 2005. We find that FOMC announcements that lead to an increase in U.S. interest rates are associated with a systematic increase in Brazil�s bond spread and a systematic decline in the stock price index. Several U.S. macro data surprises, including for nonfarm payrolls and the CPI, prompt an increase in the Brazilian bond yield spread and a fall in Brazilian share prices. These combined findings suggest that, for Brazil during this period, the financial risks of higher U.S. interest rates in response to positive news about the U.S. economy dominated any benefits through trade or other channels in the determination of Brazilian asset valuations.
Keywords: data releases, monetary policy, emerging markets, spreads, stock prices, Brazil
JEL classification: F360, F390, F420
The authors would like to thank John Ammer, David Bowman, Jon Faust, Jane Haltmaier, Dale Henderson, Steve Kamin, Jonathan Wright, Carlos Zarazaga, and especially Jon Wongswan and participants at the Division of International Finance�s Tuesday Group meeting, the Fall 2004 Federal Reserve System Committee Meeting on International Economic Analysis, and 2005 LACEA conference for helpful discussions and suggestions. Many thanks also to Refet G�rkaynak, Jon Faust, and J.P. Morgan for providing us with data used in this paper. Joshua Mazen, Matthew Nespoli, and Sarita Subramanian provided excellent research assistance. The original version of this paper was titled �Responses of Emerging Market Economy Asset Prices to U.S. and Domestic Events: the Case of Brazil.� All errors are our own. The views expressed in this paper are solely the responsibility of the authors and should not be interpreted as reflecting views of the Board of Governors of the Federal Reserve System or of any other person associated with the Federal Reserve System. The e-mail addresses of the authors are [email protected], [email protected]
I. Introduction
Many observers believe that U.S. monetary policy tightenings helped trigger the LDC debt crisis of the 1980s, the Mexican 1994 crisis, and possibly other episodes of macroeconomic instability in emerging market economies (Frankel and Roubini 2001).1 Motivated in part by these experiences, several authors have studied how movements in U.S. interest rates affect Emerging Market Economy (EME) bond yields, producing, at best, conflicting results.
This lack of consensus likely owes to the fact that most of the existing studies do not identify the causes of movements in U.S. interest rates, as they focus on the relationship between realized changes in U.S. interest rates and emerging market yields alone [Ammer (2000), Frankel and Roubini (2001), Kamin and von Kleist (1999), Kaminsky and Schmukler (2003); see also Reinhart and Reinhart (2001)]. For example, it is potentially important to consider separately how increases in U.S. interest rates that are driven by contractionary monetary policy shocks affect the cost of EME dollar borrowing as opposed to, say, increases in U.S. rates following positive news about the U.S. economy. While higher borrowing costs can increase the probability of default, a stronger-than-expected U.S. growth outlook would have positive spillover to an EME with trade ties to the United States, raising income levels and the affordability of debt, all else equal.
Two recent papers have attempted to address these identification problems by developing a structural VAR model that is used to assess the effects of U.S. monetary policy on emerging market economy asset prices. One drawback to this approach is that it requires a large number of identifying assumptions, some of which are inevitably ad hoc. Using quarterly data on a panel that covers seven emerging market economies (including Brazil) over 1994-2001, Uribe and Yue (2003) estimate a structural VAR to study the effects of U.S. monetary policy shocks on emerging bond yield spreads. However, their specification of the monetary policy rule is unappealing, as the fed funds target is assumed to depend only on its past levels and not on any information about the U.S. economy. As a result, their measure of unexpected changes in monetary policy likely provides a poor approximation of the actual information driving forward-looking behavior in emerging financial markets. A more realistic assumption is that policy decisions that occur in response to publicly available information about the U.S. economy are likely to be anticipated to some degree by financial markets and thus incorporated into asset prices well ahead of the actual decisions.
Miniane and Rogers (2005) apply a structural VAR framework to monthly data over the 1975-1998 period to look at the effect of U.S. monetary policy shocks on short-term interest rates on local currency-denominated instruments.2 They examine the robustness of their estimates over 200 sets of identifying assumptions. Until recently, such robustness checks were about the only form of insurance against mis-specification bias in structural analyses. Using newly available high frequency data provides an attractive alternative.
In this paper, we use intra-daily financial data in an event study approach that is ideally suited to address these identification problems. Specifically, we examine movements in the primary Brazilian equity index, the IBOVESPA, as well as a benchmark dollar-denominated Brazilian government bond yield spread over a comparable U.S. Treasury yield in narrow windows surrounding FOMC and U.S. macro announcements. The benchmark bond is popularly known as the C-bond, and over most of the sample period, it was the most heavily traded emerging market sovereign bond. We investigate responses to ten major U.S. macro announcements, eight of them concerning real activity (GDP, nonfarm payrolls, industrial production, trade balance, unemployment, jobless claims, housing starts, retail sales), as well as the CPI and PPI. Importantly, we extract the unanticipated component of the announcements using survey-based and market-based measures of expectations before tracing out their effects on Brazilian asset values.
The availability of timely measures of expectations on U.S. economic data releases and FOMC decisions is a key factor in our event study approach. It allows us to identify the source of observed movements in U.S. interest rates without having to rely on the sort of tenuous and sometimes controversial identifying assumptions found in structural VAR models. Moreover, unlike the structural VAR approach, we do not require that the unexpected component of monetary policy decisions be uninformative about the state of the economy. In other words, we allow for the possibility that investors perceive FOMC decisions as revealing private information about the state of the economy (see Faust, Swanson, and Wright 2004).
Our work represents an extension of the rapidly growing literature that uses intra-daily data to study the effects of U.S. monetary policy actions and macroeconomic announcements on bond yields and stock prices, nearly all of which thus far has focused on the United States and other industrial countries. Kuttner (2001) studies the effects of U.S. monetary policy actions on U.S. bond yields and Bernanke and Kuttner (2004) examine the effects of policy actions on U.S. stock prices. Balduzzi, Elton, and Green (BEG 2001) study the effects of U.S. macro announcements on U.S. bond yields. Faust, Rogers, Wang, and Wright (FRWW 2003) investigate the joint responses of bond yields and exchange rates in several industrial countries to U.S. macroeconomic news.3 Our study is the first, to our knowledge, to use intra-daily data to analyze emerging market bond yields. Wongswan (2003, 2005) is the only other author (that we are aware of) to study the effects of U.S. announcements on EME equity prices using intra-daily data.
Focusing first on the role of U.S. monetary policy, we measure surprise changes in U.S. policy by looking at movements in U.S. interest rates of several maturities around the time of FOMC meetings. Across maturities and securities, we find that increases in U.S. rates following FOMC announcements prompt statistically significant increases in the Brazilian C-bond spread that are in many cases as big as the increases in U.S. rates themselves. Moreover, we find that the effect of the FOMC decisions on volatility of the C-bond spread is notably persistent, lasting for hours following the announcement.
Our results on the effects of FOMC announcements on Brazilian stock prices are a bit more mixed. FOMC announcements that precipitate increases in U.S. rates are associated with declines in Brazilian stock prices. However, while movements in short-term U.S. rates often do not have statistically significant effects, movements in long-term U.S. Treasury bond yields do. These results contrast with those of Wongswan (2005), who finds that a number of EME equity indexes, including Brazil's, respond more to the surprise component of current monetary policy decisions and less to movements in longer-term interest rates. (We give possible explanations for this difference below.)
Turning to the effects of U.S. macro data announcements, we find that several U.S. macro announcements have significant effects on Brazilian spreads and stock prices and that volatility in these markets is elevated following several announcements compared with non-announcement days. Paralleling results found in many event studies on industrial economy announcement effects, the nonfarm payroll data invariably matters for Brazilian assets and has the greatest explanatory power of the news events we consider, including FOMC decisions. More generally, we find that better-than-expected news about the real U.S. economy, if it has a significant effect on Brazilian asset values, prompts an increase in the C-bond spread and a decline in Brazilian share prices. U.S. interest rates have been found by FRWW and by others to rise in response to unexpectedly strong news about U.S. real activity (GDP, nonfarm payrolls, and retail sales). Putting our results together with those of FRWW suggests that higher expected U.S. interest rates in response to an unexpected improvement in U.S. economy imposes greater financial risks to Brazil from higher borrowing costs than it implies economic benefits through trade channels. Also interestingly, we find that the effects of the U.S. announcements on Brazilian bond spreads, when statistically significant, are more prolonged than has been found for U.S. Treasury yields.4 Similar to what others have found for other asset classes, U.S. announcements explain only a small portion of the variation of Brazilian asset prices in the event windows.
Before proceeding to our event study, we informally review some of the relationships underlying the data and provide a bit more detail on some of the conflicting recent empirical work. We then discuss data issues and introduce our methodology in Section III and summarize our results in Section IV. Section V concludes.
II. Background and Motivation
As is emphasized by Uribe and Yue, one strand of research has
focused on the role of domestic factors in the determination of EME
risk spreads, while another has focused on the role of external
influences, particularly U.S. interest rates. Increases in U.S.
interest rates are thought by many to induce larger changes in EME
dollar-denominated bond yields in the same direction, resulting in
a widening in EME bond yield spreads over U.S. Treasuries for two
possible reasons. First, an increase in U.S. rates raises the cost
of new dollar borrowing for emerging market economies and could
reduce their ability to service their debt; both effects make
default more likely, leading to higher risk premiums. Second, some
contend that periods of low and stable U.S. interest rates may be
associated with investor ``reach for yield,'' when investors take
longer positions in emerging market and other risky debt than they
otherwise would.5 This
concern was voiced frequently during the most recent U.S. monetary
policy tightening cycle. Working in the other direction, higher
U.S. interest rates that result from an improved economic outlook
in the United States could boost prospects abroad, alleviating
concerns about debt servicing problems and leading to a decline in
EME spreads. At times in recent years, many observers have asserted
that a rise in U.S. rates would likely to lead to a widening in EME
credit risk spreads;![]() 6 countries
such as Brazil that have a history of external debt servicing and a
relatively small external sector were expected to be especially
hard hit. Ultimately, however, what factors dominate the
determination of EME spreads is an empirical question.
6 countries
such as Brazil that have a history of external debt servicing and a
relatively small external sector were expected to be especially
hard hit. Ultimately, however, what factors dominate the
determination of EME spreads is an empirical question.
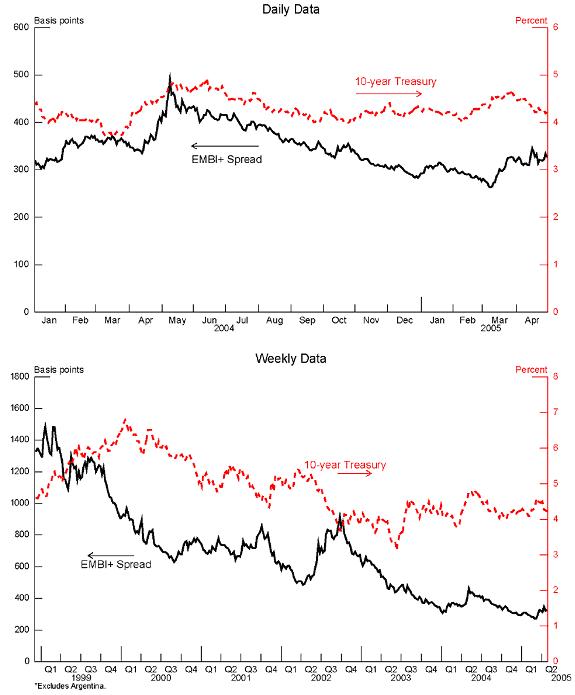
Sorting out the potentially competing influences on the
relationship between U.S. rates and EME risk spreads can be a
tricky undertaking, as is highlighted by the top panel of Figure 1,
which plots since the beginning of 2004 a long-term U.S. Treasury
bond yield--the ten-year yield--against a broad measure of the EME
credit risk spread, J.P. Morgan's EMBI+ spread over U.S.
Treasuries.![]() 7 (Note the different scales.) Casual
observation indicates that the correlation between these series can
vary considerably. The ten-year Treasury yield and the EMBI+ moved
in the same direction over much of 2004, but at other times, they
moved in opposite directions, likely reflecting a change in the
factors underlying their co-movement. The bottom panel of Figure 1,
which extends the time axis back to 1998, shows that the
association between U.S. rates and the EMBI+ yield spread has also
been weak over other periods. In 1999 and again in 2001, EME yield
spreads and U.S. ten-year Treasury yields moved in opposite
directions. A popular explanation for the negative association
between the long-term U.S. rates and EME risk spreads in the late
1990s is that a flight to quality in the wake of financial crises
in Asia temporarily depressed long-term U.S. interest rates; an
unwinding of these flows was thought to have been the cause of the
subsequent increase in U.S. yields and decline in EME spreads.
7 (Note the different scales.) Casual
observation indicates that the correlation between these series can
vary considerably. The ten-year Treasury yield and the EMBI+ moved
in the same direction over much of 2004, but at other times, they
moved in opposite directions, likely reflecting a change in the
factors underlying their co-movement. The bottom panel of Figure 1,
which extends the time axis back to 1998, shows that the
association between U.S. rates and the EMBI+ yield spread has also
been weak over other periods. In 1999 and again in 2001, EME yield
spreads and U.S. ten-year Treasury yields moved in opposite
directions. A popular explanation for the negative association
between the long-term U.S. rates and EME risk spreads in the late
1990s is that a flight to quality in the wake of financial crises
in Asia temporarily depressed long-term U.S. interest rates; an
unwinding of these flows was thought to have been the cause of the
subsequent increase in U.S. yields and decline in EME spreads.
A number of previous studies (mentioned in the introduction) take a first step in disentangling the confluence of factors effecting the relationship between EME asset values and U.S. rates by controlling for domestic economic and political conditions and by accounting for periods of internal and external financial crises. As a group, however, they do not achieve consensus on the role of U.S. interest rates in determining EME asset values. Working with data on both new EME bond issues and with monthly data on secondary market yields over the 1991-1997 period, Kamin and Von Kleist (1999) find no statistically significant relationship between log changes in nominal U.S. interest rates (both short-term and long-term) and the log change in the EME yield spreads. Kaminsky and Schmukler (2002) pool daily data on EMBI and EMBI+ spreads for 16 emerging market economies covering the mid- to late 1990s. They find a statistically significant relationship between log changes in short-term U.S. interest rates and log changes in EME risk spreads (see also Reinhart and Reinhart 2001, Ferrucci 2003). However, Ammer (2000) finds no statistically significant relationship between weekly changes in the fed funds target and changes in the aggregate EMBI spread over 1991-2000.
How U.S. monetary policy affects EME stock prices has been far
less well explored.![]() 8 Very
little of this work distinguishes among various sources of
movements in U.S. interest rates. An exception is Wongswan (2003),
who finds little effect of U.S. (and Japanese) announcements on the
level of emerging Asian stock market prices, and Wongswan (2005),
who studies the effects of U.S. monetary policy on stock indexes of
a variety of emerging market economies.
8 Very
little of this work distinguishes among various sources of
movements in U.S. interest rates. An exception is Wongswan (2003),
who finds little effect of U.S. (and Japanese) announcements on the
level of emerging Asian stock market prices, and Wongswan (2005),
who studies the effects of U.S. monetary policy on stock indexes of
a variety of emerging market economies.
As we have discussed at the beginning of this section, different factors can have different implications for EME asset values. What is needed, in our view, is a structural interpretation of the movements in U.S. interest rates. Moreover, we would like to be able to interpret the response in Brazilian assets to these structural factors in a manner that is not dependent on ad hoc identifying assumptions about monetary policy and other economic behavior.
III. Methodology and Data
For the event study approach that we take in this paper, we
estimate equations with the following form
where
Measuring news about the state of the U.S. economy is straightforward. We isolate the news component of data releases by comparing outcomes to survey-based expectations. The unexpected component of U.S. monetary policy is measured as the responses of various U.S. short-term and the long-term interest rate in a window surrounding FOMC decisions. As opposed to the often controversial behavioral assumptions in the structural VAR literature, the primary identifying assumption required by such market-based measures of monetary policy shocks is that the change in futures prices following a policy announcement are primarily reflective of investor expectation errors and not risk premium movements (see Piazessi and Swanson 2004 for evidence supporting this assumption). Supplied with the surprise measures, we are able to identify the source of information driving asset prices, while also minimizing the influence of unrelated factors from home or abroad.
The advantage to using intra-daily data over daily data is that the narrower event window better isolates the effects of the announcement on the asset price. Gürkaynak, Sack, and Swanson (GSS 2004) have shown that monetary policy surprises are more cleanly measured within an intra-daily window, as asset price movements even within a day have at times reflected investors' reactions to macro data released in the hours leading up to the FOMC announcement (see also Bernanke and Kuttner). We believe that an intra-daily approach is particularly appealing in this paper because our sample covers several episodes of financial turbulence in Latin America, particularly the Brazilian financial crises of 1999 and 2002 and financial turmoil in Argentina. By focusing on price movements in narrow windows around U.S. news, we can better control for these local events, which would undoubtedly be present in asset price movements at a daily or lower frequency.
Basic features of our high frequency data on Brazil are summarized in Table 1. We collected intra-daily data on indicative prices for the Brazilian C-bond and on the broad stock price index, the IBOVESPA, over the period February 1999 to April 2005. Observations on the C-bond are hourly, on the hour, and are from Reuters Select Feed (RSF), which is described further below. For the C-bond, one month's worth of data, from September 13, 2001 to October 8, 2001, is missing from the dataset. Data on the stock price index were collected from Bloomberg at five-minute intervals. In this study, all data are in Eastern Time.
The C-bond was a $7.4 billion issue under the 1994 Brady Plan sovereign debt restructuring agreement, and had a sinking fund provision and a call option. The principal began to mature in April 2004. Over most of the period we analyze, the C-bond was the benchmark dollar-denominated Brazilian government bond and was the most actively traded bond of an emerging market economy. Although the Cbond came to be eclipsed by the Brazil 2040 bond in terms of trading volume by the fourth quarter of 2004, trading volume was still quite high at $28 billion, according to the EMTA's Debt Trading Volume Survey (down from $60 billion in the third quarter of that year). On July 22, 2005, $4.4 billion of the $5.3 billion in outstanding debt was retired in a debt exchange. The remaining principal was retired on October 15, 2005.9
C-bond price quotes posted by traders and dealers on Reuters screens are filtered for data entry errors, averaged, and transmitted to Reuters Select Feed (RSF). Our raw data consist of these averaged quotes.10 We are interested in investigating the reaction to the Brazilian yield or yield spreads to U.S. news. Hence, bid and ask prices were averaged and the mid-price was converted into a bond yield spread over the comparable U.S. Treasury security using a first-order approximation based on modified spread duration (Campbell, Lo, and Shiller 1997). Interested readers can refer to Appendix 1, where we explain the approximation and show that it is reasonable at a daily frequency. As in many other event studies, we assume that indicative quotes are good proxies for binding quotes or transactions prices, a necessity here due to the unavailability of the latter.
The Brazilian sovereign dollar-denominated bond market trading occurs primarily during London, New York, and Sao Paulo trading hours, meaning that the market is always generally active at the time of U.S. policy and macro announcements. The most active trading period typically extends from 3 am Eastern Time, corresponding to when trading begins in London, to about 5 pm Eastern Time. (London time is five hours ahead of Eastern Time. Sao Paulo time is one to three hours ahead of Eastern Time.) Figure 2 depicts the Bovespa's trading hours over the sample period, which varied. The Bovespa is open only three and a half to five months of the year at 8:30 am Eastern Time, when most U.S. macro data is released.11 Below, we refer to the sub-sample in which the Brazilian stock market is open when U.S. announcements are made as our ``contemporaneous markets'' sub-sample.
In our analysis below, we remove all observations pertaining to U.S., Brazilian, and Sao Paulo market holidays and weekends and remove all days with missing data.12 We also assigned a day as having missing data if we were unable to obtain bond prices in any of the three hours following the announcement or were unable to obtain stock prices for 8 hours following the announcement. As a result, less than one percent of the days were removed from the C-bond data for all days over the sample period, while two percent of the days were removed from the Brazilian stock price data.
To mitigate the effect of stale prices resulting from illiquid trading on individual company stocks in the Bovespa, we drop the opening value of the IBOVESPA, so the first observation for any particular day is 5 minutes after the market opens. We also estimate the effect of news over increasing windows around each announcement. Thus, if shares do not trade until ten minutes after news is announced, the ten-minute window will capture these effects whereas the five-minute window will not.
Data on U.S. Announcements
The top section of Table 2 displays summary information on ten U.S. macroeconomic announcements and on the U.S. monetary policy decisions in our sample. All of the macroeconomic data are released at 8:30 am, except for U.S. industrial production, which is announced at 9:15 am. The job claims announcements are made on a weekly basis, while U.S. GDP announcements for the reference quarter include the initial release and the two subsequent releases (called the ``preliminary'', ``advance,'' and ``final'' releases).13 All other macro data announcements are monthly. The fed funds rate decisions were announced at 2:15 pm over the period covered by this study, as we drop three observations that pertain to inter-meeting announcements (January 3, 2001, April 18, 2001, and September 17, 2001).14
We extract the surprise component of the data releases by subtracting forecasts measured as the median forecast of money market managers provided to Money Market Services (MMS). MMS forecasts are available on the Friday before the macroeconomic announcement. MMS forecasts have been widely used and have been shown to have desirable properties. In particular, Pearce and Roley (1985) find no evidence of bias or departures from forecast rationality in MMS forecasts of U.S. macro announcements, with the exception of industrial production.15 We measure the surprise as the difference between the actual macroeconomic announcement and the survey median. Because MMS has gone out of business, values after May 2004 come from Bloomberg survey data. Our sample consists only of macro announcements with non-zero surprises.
We measure monetary policy surprises by first using the methodology developed by Kuttner (2001) and used by many others. The monetary policy surprise is measured as the intra-daily change in the interest rate implied by the front-month fed funds futures contract over the half-hour window bracketing the 2:15 pm announcement. For all days except for roughly the last week of the month in which a policy action is taken, we measure the change in the front-month fed funds futures contract, and adjust this number by a scalar that accounts for the day of the month on which the FOMC occurs.16 For FOMC decisions that take place roughly the last week of the month, the federal funds rate surprise is measured as the intra-daily change in the yield on the next month's fed funds futures contract (again, over the half-hour window bracketing the announcement).
As GSS and Bernanke and Kuttner have emphasized, this measure does not capture the effects of policy announcements on asset prices that arises via the effect that FOMC announcements have on the expected future path of monetary policy. To capture these effects, we also measure movements in a variety of longer term U.S. interest rates also in a half-hour window around the FOMC announcement; these rates are based on federal funds futures and Eurodollar futures contracts as well as the 10year U.S. Treasury bond yield.
FOMC Announcement Days
Our sample of FOMC dates is one of the smallest we consider, leading us to pay special attention to potential influence of individual FOMC observations. In particular, we examined our sample of FOMC announcements to determine whether other events may have driven Brazilian asset prices within the event windows. There were 50 FOMC meeting days over our sample period, excluding the three inter-meeting moves, 40 of which we include in our C-bond analysis, and 43 of which we include in our IBOVESPA analysis. (The small difference in the FOMC dates used to analyze the two Brazilian assets owes to missing price data.) In the results presented in this paper, we also exclude four days on which we identified events in Latin America that were reported to have had large influences on Brazilian assets that day. Additional analysis (available upon request) found that including these four days lead to substantially larger point estimates of the same sign, with roughly similar significance levels. Thus, the results presented in the paper are conservative estimates.
The four days that were dropped from the FOMC announcements
samples were: May 18, 1999 and three days in 2002 (August
13, 2002, September 24, 2002, and November 6, 2002). On May
18, 1999, the fed funds rate was left unaltered at 4
![]() percent as was expected, but the ten-year Treasury bill
rate jumped nearly 11 basis points over the
percent as was expected, but the ten-year Treasury bill
rate jumped nearly 11 basis points over the
![]() hour window surrounding the announcement, fueled by the
perception that the FOMC would tighten monetary policy in the
future more than had been previously expected.17 The FOMC announcement, however, came
around the time that rumors were sweeping financial markets that
Argentina might abandon its one-for-one currency peg to the dollar.
Although contemporary financial press reports suggest that the
rumors did not depress Argentine and Brazilian asset prices until
the day after the FOMC meeting, the rumors had been fueled by a
Financial Times article the previous
Monday (the day before the FOMC meeting).18 To be on the conservative side, we
dropped this observation from the sample.
hour window surrounding the announcement, fueled by the
perception that the FOMC would tighten monetary policy in the
future more than had been previously expected.17 The FOMC announcement, however, came
around the time that rumors were sweeping financial markets that
Argentina might abandon its one-for-one currency peg to the dollar.
Although contemporary financial press reports suggest that the
rumors did not depress Argentine and Brazilian asset prices until
the day after the FOMC meeting, the rumors had been fueled by a
Financial Times article the previous
Monday (the day before the FOMC meeting).18 To be on the conservative side, we
dropped this observation from the sample.
The three FOMC announcements in 2002 were dropped because of
events in Brazil, which was then in the midst of a financial
crisis. The August 13, 2002 FOMC meeting took place the
day after a credit risk ratings downgrade for Brazil by Moody's.
The downgrade, which had occurred late in the previous day,
prompted Brazilian asset prices to decline sharply on August 13.
The FOMC announcement on September 24, 2002 of no policy change did
not move U.S. yields, but judging from contemporary accounts,
Brazilian asset prices were depressed by news that President-elect
Lula would not keep Arminio Fraga as central bank president in his
administration. The FOMC announcement on November 6, 2002 of a
50 basis point policy easing reduced the fed funds rate to 1
![]() percent, and reduced interest rates along the U.S. yield
curve, as investors had anticipated a smaller interest rate cut.
However, whatever positive effects there may have been of the FOMC
announcement on Brazilian asset prices that day were more than
offset by bad news on the domestic political front.19
percent, and reduced interest rates along the U.S. yield
curve, as investors had anticipated a smaller interest rate cut.
However, whatever positive effects there may have been of the FOMC
announcement on Brazilian asset prices that day were more than
offset by bad news on the domestic political front.19
The five FOMC dates with missing C-bond data include three days in 2001 (March 20, 2001, October 2, 2001, and November 6, 2001), the March 19, 2002 FOMC meeting, and the January 28, 2004 meeting. Of these days, the largest reaction in U.S. markets occurred in the wake of the January 28, 2004 FOMC decision. The announcement of no change in the fed funds rate that day did not take markets by surprise, but according to press reports, investors were surprised by the FOMC's statement, which was read as a sign that the FOMC statement would start tightening sooner than had been anticipated (see GSS.). The rise in yields on U.S. five- and ten-year treasuries was the largest on FOMC days since at least the early 1990s, and press reports indicate that the announcement was followed by a sell-off in Brazilian and other emerging market bonds.20 The inclusion of C-bond data in our sample would increase the efficiency of our estimates, and we suspect, the size of the estimated positive response in spreads.
Do Our C-bond Data Adequately Capture Movements in Asset Prices?
U.S. Treasury bond prices have been shown to respond very quickly to U.S. macro announcements, with price effects being complete within minutes of the announcement (see BEG (2001, Table 3). Therefore, one question is whether our hourly data are of a sufficiently high frequency to capture the market's reaction to U.S. macro announcements. We consider one episode where we know that a macro data announcement prompted a quick and strong reaction in U.S. markets: the U.S. nonfarm payroll announcement on April 2, 2004 which came in 188,000 above expectations (a 1.75 standard deviation surprise). Surprises in nonfarm payroll announcements have been shown to have significant effects on U.S. bond and other industrialized country bond prices or yields (BEG, FRWW). The reaction in U.S. interest rates to the April 2 announcement was large and immediate: rates rose 25 basis points within a few minutes across the term structure. This response that was widely attributed to the widespread perception that the FOMC would subsequently raise policy rates more aggressively than investors had previously expected.
Contemporaneous reports in the financial press indicate that emerging market bond prices also slumped on the news, consistent with the view that investors thought that higher U.S. rates hurt Brazilian sovereign creditworthiness.21 Figure 3 shows that a sharp reaction in the C-bond spread is captured in our data. The vertical axis displays the cumulative response of the Cbond spread, in percentage points, to the U.S. announcement. The observation for 9 a.m. depicts the change from 8 to 9 am in Eastern Time, and so on. The announcement was associated with a 23 basis point jump in the spread over the 8 to 9 am window. The spread then continued to rise, reaching a cumulative increase of about 30 basis points between and 10 and 11 am, and peaking at 60 basis points between noon and 1 pm before partially reversing. Thus, on this day at least, the spread response was quite persistent. Of course it could be that Brazilian asset prices responded less persistently to U.S. news on other days, but we believe that there is good reason to believe the opposite, especially given the evidence of persistence in the hourly data we find below.
IV. Results
In this section, we first put aside for the moment the question of whether Brazilian asset prices move in a predictable direction in response to U.S. news, and ask, do we observe increased volatility in Brazilian asset prices in a narrow window around the announcement? We then address the effects of U.S. news on the Brazilian credit spreads and stock prices.
Volatility on Announcement versus Non-Announcement Days
We compare volatility of asset price movements on these days relative to days when there were no major U.S. or Brazilian macro and monetary policy news announcements. Hence, we also collected data on major Brazilian macro data announcements and the monetary policy announcement. These data are summarized in Table A2 in Appendix 2, which also discusses the construction of this dataset.
In Figure 4, each panel compares the mean absolute change in the Brazilian spread in the hours surrounding a U.S. announcement (the dark bars) to the mean absolute change (light bars) on days with no announcements. Changes are measured in percentage points. Non-announcement days are defined as those on which none of the U.S. or Brazilian announcements listed in Table 2 occur. For the 8:30 am releases, ``1'' refers to the change from 8 am to 9 am, ``2'' refers to the change from 9 am to 10 am, and ``3'' refers to the change from 10 am to 11 am.
Note that the scales differ in these graphs. The mean absolute change in the Brazilian spread is noticeably higher in the wake of the FOMC announcement (lower left panel). The volatility of the spread is high in the first hour following FOMC announcements relative to non-announcement days, and then remains high until the close of U.S. and Brazilian markets. The spread movement is also relatively volatile on days of the GDP, PPI, industrial production, and nonfarm payroll announcements.22
The hourly nature of the C-bond data available makes it impossible for us to know whether we have captured the maximum volatility effects on the spread measures. On the other hand, the fact that the increase in volatility persists beyond the first hour following the nonfarm payrolls, GDP, industrial production surprises as well as the FOMC decisions, suggests that even at an hourly frequency, a systematic response in spreads is discernable.
Figure 5 plots the five-minute mean absolute changes in the IBOVESPA across days when the Brazilian stock market is open at 8:30 am Eastern Time, when U.S. and Brazilian markets are trading contemporaneously. Hence, the solid red line measures the response over the first hour bracketing the announcement that begins five minutes before the announcement (twelve five-minute intervals). The dotted blue line in each graph plots the mean absolute five-minute returns in the same windows on non-announcement days. Thus, for the 8:30 am U.S. macro announcements, the first point in the graph measures the return from 8:25 to 8:30 am. For the FOMC announcement, the first interval measures the return between 2:10 and 2:15 pm. The difference in volatility is substantial immediately following the announcement of the U.S. nonfarm payrolls, GDP data, and the FOMC decisions; at its peak, the mean absolute return around the FOMC announcements is over two times as large as on non-announcement days. Volatility also rises noticeably in response to the PPI and industrial production news.23 In most cases, stock market volatility returns to its normal `non-announcement' level within a half-hour of the news (shown here as the sixth five-minute window). In contrast, FOMC announcements (lower right panel) are associated with not only considerable volatility over the event window relative to non-event days, but also, volatility remains relatively high, even one hour following the announcement.
In Figure 6, we show announcement/non-announcement volatility comparisons for the IBOVESPA on those days where the U.S. macro announcements are made before the Brazilian stock market opens. (Industrial production and FOMC volatility graphs are not in this figure because the U.S. and Brazilian markets are always open at the time of these announcements.) The initial market response is measured as an overnight return, making the event nature of the experiment more tenuous. Nevertheless, while there is considerable volatility in overnight returns, the mean absolute returns are higher than on non-announcement days for all the data releases except GDP and the U.S. trade balance.
We interpret these results as providing some support for claims in the financial press that Brazilian asset prices respond to important U.S. data releases.
Response of Brazilian Asset Prices to U.S. News
We now investigate the sign and degree of Brazilian asset price responses to U.S. economic announcements. As a first pass, we postulate the simple linear relationship between U.S. macro and monetary policy surprises and Brazilian asset price movements. We assume, for example, that prices do not respond asymmetrically to positive and negative surprises, to large versus small surprises, and that they do not interact with the state of the domestic and U.S. business and policy cycles.24
C-bond Spread Responses to U.S. News
Table 3 reports regression results for the C-bond spread from regressions without a constant term.25 The standard errors are heteroskedastic and autocorrelation robust estimates. The coefficients measuring the first hour response of the Brazilian spread to U.S. CPI and PPI data surprises are all significant at the 95 percent level. A one percentage point surprise increase in CPI inflation (measured month-on-month) prompts a 20 basis point increase in the spread over a one-hour interval, while a similar increase in PPI inflation prompts a 4 basis point increase. The significance of the response of the spread to news also persists over a two-hour window after the CPI and PPI announcements, as shown in the column labeled surprise coefficient (0-2). The spread exhibits a significant, but delayed positive response to nonfarm payrolls data, reaching a maximum increase of about 5 basis points for a 100,000 jobs surprise over the two-hour window.26
The coefficient on the FOMC surprise is also large and significant. A 100 basis point surprise in the fed funds rate, as measured by the front month fed funds futures contract, is associated with a 43 basis point increase in the spread over the first hour. One should keep in mind, however, that the surprise associated with a typical FOMC decision in our sample was small--the sample standard deviation of the surprises is only 4 basis points. This implies that a 10 basis point surprise increase in the fed funds rate--over two times the standard deviation of FOMC surprises in our sample --is associated with a roughly 5 basis point increase in the C-bond spread over U.S. Treasuries over the first hour following the announcement. Consistent with the existing literature on industrial economy asset price responses to U.S. news, the R-squared statistics in Table 3 are quite small, indicating that the information in these surprise measures explain only a small portion of the variation in Brazilian C-bond spreads.
We compare our results to those of other event studies that investigate responses of U.S. news to the U.S. Treasury bond market. Our finding that the nonfarm payroll, the PPI, and CPI announcements matter for the C-bond yield spread is similar to the finding by several authors that these macro announcements (among others) move the U.S. Treasury bond market (Fleming and Remolona 1997, BEG, and FRWW). Using data from July 1991 to September 1995, BEG estimate a 0.42 percent fall in the 10-year Treasury price following a similarly-sized positive payrolls shock (greater-than-expected job growth), which roughly translates into a 7 basis point increase in yield. Using a much longer sample period (beginning in the late 1980s) that extends through 2002, FRWW find that several macro data announcements are associated with significant increases in U.S. Treasury interest rates along the yield curve. With respect to the impact of FOMC announcements, in U.S. data, FRWW and GSS estimate that the ten-year U.S. Treasury bond yield increases about 10 basis points on a 100 basis point fed funds shock.
Combining our results with others' findings in the literature suggests that even if U.S. rates rise because growth revisions are revised up, investors view that increase as bad news for Brazilian creditworthiness. That is, investors view the positive spillovers from stronger U.S. growth to be less important than the financial risks associated with higher U.S. interest rates.
How does the C-bond Spread Respond to Changes in Longer-Term U.S. Rates Following FOMC Announcements?
As already mentioned, very little of the variation in the
Brazilian C-bond spread can be explained by surprises associated
with U.S. macro and FOMC meeting decisions over the February 1999
to March 2005 period.27 One
potential explanation for this result is that front-month monetary
policy surprises do not capture all the information contained in
FOMC statements. Long-term U.S. rates may move in response to FOMC
announcements not only because current short-term rates have
changed, but also because the expected path of future short rates
has changed. In particular, investors might mark up the expected
path of short term rates because the FOMC statement is interpreted
as containing information about the likelihood of future policy
moves and/or the state of the economy.![]() 28 In
these cases, movements in longer term interest rates in response to
FOMC announcements may have greater explanatory power for Brazilian
assets than movements in very short rates alone.
28 In
these cases, movements in longer term interest rates in response to
FOMC announcements may have greater explanatory power for Brazilian
assets than movements in very short rates alone.
Figure 7 presents results on the sensitivity of the Brazilian C-bond spread to changes in a variety of U.S. interest rates during 30-minute windows around FOMC announcements. The solid blue line in the top left-hand graph measures the response over a three-hour interval to a 100 basis point increase in the yield on the front-month fed funds contract (labeled as MP1). It is the graphical depiction of the response of the Cbond yield spread to the FOMC decision that was shown in Table 3; here, the cumulative return at succeedingly larger windows (2 hours, or 2 to 4 p.m., then three hours, or 2 to 5 p.m.) around the announcements are also shown. The dotted blue and dashed red lines depict the two-thirds and 95 percent confidence bands.
The graphs labeled MP2 and MP3 in Figure 7 measure the response of the C-bond spread to an FOMC announcement that increases the futures-based forecasts of the funds rate following each of the next two FOMC meetings by 100 basis points. At a 95 percent confidence level, one cannot reject the hypothesis that these increases in short-term interest rates have no statistically significant effect on the spread (i.e., the red dashed line is below zero over most of the three-hour interval). However the responses are large and significant at the 68 percent level. Table 4 reports the point estimates for the spread response in the first hour after the announcement, corresponding to the results in Figure 7, as well as the associated R-squared statistics. The point estimates and R-squared statistics are both increasing substantially in time to the FOMC meeting, suggesting that future expected short term rates play a more important role in determining the Cbond spread than do current short term rates.
Returning to Figure 7, the other panels capture the response of the C-bond yield spread to FOMC announcements that raise future expected euro-dollar rates as well as the ten-year Treasury yield 100 basis points. The graphs labeled ED1 to ED4 depict changes in the Brazilian yield spread to a 100 basis point increase in the expected one- to four-quarter ahead three-month dollar LIBOR, as measured by raw movements in euro dollar futures contracts. As before, we measure the change in these rates in 30-minute windows around the FOMC announcement. Changes in U.S. rates across the term structure elicit large and statistically significant movements in the C-bond yield spread. These results also point to a more powerful effect of FOMC decisions on the C-bond spread than what was apparent from changes in front-month fed funds futures alone. The spread responses are larger in magnitude and generally significant, often at the 95 percent level.
It is important to keep in mind that that U.S. interest rate responses to FOMC announcements actually observed in the sample were much smaller than the 100 basis points so far analyzed, implying that the absolute effects on the Brazilian spread over this period were much smaller than the point estimates shown. The second column of Table 4 displays the standard deviation of each interest rate response to FOMC announcements in our sample. Taking a typical FOMC announcement to be a one-standard deviation response in a particular interest rate, one can see that a typically sized response in the spread as the product of the second and third columns. Thus for an FOMC announcement that raises the ten-year Treasury bond by 4.1 basis points, the spread rises 4 basis points over the first hour following the announcement.
All told, the message that we take away from Figure 7 and Table 4 is that surprise tightenings by the FOMC had significant and sizeable positive effects on Brazilian C-bond spread over the 1999 to March 2005 period. Evidence of such effects are apparent across a range of interest rate measures based on spot and future interest rates of different maturities. Moreover, we find that the size of the spread response was most closely tied to the response of longer-maturity U.S. interest rate responses, suggesting that expectations for future short term interest rates play an important role in determining the C-bond.
Brazilian Stock Market Response to U.S. News
Figure 8 presents results from regressions of Brazilian stock price returns on U.S. macro announcements over the full trading day following their release. (Results for FOMC announcements are shown separately below.) We show results for regressions without a constant that include all days (contemporaneous and non-contemporaneous trading days); results from the subsamples and with a constant were largely similar.29 The x-axis in each graph counts the number of fiveminute increments in increasing windows over one full day of trading following each release. Confidence intervals are at the ninety-five percent confidence level.
A number of U.S. macro announcements, including those for CPI, nonfarm payrolls, retail sales, and the trade balance, have a statistically significant effect on the Brazilian stock price returns. Higher-than-expected consumer price inflation, jobs growth, and retail sales are associated with declines in the IBOVESPA. A better-than-expected U.S. trade balance, which over the period studied translates to a smaller-than-expected U.S. trade deficit, is associated with a rise in the IBOVESPA.
It is interesting that stock prices drop immediately in response
to stronger-than-expected CPI inflation data, but are somewhat more
delayed in their response to the other releases, generally
responding significantly only after about one half to one hour (the
6![]() to 20
to 20![]() five-minute interval on the
x-axis). It is possible that the delayed response reflects illiquid
trading conditions, but if so, it is not clear why the IBOVESPA
responds so quickly to the CPI release and not to other macro
releases.30 (We
consider an alternative explanation for the delayed effects
below.)
five-minute interval on the
x-axis). It is possible that the delayed response reflects illiquid
trading conditions, but if so, it is not clear why the IBOVESPA
responds so quickly to the CPI release and not to other macro
releases.30 (We
consider an alternative explanation for the delayed effects
below.)
Figure 9 shows that the explanatory power of the nonfarm payrolls, retail sales, and the trade balance announcements for Brazilian equity returns (measured by uncentered R-squared) reaches a peak three to four hours after the release of the series. In contrast, the CPI release has the strongest explanatory power on impact. These results also hold in the sub-sample that excludes non-contemporaneous trading days. Thus, the delayed responses in Figure 9 are not being driven by the fact that the majority of the sample measures overnight returns. Across all trading days, the CPI and nonfarm payrolls have the greatest explanatory power for Brazilian stock price movements, with their respective adjusted R-squares peaking at around 20 percent. The explanatory power of U.S. trade balance announcements for Brazilian stock returns peaks at about 10 percent, and for retail sales, the adjusted R-square peaks at only 4 percent.
An investigation into the reasons why Brazilian stock prices move on U.S. announcements is not done in this paper, but the responses in Figure 8 suggest possibilities that are worth pursuing in future work. For example, it is interesting that stronger-than-expected announcements pertaining to real activity (positive payrolls and sales) are associated with a decline in Brazilian stock prices. These responses would seem to suggest that the effects on Brazilian equity returns work more strongly through expectations of expected future U.S. real interest rates, the risk premium, or a combination of both rather than via expected future cash flows, as the latter channel should yield a rise in Brazilian stock prices from the improved U.S. outlook. The decline in Brazilian stock prices following the CPI announcement is also consistent with the view that the announcement is thought by investors to reveal information about the path of future U.S. interest rates or the risk premium.
Recall from Table 3 that a stronger-than-expected nonfarm payrolls release was associated with a statistically significant rise in the C-bond spread only over a two-hour window. It is possible that Brazilian stock prices exhibit a delayed reaction to the U.S. announcement because they are mainly responding to the rise in the C-bond spread. These conjectures remain purely speculative, but overall, the evidence supports the notion that financial factors such as concerns about default risk are indeed at play in determining Brazilian stock price responses to U.S. macro announcements.
Figure 10 depicts the Brazilian stock price responses to various measures of the monetary policy surprise. The main result is that the IBOVESPA declines regardless of the measure of the monetary policy surprise. However, the observed declines are most closely tied to the response to the ten-year U.S. Treasury bond yield. Brazilian stock prices decline about 7 percentage points for a 100 basis point increase in the U.S. Treasury bond yield. Again, putting this into historical perspective, the standard deviation of ten-year yield movements in response to FOMC announcements in our sample is about 4 basis points, implying a 0.3 percent decline in the IBOVESPA, a very plausible number. The decline in the Bovespa measured against movements in shorter-term U.S. rates is sometimes not significant, however, at the 95 percent confidence level. This result that movements in longer-term U.S. rates are more important that those of shorter-term rates stands in contrast to findings in Wongswan (2005), who finds that movements in the front month fed funds futures contract matters for EME stock prices but that the expected path of monetary policy reflected in longer-term rates do not. This difference may owe to the fact that we do not attempt to decompose policy surprises into current and future components, an exercise which requires additional structural assumptions.
V. Conclusion
Our primary aim in this paper is to document evidence of a link between Brazilian asset prices and news about the U.S. economy and U.S. monetary policy. We measure the average response of the Brazilian C-bond yield spread and the Brazilian stock price index in a narrow time window around U.S. macroeconomic data releases and FOMC announcements between February 1999 and April 2005. The role of FOMC announcements is of special interest.
We find that an unexpected rise in U.S. interest rates in response to news about U.S. monetary policy was associated with a systematic rise in the Brazilian C Bond spread and a decline in the Brazilian stock market. Furthermore, information about the expected path of future short rates, as reflected in longer-term interest rates appears to have played an important role in predicting these responses. That said, FOMC surprises explain a very small portion of the variation in Brazilian asset prices. Several U.S. macro data releases have significant effects on the C-bond spread and stock prices. The Brazilian spread responds positively and significantly to positive price and nonfarm payrolls data which also elicit a negative response in Brazilian stock prices. Surprises about U.S. retail sales and the trade balance also have effects on Brazilian share prices, although these effects are quite small. Altogether, these results suggest that financial linkages played a greater role than real economic linkages in determining the response of Brazilian asset values to U.S. news.
There are two important caveats to our work. Although our sample size compares with other work in the high frequency finance literature, it is small and covers only a recent period that includes financial crises in Brazil (and Argentina). Further, it is difficult to draw conclusions about how long the effects on asset prices persist. While the effects of news persist for some time beyond the initial announcements, statistical confidence in this persistence diminishes as the time horizon increases and other news hits the markets.
Intra-daily data on bond prices were converted into yield spreads using a linear approximation based on modified effective spread duration. Modified spread duration measures the negative elasticity of the bond price with respect to a change in its spread, and the effective measure adjusts for callability of the C-bond. We obtained daily data on modified effective spread duration from JP Morgan's webpage (morganmarkets.com). To get a sense of whether this approximation was a reasonable one, we compared daily changes in the spread (end of business day) as reported by JP Morgan to estimates based on the first order approximation. This comparison is summarized by the scatter plot in Figure A1. The y-axis measures, in percentage points, the actual daily change in strip spreads. The x-axis measures the estimated change, also in percentage points, from the approximation. Observations lie roughly on the 45-degree line (not shown), leading us to conclude that this approximation was a sensible one for the intra-daily data.
Table A1 displays the Brazilian macro and monetary policy decisions used when comparing Brazilian asset price volatility on U.S. macro and monetary policy announcement days versus non-announcement days. Non-announcement days were days where there were no major U.S. or Brazilian announcements. Bloomberg has reported release days and times for several Brazilian macro data releases since the late 1990s as well as for the monetary policy release.
Because this is the first study that we know of that uses the Bloomberg data, the data were checked for accuracy. After entering the data by hand, we double-checked the time of the reported data release using other sources. When it was not possible to pin down the time of the data release, we attempted to determine whether the data release came before or after the close of the markets. A dummy variable indicating that there was a Brazilian announcement that day (i.e., a contemporaneous announcement) was set to one if a data release came before the close of the Bovespa. The dummy variable was set equal to one on the following day if the data release came after the close of the Bovespa, even though the Brazilian stock market closed one to two hours before the C-bond market did.
Inaccuracies in Bloomberg times were found to be more common early in the sample period. Release times for the GDP, industrial production, CPI, and unemployment, which are produced by the Brazilian Institute for Geography and Statistics, the IBGE, were relatively easy to verify because the IBGE formally adopted a 9:30 am local time release time at the end of 1999. For 1999, the IBGE release times were compared against the release times that were posted by Dow Jones reports in Factiva. When there were discrepancies, the Dow Jones release times were used. In a couple of cases, we relied on the institution's general practice, which did not appear to have changed over the sample period.31 For the rest of the macro data releases, we relied on the release times that were reported by Bloomberg. Several sources of information were used to determine the release times for the Brazilian monetary policy decisions, which were usually announced after the markets closed. Details are in a memo that is available from the authors upon request.
| No Obs | Source | Announcement time | |
|---|---|---|---|
| IPCA (inflation) | 77 | IBGE | Varies |
| GDP | 26 | IBGE | Varies |
| Unemployment | 75 | IBGE | Varies |
| IGP-M (inflation) | 87 | FGV | Varies |
| IGP-DI (inflation) | 78 | FGV | Varies |
| FIPE inflation | 297 | FIPE | Varies |
| Industrial Production | 77 | IBGE | Varies |
| Vehicle Production | 7 | Anfavea | Varies |
| Trade balance | 77 | MDIC | Varies |
| Current account | 75 | BACEN | Varies |
| Primary fiscal balance | 75 | BACEN | Varies |
| Policy decision (Selic) | 80 | BACEN | Varies |
Notes to Table A1
ANFAVEA=National Association of Vehicle Manufactures; BACEN =
Brazilian central bank; FIPE = Fundação Instituto de
Pesquisas Econômicas, São Paulo; FGV = Getulio Vargas
Foundation; IBGE = Brazilian Institute for Economics and
Statistics; MDIC= Ministry of Development, Industry, and Trade;
IBGE unemployment is from the monthly labor survey, the PME. Data
combine the old and new surveys.
All release times were converted to Eastern Time. Brazilian macro data and monetary policy announcements are released out of Brasilia, Rio de Janeiro, and Sao Paulo, but the three cities are all in the same time zone. Announcement times vary in both Eastern Time and local time for most announcements, except for the IPCA, GDP, and industrial production, which the IBGE began to release at 9:30 am (local time) in late 1999.
The table below lists the beginning of Brazilian Daylight savings time and Brazilian standard time for the sample period.
| Brazilian Daylight Savings Time | Brazilian Standard Time |
|---|---|
| 2/22/99 | 10/4/99 |
| 2/28/00 | 10/9/00 |
| 2/11/01 | 10/15/01 |
| 2/18/02 | 11/4/02 |
| 2/17/03 | 10/20/03 |
| 2/16/04 | 11/3/04 |
| 2/21/05 |
Ammer, J., 2000. ``Determinants of Emerging Market Sovereign Spreads other than Moral Hazard.'' Federal Reserve Board, mimeo, December.
Andersen, T., Bollerslev, T., Diebold, F. X., and Vega, C., 2004. Real Time Price Discovery in Stock, Bond, and Foreign Exchange Markets, Working Paper.
Balduzzi, P., Elton, E., and Green, T. C., 2001. Economic News and Bond Prices: Evidence from the U.S. Treasury Market. Journal of Financial and Quantitative Analysis, Vol 36, No. 4, December, pp. 523-43.
Calvo, G., Leiderman, L., and Reinhart, C., 1993. Capital Inflows and Real Exchange Rate Appreciation in Latin America: The Role of External Factors. IMF Staff Papers, March 1993, vol. 41, pp. 108-51.
Campbell, J., Lo, A., and Mackinlay, A.C., 1997. The Econometrics of Financial Markets. Princeton University Press, Princeton New Jersey, 1997.
Faust, J. Rogers, J., Wang, S., and Wright, J., 2003. The High-Frequency Response o Exchange Rates and Interest Rates to Macroeconomic Announcements, Board of Governors of the Federal Reserve System, International Finance Discussion Paper 784, October.
Faust, J. Swanson, E., and Wright, J., 2003. Do Federal Reserve Policy Surprises Reveal Superior Information about the Economy? Contributions to Macroeconomics, vol. 4.
Ferrucci, G., 2003. Empirical determinants of Emerging Market Economies' Sovereign Bond Spreads. Working paper, Bank of England.
Fleming M. and Remolona, E., 1997. What Moves the Bond Market? FRBNY Economic Policy Review, December, pp. 31-50.
_____, 1999. Price Formation and Liquidity in the U.S. Treasury Market: The Response to Public Information, Journal of Finance, October, Vol. 54 Issue 5, pp 1901-1916
Frankel, J. and Roubini, N., 2001. The Role of Industrial Country Policies in Emerging Market Crises. NBER working paper No. 8634, December.
Gavin, M. and Kulesz, J., 2005. Latin American Economic Perspectives, UBS, January 7.
Gürkaynak, R., 2004. Using Federal Funds Futures Contracts for Monetary Policy Analysis. Mimeo, Federal Reserve Board.
_______, Sack, B. and Swanson, E., 2004. Do Actions Speak Louder Than Words? The Response of Asset Prices to Monetary Policy Actions and Statements. Finance and Economics Discussion Series 2004-66.
International Monetary Fund, 2004. Global Financial Stability Report, April.
Kamin, S. and Von Kleist, K., 1999. The Evolution and Determinants of Emerging Market Credit Spreads in the 1990s. BIS Working Paper No. 68, May.
Kaminsky, G. and Schmukler, S., 2002. Emerging Market Instability: Do Sovereign Ratings Affect Country Risk and Stock Returns?, The World Bank Economic Review, Vol. 16, no 1, pp. 171-195.
Kuttner, K., 2001. Monetary Policy Surprises and Interest Rates: Evidence from the Fed Funds Futures Market, Journal of Monetary Economics, pp. 523-544.
Pearce, D. and Roley, V., 1985. Stock Prices and Economic News, Journal of Business, vol. 58, no. 1, pp. 49-67.
Piazessi, M. and Swanson, E., 2004. Futures Rates as Risk-adjusted Forecasts of Monetary Policy. NBER Working Paper 10547
Reinhart, C. and Reinhart, V., 2001. What Hurts Most? G-3 Exchange Rate or Interest Rate Volatility?, NBER Working Paper 8535, October.
Roush, J., 2003. Evidence Uncovered: Long Term Interest Rates, Monetary Policy, and the Expectations Theory. Mimeo, Federal Reserve Board. (Revised version of International Finance Discussion Paper 712, Board of Governors of the Federal Reserve System, 2001.)
Uribe, M. and Yue, V., 2006. Country Spreads and Emerging
Countries: Who Drives Whom? (Forthcoming in the Journal of International Economics, June
2006)![]()
Wongswan, J. 2003. Transmission of Information Across International Equity Markets, Board of Governors of the Federal Reserve System, International Finance Discussion No. 759. (Forthcoming in Review of Financial Studies)
_____ , 2005. The Response of Global Equity Indexes to U.S. Monetary Policy Announcements, Board of Governors of the Federal Reserve System, International Finance Discussion No. 844.
| Source | Frequency | Primary Market Activity | |
|---|---|---|---|
| Price of C-bond | Reuters 1/ | 1-hour interval, on the hour | 3 am to 5 pm |
| IBOVESPA | Bloomberg | 5-minute interval | Varies (see Figure 2) |
Notes: All times are in Eastern Time unless otherwise indicated. Sample period is February 1, 1999 to April 30, 2005, except for September 13, 2001 to October 8, 2001, where C-bond data are missing.
1/ Data are from Reuters Stream Feed, as is described in text. Intra-daily data on bond prices converted into yield spreads over comparable U.S. Treasuries as is described in Appendix 1.
| Units | No Obs | Source | Announcement time | |
|---|---|---|---|---|
| CPI | pct per mo | 76 | BLS | 8:30 am |
| GDP | pct, q/q (a.r.) | 76 | BEA | 8:30 am |
| Housing starts | mlns of units | 75 | BC | 8:30 am |
| Jobless claims | Thous | 323 | ETA | 8:30 am |
| Industrial production | pct per mo | 76 | FRB | 9:15 am |
| Nonfarm payrolls | thous of jobs | 76 | BLS | 8:30 am |
| PPI | pct per mo | 75 | BLS | 8:30 am |
| Retail sales | pct per mo | 76 | BC | 8:30 am |
| Trade balance | Billions | 76 | BEA | 8:30 am |
| Unemployment | percent | 76 | BLS | 8:30 am |
| Policy decision (FFR) | percent | 50 | FRB | 2:15 pm |
BEA = Bureau of Economic Analysis; BLS = Bureau of Labor Statistics; FRB= Federal Reserve Board; BC= Bureau of the Census; ETA = Employment and Training Administration. U.S. GDP announcements combine 3 announcements for the reference quarter (advance, preliminary, and final GDP).
Notes: Number of observations includes full sample of data; regression samples exclude missing data and announcements that met MMS expectations. FOMC regressions also exclude four additional days owing to special local factors (see text for detail)
| no. obs. | surprise units | 1 Std. Dev. Surprise | Surprise Coefficient (0-1) | Surprise Coefficient (0-2) | R-squared (0-1) | R-squared (0-2) |
|---|---|---|---|---|---|---|---|
CPI | 53 |
percent |
0.16 |
0.196 0.084 |
0.230 0.117 |
0.087 |
0.059 |
GDP | 68 |
percent |
0.60 |
0.013 0.041 |
0.035 0.035 |
0.004 |
0.024 |
Nonfarm Payrolls | 71 |
100k |
1.1 |
0.009 0.016 |
0.049 0.022 |
0.007 |
0.084 |
Industrial Prod. | 60 |
percent |
0.30 |
-0.042 0.051 |
-0.041 0.068 |
0.008 |
0.005 |
Trade Balance | 72 |
billions |
2.60 |
-0.004 0.003 |
-0.003 0.006 |
0.021 |
0.006 |
Unemployment | 50 |
percent |
0.15 |
-0.074 0.114 |
0.081 0.214 |
0.011 |
0.004 |
Jobless Claims | 294 |
100k |
0.19 |
-0.026 0.03 |
0.004 0.05 |
0.002 |
0.000 |
Housing Starts | 57 |
percent |
0.09 |
-0.004 0.098 |
-0.053 0.163 |
0.000 |
0.001 |
PPI | 57 |
percent |
0.51 |
0.041 0.018 |
0.042 0.021 |
0.032 |
0.029 |
Retail Sales | 67 |
percent |
0.79 |
-0.003 0.011 |
-0.001 0.010 |
0.001 |
0.000 |
FOMC* | 40 |
percent |
.04 |
0.433 0.209 |
0.671 0.354 |
0.033 |
0.029 |
* FOMC scheduled meetings; excludes two intermeeting moves in 2001 and FOMC rate reduction following Sept. 11,2001 as well as six FOMC days with missing data (11/15/00; 3/20/01; 10/2/01; 1/6/01; 3/10/02; 1/28/04. Estimates in Table 3 based on sample that also excludes four days with known local events effecting credit spreads (see text for detail): 5/18/1999; 8/13/2002; 9/24/2002; and 11/6/2002. Including these four days yields substantially larger coefficient estimates, and roughly similar significance levels.
Notes: Coefficients significant at the 95% level shown in bold. Results are from regressions without constant ; regressions with constant generally found intercept to be insignificant and are available upon request. Italics are heteroskedastic and autocorrelation robust standard errors
| U.S. Rate | U.S. Rate Sample Std. Dev. (%) | Spread Response* (2 to 3 p.m.) (%) | R-squared |
|---|---|---|---|
| MP1 | 0.04 | 0.43 | 0.03 |
| MP2 | 0.036 | 0.93 | 0.12 |
| MP3 | 0.056 | 0.84 | 0.2 |
| ED1 | 0.039 | 1.07 | 0.18 |
| ED2 | 0.051 | 0.75 | 0.15 |
| ED3 | 0.063 | 0.62 | 0.16 |
| ED4 | 0.069 | 0.58 | 0.17 |
| 10-year | 0.041 | 0.98 | 0.17 |
Notes: MP1 to MP3 denote the change in the fed funds rate that is expected immediately following the current and subsequent two FOMC meetings, respectively, in response to FOMC announcements; these changes are measured from fed funds futures contracts. ED1 to ED4 denote the change in the expected three-month LIBOR rate at the end of each of the next four quarters, again in response to the FOMC announcements, as measured from euro-dollar futures. 10-year is the change in the benchmark 10-year Treasury yield around FOMC announcements. The second column of the table shows sample standard deviation of movements in these U.S. interest rates in 30-minute windows surrounding FOMC announcements. The third column reports the estimated response of the C-bond spread to an FOMC announcement that elicits a one percentage point increase in the respective U.S. interest rate measure. The fourth column gives the uncentered R-squared statistics that is associated with those regressions.
| Trading Hours | Date Range |
|---|---|
8am-3pm |
11/1/99-2/25/00 |
9am-4pm |
2/25/00-10/30/00 |
8am-3pm |
10/31/00-12/1/00 |
7am-3pm |
12/5/00-2/16/01 |
8am-3pm |
2/19/01-3/30/01 |
9am-4pm |
4/1/01-10/26/01 |
8am-3pm |
10/29/01-2/15/02 |
9am-4pm |
2/18/02-10/25/02 |
8am-3pm |
10/28/02-2/14/03 |
9am-4pm |
2/17/03-10/24/03 |
8am-3pm |
10/27/03-2/13/04 |
9am-4pm |
2/16/04-10/29/04 |
8am-3pm |
11/01/04-2/21/05 |
9am-4pm |
2/21/05- |
Notes: The bars measure the mean absolute change in the C-bond spread over U.S. Treasuries, in percentage points, over the first through third hour following the announcement on days of the announcement (dark bars) and versus non-announcement days (light bars). Non-announcement days exclude days of major Brazilian and U.S. macro announcements. The number of announcements is listed in Table 3. The U.S. unemployment announcement is made concurrently with the nonfarm payrolls announcement; hence, there is no separate chart.
Notes: Results shown for days when the Bovespa is open at 8:30 am Eastern Time (``contemporaneous markets''). The solid red lines measure the mean absolute five minute returns on the Brazilian stock index, the IBOVESPA, in percentage points at each five minute interval beginning at 8:25-8:30 (labeled ``1'' on the x-axis) to 9:20 to 9:25 (labeled ``12'' on the x-axis). The dotted blue lines measure the mean absolute return on non-announcement days, similarly measured. Non-announcement days exclude days of major Brazilian and U.S. macro announcements. All macro announcements are at 8:30 am, except for industrial production, which is at 9:15 am. The sample of FOMC announcements consists of scheduled FOMC meetings. The number of observations in parenthesis after each release: CPI (15); claims (103); GDP (24); housing starts (19); industrial production (64); Nonfarm payrolls (26); PPI (18); retail sales (24); trade balance (25); FOMC decisions (43). The U.S. unemployment announcement is made concurrently with the nonfarm payrolls announcement; hence, there is no separate chart.
Notes: Results shown for days when the Brazilian Bovespa is not open at 8:30 am Eastern Time (``non-contemporaneous markets''). The solid red lines measure the mean absolute overnight return to the IBOVESPA, in percentage points beginning with the over night return (labeled ``1'' on the x-axis) to each of the succeeding five minute returns (the return at ``12'' on the x-axis is the 10:00 to 10:05 return. The dotted blue lines measure the mean absolute return on non-announcement days, similarly measured. Non-announcement days exclude days of major Brazilian and U.S. macro announcements. Number of observations in parenthesis after each release: CPI (38); claims (191); GDP (44); housing starts (38); Nonfarm payrolls (45); PPI (39); retail sales (43); trade balance (47). The U.S. unemployment announcement is made concurrently with the nonfarm payrolls announcement; hence, there is no separate chart.
Notes: Brazilian C-bond spread response to various measures of U.S. monetary policy surprises. Regressions exclude constant; returns are cumulative over window measured in number of one-hour increments along the X-axis. FOMC event days: see footnotes to Table 3. Blue solid lines measure the estimated responses, while the dotted blue and dashed red lines plot the 68 and 95 percent confidence intervals. The graph labeled MP1 shows the response to a 100 basis point monetary policy surprise as measured from the front-month fed funds futures contract (same estimates from Table 3). The graphs labeled MP2 and MP3 show the spread response to 100 basis point increase in the expected overnight Fed Funds rate after the next two FOMC meetings, also derived from fed funds futures contracts. ED1 to ED4 measure the response of the spread to a 100 basis point increase in the three-month dollar LIBOR rate at the end of each of four quarters ahead as derived from eurodollar futures contracts. Ten-year measures the response of the spread to a 100 basis point increase in the ten-year U.S. Treasury bond yield in the window around the FOMC decision.
Notes: regressions include all event days and exclude constant. (Results with constant were similar but showed constant to be insignificant are available upon request.) Returns are in percentage points and are in response to a one percentage point surprise, with returns being measured over increasing windows around announcements. The windows are cumulative in the number of five-minute returns measured along x-axis.
Notes: R-squared statistics correspond to regression results shown in Figure 9. Each graph plots R-squared statistics from successive regressions of IBOVESPA returns; returns are plotted over increasing 5 minute windows; the number of 5 minute windows is shown on the x-axis.
Notes: IBOVESPA return (in percent) in response to various
measures of U.S. monetary policy surprises. Regressions exclude
constant; returns are cumulative over windows measured in number of
five minute increments along the X-axis. Blue solid lines measure
the estimated responses, while the dotted blue and dashed red lines
plot the 68 and 95 percent confidence intervals. The graph labeled
MP1 shows the response to a 100 basis point front month fed funds
future policy surprise (same estimates from Table 3). The graphs
labeled MP2 and MP3 show the spread response to a 100 basis point
increase in the expected overnight Fed Funds rate after the next
two FOMC meetings, respectively, calculated from longer dated fed
funds futures contracts. ED1 to ED4 measure the response of the
spread to a 100 basis point increase in the 3 month dollar LIBOR
rate at the end of each of the next four quarters and are derived
from eurodollar futures contracts. Ten-year measures the response
of the spread to a 100 basis point increase in the ten-year U.S.
Treasury bond in the window around the FOMC decision.
Footnotes
1. According to Frankel and Roubini(2001), the monetary policy tightening episode in 2000 is also thought to have helped precipitate the subsequent crises in Turkey and Argentina. Related work is that of Calvo, Leiderman, and Reinhart (1993), who empirically link declines in U.S. interest rates in the early 1990s to international capital flows to Latin America. Return to text
2. The short-term interest rates used are the closest equivalent to a three-month federal funds rates. The authors also look at the effects of U.S. policy on exchange rates. The focus on the study is whether capital controls insulate countries from U.S. monetary shocks. Return to text
3. See also Andersen, Bollerslev, Diebold, and Vega (2002), who study effects of news on exchange rates. Return to text
4. BEG (2001) find that U.S. macroeconomic news releases are generally incorporated into Treasury yields within five minutes of their release. Return to text
5. The IMF's April 2004 Global Financial Stability Report states (p.8) that ``(1)ow short-term interest rates and a steep yield curve provide powerful incentives to boost leverage, undertake carry trades, and seek yield by going out along the credit risk spectrum. There is a real risk of investor complacency in a low interest rate environment.'' See also ``Emerging debt-spreads narrow amid high-yield appetite,'' Reuters, September 20, 2004.
6. For example, see the IMF and Gavin and Kulesz 2005.
7. In 1994, J.P. Morgan developed its EMBI index of emerging market yield spreads over comparable U.S. treasury securities. It was initially largely composed of Brady bonds stripped of U.S. Treasury bond collateral. Brady bonds emerged from the sovereign debt restructurings in the early 1990s on troubled bank loans to developing countries; Latin American countries accounted for most of the Brady bond debt. The increasing presence of dollar-denominated non-Brady bonds and tradable loans over the late 1990s led to the development of a broader index, the EMBI+. The EMBI+ yield spread over U.S. Treasuries has been a popular indicator of sovereign creditworthiness for EMEs and has been the credit spread most often used in studies of the effect of U.S. rates on EME bond yield spreads. However, this index is only available at a daily frequency, whereas this paper focuses on intra-daily movements in spreads. Argentina is excluded from the index because of discontinuities associated with its debt restructurings. Return to text
8. In Frankel and Roubini, an early attempt to explore this issue, the authors find a statistically significant positive association between changes in ex post real short-term U.S. interest rates and changes in the log of EMBI global return over the 1995 to 1999 period. Kaminsky and Schmukler find a statistically significant association between log changes in short-term U.S. rates and log changes in the dollar value of stock price indexes. Return to text
9. Cowley, Matthew, ``Brazil Debt Swap Erases Bad Memories, But Impact
Limited,'' Dow Jones International, July 22, 2005. The formal name
for the C-bond was the Front-Loaded Reduction with Capitalization
Bond.
Return to text
10. More precisely, a Reuters computer that is located in White Plains, New York, runs a program that scans quotes that are posted on Reuters pages by dealers and inter-dealer brokers. The pages are updated from 2 am to 5 pm Eastern time. Reuters was not able to list the institutions whose quotes entered RSF, but from its list of contributors, the most active traders in dollar-denominated Brazilian external bonds appear to be ABN Amro, HSBC, JP Morgan, Santander Investments, UBS, BNP Paribas, Caboto Holdings, and Garban Emerging Markets. Return to text
11. The Bovespa's trading hours in Eastern time change in part because of movements in and out of Daylight Savings time in Brazil and in the United States. In addition, the Bovespa's operating hours are usually adjusted when Brazilian clocks move ahead or back by one hour to better synchronize its trading hours with those of the New York Stock Exchange. Return to text
12. We do not remove February 9, 1999, when a computer glitch shut down electronic trading for two hours because at that time, floor trading accounted for 85 percent of the trading volume. By 2004, electronic trading had accounted for the lion's share of the trading volume. An interesting but unexplored question in this paper, is whether the increasing role of electronic trading may have altered the dynamics of stock price responses to U.S. news. Return to text
13. The preliminary releases come about one month following the end of the reference quarter, and the other two releases come two and three months following the end of the reference quarter. Return to text
14. The fact that there are only three FOMC intermeeting moves, all of which occur in 2001, prevents us from splitting the sample on this basis. On those days, the U.S. financial market reaction was quite pronounced. Including the January 3 and April 18 intermeeting moves in the full sample yields a larger but more delayed estimated effect on both Brazilian asset prices and on U.S. rates. Others who investigate the effects of monetary policy on asset prices always drop the September 17, 2001 announcement from the sample, but not always the other inter-meeting announcements. Return to text
15. For the 1999 to 2004 period, we test for evidence of bias and departures from forecast rationality in the MMS U.S. industrial production forecasts. We also rejected the null of forecast rationality for this sample period. Return to text
16. The adjustment is necessary because the fed funds futures contract settles on the average effective fed funds rate for the month. Return to text
17. The May 18, 1999 FOMC statement included an upward bias for the first time since November 1998. Return to text
18. Reuters, ``Brazil markets slump, worried about Argentine peso,'' May 19, 1999.
19. Brazilian asset prices on November 6, 2002 were reported in the media as having been depressed by the previous day's announcement of unknowns on the transition team for then president-elect Lula. Also reportedly weighing on Brazilian asset prices that day was the announcement the morning of November 6 that the city of Sao Paulo would suspend a scheduled debt repayment to the federal government Return to text
20. JP Morgan Emerging Market
commentary, January 28, 2004; Brandimarte, ``Emerging debt-Change
in Fedspeak brings out bears.'' Reuters News, January 28, 2004.
Return to text
21. ``Emerging debt-prices plummet as US Treasuries dive,'' Reuters News, April 2, 2004, and Bronstein, Hugh, ``Emerging Debt Prices mowed down by rate fears,'' Reuters News, April 2, 2004. We know of no Brazilian macro data releases or other major events that morning (including political) that might have influenced the Brazilian bond market.
22. Fleming and Remolona (1999) study uses tick-by-tick data on U.S. Treasury prices from August 1993 to August 1994. They find that price volatility spikes within minutes of the announcements; macro announcements are grouped together. Return to text
23. However, survey-based expectations of industrial production generically fail rationality tests, casting doubt on whether we are measuring the reaction the surprise components of the data releases. Return to text
24. Anderson, Diebold and Vega (2004) show interesting work along these lines for interactions between stock and bond prices in developed economies. Our limited sample size prevent us from conducting similar analysis here, as our sample period includes only one and a half NBER-dated business cycles and monetary policy cycles. Return to text
25. Regression results including a constant were similar and could not reject a zero value at reasonable significance levels. Results are available upon request. Return to text
26. The average response to the nonfarm payroll announcement is therefore roughly one-third the measured response to the higher-than-expected April 2, 2004 nonfarm report (25 basis point widening in the C-bond spread to a 188 thousand job surprise). Return to text
27. This may not be the case if it were possible to extend the sample back to include February 1994-March 1995 U.S. monetary policy tightening episode, which took markets by surprise. (Appendix A2 of GSS displays the surprises associated with FOMC announcements over the 1990s.) Return to text
28. It could also be that term premiums respond to FOMC announcements. However, Roush (2003) provides evidence to the contrary, conditional on a monetary policy shock. Return to text
29. Separate results for the contemporaneous and non-contemporaneous samples are available from the authors upon request. Return to text
30. Consistent with the illiquid trading interpretation , we found that across all trading days (with and without announcements) there is significant serial correlation in Bovespa index returns in windows shorter that about one half hour. Results are available upon request.
31. FIPE has released its inflation index before markets open, and the Brazilian Central bank has generally released monthly current account balance at 8:30 am local time. Return to text
This version is optimized for use by screen readers. Descriptions for all mathematical expressions are provided in LaTex format. A printable pdf version is available. Return to text