
Board of Governors of the Federal Reserve System
International Finance Discussion Papers
Number 964, January 2009 --- Screen Reader
Version*
The Demand for Youth: Implications for the Hours Volatility Puzzle
NOTE: International Finance Discussion Papers are preliminary materials circulated to stimulate discussion and critical comment. References in publications to International Finance Discussion Papers (other than an acknowledgment that the writer has had access to unpublished material) should be cleared with the author or authors. Recent IFDPs are available on the Web at http://www.federalreserve.gov/pubs/ifdp/. This paper can be downloaded without charge from the Social Science Research Network electronic library at http://www.ssrn.com/.
Abstract:
The employment and hours worked of young individuals fluctuate much more over the business cycle than those of prime-aged individuals. Understanding the mechanism underlying this observation is key to explaining the volatility of aggregate hours over the cycle. We argue that the joint behavior of age-specific hours and wages in the U.S. data point to differences in the cyclical characteristics of labor demand. To articulate this view, we consider a production technology displaying capital-experience complementarity. We estimate the key parameters governing the degree of complementarity and show that the model can account for the behavior of age-specific hours and wages while generating a series of aggregate hours that is nearly as volatile as output.
Keywords: Business cycle, demographics, capital-experience complementarity, labor demand
JEL classification: E00, E32
1. Introduction
The employment and hours worked of young individuals fluctuate much more over the business cycle than for the prime-aged. The hypothesis in this paper is that understanding the mechanisms underlying this observation, while interesting in its own right, has the potential to shed light on a long standing puzzle in the business cycle literature: why aggregate hours are nearly as volatile as output.
Our hypothesis is based on the fact that cyclical fluctuations in aggregate hours are disproportionately accounted for by young workers. In the postwar era 15-29 year olds account for about one quarter of total hours worked in the U.S.; however, this same group accounts for almost one half of the the volatility of aggregate hours at the business cycle frequency.
By contrast, recent work in business cycle theory has, with few exceptions, focused on models with homogenous labor input. As a result, much of the literature cannot address these differences by age, and importantly, the question of why young labor input is so volatile over the cycle. Developing a quantitative theory that can account for the volatility of this age group is likely to be crucial to understanding the volatility of aggregate hours and, ultimately, the mechanisms that amplify and propagate business cycle fluctuations.
This is not the first paper to address this dimension of heterogeneity in analyzing labor market fluctuations. Rios-Rull (1996) and Gomme, Rogerson, Rupert, and Wright (2004) study models with age differences in hours volatility owing to life-cycle considerations (e.g., preferences for home and market production, and efficiency units of hours worked that differ by age). They show that life-cycle factors are successful at explaining volatility differences between the prime-aged and those near retirement age, but cannot account for the much greater volatility of young workers as compared to all others. Hansen and Imrohoroglu (2008) consider a life-cycle model in which efficiency units of labor are accumulated while working via learning-by-doing. This generates substantial differences in volatility by age, but at the expense of dampening the volatility of hours worked overall. Hence, Hansen and Imrohoroglu (2008) show that the learning-by-doing model actually under-performs relative to the standard real business cycle (RBC) model in matching the volatility of aggregate hours over the cycle.
In this paper, we maintain comparability with the RBC literature by studying a model that represents a minimal deviation from the standard model. Within the RBC framework, differences across age groups arise from differences in preferences (or succinctly, differences in labor supply), factors relating to technology (labor demand), or both.5
How does one distinguish between these two potential channels? We suggest that the joint behavior of age-specific hours and wages over the cycle sheds light on this question. As we document in Sections 2 and 3, young individuals in the U.S. not only experience greater hours volatility, but also have greater wage volatility than prime-aged individuals. Any modification to the RBC model incorporating age-specific labor supply differences alone would not be able explain this fact.6 Jointly matching the behavior of hours and wages in the RBC framework requires a role for differences in cyclical labor demand.
To articulate this view, we consider an environment characterized by labor demand differences due to capital-experience complementarity in production. The large body of work studying capital-skill complementarity has concentrated on education as a proxy for skill (see Krusell, Ohanian, Rios-Rull, and Violante (2000), and the references therein for anaylsis relating to the post-war education premium; and see Castro and Coen-Pirani (2008) for analysis of the business cycle implications of capital-skill complementarity). We concentrate on the other significant observable dimension of skill emphasized in Mincerian wage regressions, namely labor market experience.
To highlight the potential in this approach, we assume that there are only two groups of workers, young and old; we posit that an individual's age directly determines his or her labor market experience. With technology exhibiting capital-experience complementarity, differences in the cyclical demand for experienced and inexperienced labor arise naturally. As an extreme case, suppose that capital and old, or experienced, labor are perfect complements, while capital and young, or inexperienced, labor display some substitutability. If capital services are a state variable and firms are profit maximizing and price-taking, any shock generating a response in inputs results in variation in only the quantity of young labor hired.
More generally, we view our theoretical mechanism as speaking to the existence of complementarity in production between experienced labor and factors that are in fixed short-run supply to the firm. These factors may include organizational capital, firm know-how, or operational knowledge that inherently require the presence of experienced labor. Since this type of knowledge or capital is hard to adjust in the short-run, it is natural that cyclical fluctuations in output result in greater variation of inputs like young or inexperienced labor that are less tied to these factors.
Of course, the measurement of factors such as organizational capital or firm know-how is very difficult. The challenge in this paper is to account for the observed differences in hours volatility in a quantitative manner. This motivates our modeling choice, as specifying complementarity between physical capital and experienced labor. The availability of high-quality data relating to these factor inputs allows us to discipline our analysis.
We estimate the key structural parameters governing the degree of capital-experience complementarity in a parsimonious manner. Our strategy entails estimating these parameters from the model's factor demand equations, exploiting the identification that emerges from the relationship between aggregate prices and quantities observed in the U.S. data. It is worth noting that our estimation strategy does not target differences in the cyclical volatility of hours.
Based on this structural estimation we simulate the model economy. We find that the model generates age-specific hours volatilities that are similar to those observed in the data. As a by-product of this success, the model generates volatility of aggregate hours that is very close to that of aggregate output. We then show that the model can account for the joint behavior of age-specific hours and relative wages.
The paper is organized as follows. In Section 2, we document differences in the volatility of hours worked by age, and indicate the importance of this dimension of disaggregation relative to other demographic factors. Empirical evidence guiding our modeling approach is presented in Section 3. Section 4 presents our model with capital-experience complementarity, along with analytical results on the response of age-specific hours and wages to business cycle shocks. Section 5 discusses the quantitative specification of our model, and Section 6 presents results for the model's cyclical properties relative to the U.S. data. Concluding remarks are provided in Section 7.
2. The Cyclicality of Age-Specific Hours
In this section, we analyze the responsiveness of market work over the U.S. business cycle for data disaggregated by age. We consider both the behavior of hours worked and unemployment by age.
2.1 Age-Specific Hours
Our approach to studying differences in business cycle volatility by age is similar to that of Gomme, Rogerson, Rupert, and Wright (2004). We use data from the March supplement of the CPS to construct annual series for per capita hours worked from 1963 to 2005 for individuals within specific age groups. We also construct an aggregate series for all individuals 15 years and older. See Appendix A.6 for detailed information on data sources used throughout the paper.
To extract the high frequency component of hours worked, we remove the trend from each series using the Hodrick-Prescott (HP) filter. Since we are interested in fluctuations at business cycle frequencies (those higher than 8 years), we use a smoothing parameter of 6.25 for annual data.7
Table 1 presents results on the time series volatility of hours worked in the U.S. for the 15-19, 20-24, 25-29, 30-39, 40-49, 50-59, and 60-64 year-old age groups. The first row presents the percent standard deviation of the detrended age-specific series. We see a decreasing relationship between the volatility of hours worked and age, with an upturn close to retirement age.
We are not interested in the high frequency fluctuations in
these time series per se, but rather those that are correlated with
the business cycle. For each age-specific series, we identify the
business cycle component as the projection on a constant, current
detrended output, and on current and lagged detrended aggregate
hours; we refer to these as the cyclical hours worked
series. The second row of Table 1 reports the ![]() from these regressions. This is high for most age
groups, indicating that the preponderance of high frequency
fluctuations are attributable to the business cycle. The exception
is the 60-64 age group: here a larger fraction of fluctuations are
due to age-specific, non-cyclical shocks.
from these regressions. This is high for most age
groups, indicating that the preponderance of high frequency
fluctuations are attributable to the business cycle. The exception
is the 60-64 age group: here a larger fraction of fluctuations are
due to age-specific, non-cyclical shocks.
The third row indicates the percent standard deviation of the cyclical age-specific series. Compared to row one, the largest differences between filtered and cyclical volatilities are for those in their 60s, reflecting the point made immediately above. The data indicates a pattern of decreasing volatility with age. The young experience much greater cyclical volatility in hours than all others. Moreover, the differences across age groups are large. The standard deviation of cyclical hours fluctuations for 15-19 and 20-24 year old workers is 5 and 2.5 times that of 50-59 year olds, respectively.8
The fourth row indicates the average share of aggregate hours worked during the sample period by each age group. The fifth row indicates the share of "aggregate hours volatility" attributable to each age group. Here, aggregate hours volatility is represented by the weighted average of age-specific cyclical volatilities, with weights reflecting an age group's share of aggregate hours. What is striking is the extent to which fluctuations in aggregate hours are disproportionately accounted for by young workers. Although those aged 15-29 make up only about one quarter of aggregate hours worked, they account for nearly one half of aggregate hours volatility. By contrast, prime-aged workers in their 40s and 50s account for more than 40 of hours, but only about 25% of hours volatility.
These age patterns remain when we undertake further demographic breakdowns. We summarize these results, found in Tables 2 and 3. Firstly, we disaggregate the U.S. workforce by age and gender. Differences across genders are apparent, but relatively small. When averaged across age groups, the difference between men and women is about 13% for either the filtered or cyclical hours worked series. However, the differences by age are stark. Again, the decreasing pattern by age exists for both men and women, with the magnitude of volatility differences roughly similar. For instance, 20-24 year olds experience hours volatility roughly 3 times greater than the prime-aged for both genders. Evidently, the differences across age groups within gender are more pronounced than the differences across genders within age group.
For disaggregation by age and educational attainment, the results remain. For brevity, we present results only for two education groups: those with high school diplomas or less (labeled high school and less), and those with at least some postsecondary education (more than high school).9 There is a noticeable difference in the volatility of hours by education. But more interestingly, the differences across education are much less pronounced for young workers than for the prime-aged. A simple average across 20-24 and 25-29 year olds indicates that those with less education have hours volatility that is 1.5 times that of those with more, implying that young workers experience greater than average volatility, regardless of education. By contrast, the difference across education groups is a factor of 2.5 for the prime-aged, those aged 40-59. Finally, note that large differences by age remain for both education groups. For instance, 20-24 year olds experience hours volatility 2.5 to 3 times greater than 40-49 year olds, regardless of educational attainment. Indeed, 20-29 year olds with more education have greater volatility than prime-age workers with less education! Hence, as in Gomme, Rogerson, Rupert, and Wright (2004) and Hansen and Imrohoroglu (2008), we focus on age-level heterogeneity as the primary demographic factor in understanding the volatility of aggregate hours worked.10
2.2 Age-Specific Unemployment
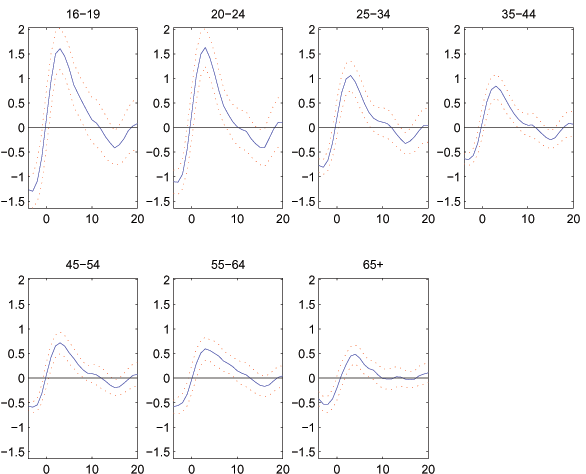
Additional evidence on the differences in business cycle sensitivity across age groups is presented in Figure 1. Here we present the average response of unemployment to a postwar U.S. recession, where recessions are those identified by the NBER.11The unemployment rate data come from the BLS, cover the period 1948:I-2004:II, and are available for the age groups presented. Along the horizontal axis, date 0 represents the first quarter of a recession. The figure tracks the filtered age-specific unemployment rates for 20 quarters beyond this date. The solid blue line represents the recessionary response averaged across episodes, while the dashed red lines represent two-standard-error bands around the average for each variable. Unemployment rates for all age groups rise quickly in response to a recession, crossing above trend at date 0, then peaking at date 4 or 5 before slowly returning to trend.
Magnitudes of the recessionary response, however, differ across age groups. The peak response of unemployment is much stronger for young individuals. While the unemployment rate of 16-19 and 20-24 year olds increases by 1.5 above trend, the increase is only about 0.6% for prime-aged workers. Indeed, the peak responses of these two age groups are well outside of the 2 standard deviation bands of all the other age groups.
Moreover, the 16-19 and 20-24 age groups experience average trough-to-peak responses of approximately 2.4% about the trend. This compares with a trough-to-peak response of only 1.2% for prime-aged individuals. In summary, the unemployment rate of young workers responds to recessions roughly twice as much as that of prime-aged workers.
3. Distinguishing Among Mechanisms
As stated in the Introduction, many potential mechanisms may account for the observed age group differences in hours and employment volatility. In this section, we present empirical evidence that guides the approach taken in this paper.
To focus discussion, we first consider analyses based on spot market determination of hours and wages in the labor market, as in the RBC model. In such a framework, age group differences can arise from differences in the cyclical characteristics of labor demand or labor supply. The premise of Section 3.1 is that an analysis of real wages can be used to differentiate between these two mechanisms. The relative cyclicality of age-specific wages, taken together with the facts from Section 2, indicates an important role for age group differences in cyclical labor demand.
In Section 3.2, we present a variance decomposition of age-specific hours worked. We argue that this decomposition is evidence against different labor force participation decisions being the sole or primary factor in determining age differences in hours volatility. Finally, in Section 3.3, we consider a relaxation of the assumption of spot markets for labor. In particular, we consider a specific hypothesis regarding age differences owing to the long-term nature of employment relationships. Evidence based on an intersectoral analysis of hours worked volatility does not support this view as being of primary importance.
3.1 Age-Specific Wages
From the March CPS, we use information on labor income and hours worked to construct annual time series for wage rates for the period 1963 through 2005. Given our interest in wage cyclicality, we construct wage rates in a way mitigating composition effects stemming from labor heterogeneity. Specifically, we classify individuals into 220 highly disaggregated demographic groups, and weight observations to derive efficiency measures of labor input per age group for the computation of wages. Our procedure is an extension of that used by Katz and Murphy (1992) and Krusell, Ohanian, Rios-Rull, and Violante (2000), and is detailed in Appendix A.6.12 We then HP-filter these series to isolate fluctuations at the business cycle frequency.
The first row in Table 4 reports the
percent standard deviation of the HP-filtered hourly real wage
rates by age. Again, to mitigate composition effects due to
heterogeneity, we compute real wage rates for 5 year age groups, as
opposed to the 10 year age groups presented in the previous
section. We see a decreasing pattern in volatility by age with an
upturn beginning in the 55-59 age group. The second row reports the
![]() from projecting the age-specific series
onto detrended aggregate output and hours, as done in Section
2.1. These
statistics indicate that real wages, when disaggregated by age, are
indeed mildly procyclical. Row 3 presents the percent standard
deviation of the cyclical age-specific series. As in Row 1, we see
the familiar decreasing pattern of volatility by age, with a slight
upturn at the end of the age distribution. For instance, the
standard deviation of cyclical volatility for 20-24 year olds about
twice that of 45-49 year olds.13
from projecting the age-specific series
onto detrended aggregate output and hours, as done in Section
2.1. These
statistics indicate that real wages, when disaggregated by age, are
indeed mildly procyclical. Row 3 presents the percent standard
deviation of the cyclical age-specific series. As in Row 1, we see
the familiar decreasing pattern of volatility by age, with a slight
upturn at the end of the age distribution. For instance, the
standard deviation of cyclical volatility for 20-24 year olds about
twice that of 45-49 year olds.13
If differences in labor supply were the sole factor responsible for the greater volatility of young workers' hours than the prime-aged, their wages would simultaneously be less volatile over the business cycle. We provide a detailed demonstration of this in Section 4 and Appendix A.3.
By contrast, we find exactly the opposite. The greater cyclical volatility of wages for the young displayed here, in conjunction with their greater volatility in hours worked, indicates that there must be some role played by differences in the cyclical nature of labor demand.14 This finding is laid out in detail in Section 4.
3.2 Variance Decomposition of Hours Worked
Changes in per capita hours worked can be viewed as due to changes in either hours per labor force participant, or the number of the labor force participants per capita. We refer to the former as the hours margin, and to the latter as the participation margin. The relative contribution of each of these margins to the volatility of hours over the cycle is important in guiding our modeling approach. If the participation margin is the main driver of hours variation then one could argue the practical necessity of explicitly modeling a labor force participation decision.15 Otherwise, it would indicate that to a first-order approximation, the primary factor generating age group differences are to be found elsewhere. We hence consider in Table 5 the decomposition of the variance of hours worked into the hours and participation margins.
Table 5 shows the proportion of hours variation by age group that can be attributed to the participation margin. The first row, using HP-filtered data, presents the ratio of the variance owing to the participation margin to the sum of the variances of the hours margin and participation margin. For those at or near retirement age, the participation decision appears to be an important source of variance in their hours worked. However, for all others, the bulk of the hours variation is due to variation in hours per labor force member. Specifically, for 20-59 year old individuals, the participation margin accounts for no more than 14% of hours variation. For teenagers, this is higher at 27%; nonetheless, nearly three quarters of the variance of teenaged hours worked is due to the hours margin.
The second row presents an alternative decomposition which accounts for the covariance between hours per labor force member and labor force members per capita. Specifically, the participation margin's share is now defined as its variance plus the covariance, divided by the total variance of hours worked. Row 2 presents a similar picture to Row 1. The participation still figures heavily into the variance of hours for those over 60. For all others, the participation margin is much less important than the hours margin.
The third and fourth rows present the same information as Rows 1 and 2, respectively, now isolating the business cycle component of hours per labor force member and labor force participation.16 Focusing on fluctuations that are correlated with the cycle tells a similar story: with covariance terms not included, the participation margin explains less than 25% of the variation of any age group. With the inclusion of covariance terms, participation explains at most 35% of the variation for the 15-19 year olds; fluctuations in hours per labor force participant continue to account for the bulk of the variation in per capita hours over the business cycle for all age groups.17
3.3 Seniority Rules and Young Workers
The analysis thus far has pointed to the importance of modeling labor demand over the cycle in accounting for age differences in volatility. This is based principally on observed differences in the cyclicality of age-specific wages; this in turn relies on a spot market view of labor market transactions. In reality, the institutional features of labor markets are more complex than those posited in the RBC literature, and it can be argued that this complexity partially accounts for age differences in hours volatility.
Specifically, in reality workers and firms engage in multi-period relationships, in contrast to the period-by-period transactions typically considered in RBC models. As the data on age-specific hours suggests, older workers have more permanent work situations that young workers. This may be due to the nature of the production process - the existence of organizational capital, firm know-how, or operational knowledge - which, in and of itself, is not incompatible with our emphasis on capital-experience complementarity. That is, capital-experience may be responsible for both the differences in the existence of long-term relationships for old and young workers, and the differences in hours volatility. On the other hand, differences in the permanency of work tenure across age may be driven by institutional features, like labor market policies or social norms, that are independent of considerations owing to the nature of production. Hence, seniority rules or "last-in/first-out" (LIFO) rules may constitute an independent force for age group differences in hours volatility over the cycle.18 We have conducted a preliminary analysis of the importance of such institutional features, using data disaggregated at the sectoral level. We find no evidence for seniority or LIFO rules as a primary factor explaining age differences in volatility. For brevity, we present our analysis in Appendix A.2.
4. The Model
In this section, we present a model in which production technology displays capital-experience complementarity. The remaining features of the model - in particular, household preferences - are specified to conform as closely as possible to the standard RBC model. This is not to claim that other mechanisms, such as life-cycle labor supply considerations, are irrelevant for understanding age differences in hours volatility. Instead, this specification allows us to isolate the role of cyclical differences in labor demand by age in accounting for the facts presented in Sections 2.1 and 3.
4.1 Households
The economy is populated by a large number of identical,
infinitely-lived households. Each household is composed of a unit
mass of family members. For simplicity, we assume there are only
two types of family members, young and old. Let
![]() denote the share of family members that
are young. Family members derive instantaneous utility from
consumption
denote the share of family members that
are young. Family members derive instantaneous utility from
consumption ![]() and disutility from hours spent
working
and disutility from hours spent
working ![]() , according to
, according to
![]() , where
, where
![]() denotes either young
or old.
denotes either young
or old.
The representative household's date ![]() problem is to
maximize
problem is to
maximize
![$\displaystyle E_{t}\sum_{j=t}^{\infty}\beta^{t-j}\left[ s_{Y}U_{Y}\left( C_{Yt} ,N_{Yt}\right) +(1-s_{Y})U_{O}\left( C_{Ot},N_{Ot}\right) \right] ,$](img15.gif)
|
(4.1) |
subject to
with ![]() ,
,
![]() . Here
. Here
![]() denotes capital holdings at
date
denotes capital holdings at
date ![]() ,
, ![]() is the rental rate,
is the rental rate,
![]() is the wage rate of young workers, and
is the wage rate of young workers, and
![]() is the wage rate of old workers. The
household takes all prices as given. In our benchmark case, we
specify the instantaneous utility function to be
is the wage rate of old workers. The
household takes all prices as given. In our benchmark case, we
specify the instantaneous utility function to be
The parameters
![]() govern the Frisch
labor supply elasticity, while
govern the Frisch
labor supply elasticity, while
![]() are used to calibrate
the steady state values of
are used to calibrate
the steady state values of ![]() and
and ![]() . We normalize the time endowment of all family members
to unity, so that
. We normalize the time endowment of all family members
to unity, so that
![]() .19
.19
Because of additive separability in preferences, optimality entails equating consumption across all family members:
| (4.2) |
The first-order condition (FONC) for capital holdings is given by:
The FONCs for hours worked are given by:
Condition (4.2)
implies that the income effect of a consumption change on labor
supply is equal across young and old workers. In our benchmark
calibration, we set
![]() so that the
substitution effect of wage changes on labor supply is equated
across workers. Adopting identical income and substitution effects
allows us to isolate the role of capital-experience complementarity
in generating volatility differences across young and old workers.
so that the
substitution effect of wage changes on labor supply is equated
across workers. Adopting identical income and substitution effects
allows us to isolate the role of capital-experience complementarity
in generating volatility differences across young and old workers.
4.2 Firms
Production exhibits capital-experience complementarity. Final goods are produced by perfectly competitive firms using capital, experienced labor, and inexperienced labor as inputs. We assume that an individual's age directly determines his or her labor market experience, so that all young workers are inexperienced while all old workers are experienced. This allows us to write the production function as
![$\displaystyle Y_{t}=\left[ \mu\left( A_{t}H_{Yt}\right) ^{\sigma}+(1-\mu)\left[ \lambda K_{t}^{\rho}+(1-\lambda)\left( A_{t}H_{Ot}\right) ^{\rho}\right] ^{\frac{\sigma}{\rho}}\right] ^{\frac{1}{\sigma}},\ \ \sigma,\rho <1.$](img35.gif)
|
(4.3) |
Here ![]() is labor input of young (or
inexperienced) workers,
is labor input of young (or
inexperienced) workers, ![]() is labor input of old
(or experienced) workers, and
is labor input of old
(or experienced) workers, and ![]() is capital
services hired at date
is capital
services hired at date ![]() . Labor-augmenting technology
follows a deterministic growth trend with stationary shocks:
. Labor-augmenting technology
follows a deterministic growth trend with stationary shocks:
where
![]() ,
,
![]() , and
, and ![]() is the trend growth rate of
technology.
is the trend growth rate of
technology.
The elasticity of substitution between old workers and capital
is given by
![]() , while the
elasticity of substitution between young workers and the
, while the
elasticity of substitution between young workers and the
![]() -
-![]() composite is
composite is
![]() . Following
Krusell, Ohanian,
Rios-Rull, and Violante (2000), we define production as exhibiting
capital-experience complementarity when
. Following
Krusell, Ohanian,
Rios-Rull, and Violante (2000), we define production as exhibiting
capital-experience complementarity when
![]() .
.
Firms hire inputs from perfectly competitive factor markets to maximize profits:
Optimality entails equating factor prices with marginal revenue products:
4.3 Equilibrium
Equilibrium is defined as follows. Given
![]() and the stochastic
process,
and the stochastic
process,
![]() , a competitive
equilibrium is an allocation,
, a competitive
equilibrium is an allocation, ![]()
![]()
![]()
![]()
![]()
![]()
![]()
![]() , and a price system,
, and a price system, ![]()
![]()
![]() , such that:
given prices, the allocation solves both the representative
household's problem and the representative firm's problem for all
, such that:
given prices, the allocation solves both the representative
household's problem and the representative firm's problem for all
![]() ; and factor markets clear for all
; and factor markets clear for all
![]() :
:
Walras' law ensures clearing in the final goods market:
Finally, for the purposes of model evaluation, we define aggregate
hours worked as
![]() .
.
4.4 The Effects of Capital-Experience Complementarity
In this subsection, we provide analytical results regarding the relative cyclicality of hours worked and real wages for young and old agents. To begin, we show that when production displays capital-experience complementarity, the response of young hours to a technology shock is greater than that of the old; this result holds even when there are no differences in labor supply characteristics.
Proposition 1 Let ![]() and
and ![]() . The response of hours of young workers to a business cycle shock is greater than the response of hours of old workers.
. The response of hours of young workers to a business cycle shock is greater than the response of hours of old workers.
The proof is contained in Appendix A.4. Here, we
demonstrate this result for the special case in which ![]() . When
. When ![]() , the
, the ![]() -
-![]() composite becomes Cobb-Douglas, and the
firm's FONCs simplify as:
composite becomes Cobb-Douglas, and the
firm's FONCs simplify as:
In ![]() -
- ![]() space, these
define linear labor demand curves, with slope
space, these
define linear labor demand curves, with slope
![]() for young labor and
slope
for young labor and
slope
![]() for old.
Since
for old.
Since
![]() , and
, and
![]() (recall that
capital-experience complementarity is defined as
(recall that
capital-experience complementarity is defined as
![]() , and we have assumed
, and we have assumed
![]() ), the demand curve for young labor is
flatter than that of old labor. Moreover, a shock to technology (a
change in
), the demand curve for young labor is
flatter than that of old labor. Moreover, a shock to technology (a
change in ![]() ) generates a vertical shift in the
young labor demand curve of
) generates a vertical shift in the
young labor demand curve of ![]() , which is
larger than the shift in the old labor demand curve of
, which is
larger than the shift in the old labor demand curve of
![]() . These two
factors combine to generate the result of Proposition 1.
. These two
factors combine to generate the result of Proposition 1.
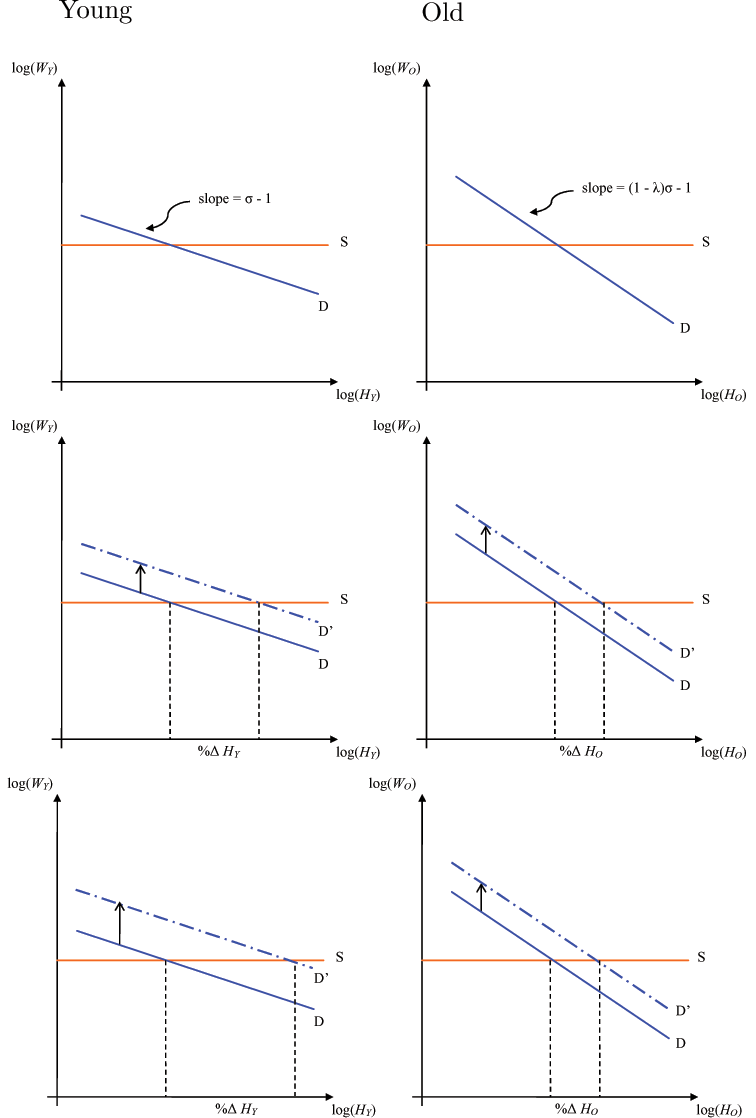
We show this diagrammatically in Figure 2. The left panel
depicts the demand curve for young labor, the right panel for old
labor. In each panel, the horizontal line depicts the labor supply
curves derived from the household's FONCs with Rogerson-Hansen
preferences and lotteries; in ![]() -
-![]() space, both are linear with common slope,
space, both are linear with common slope,
![]() . This restriction is
made for graphical simplicity and is relaxed in Figure 3; as indicated in
the proposition, the result is independent of the (common) slope of
the labor supply curves.
. This restriction is
made for graphical simplicity and is relaxed in Figure 3; as indicated in
the proposition, the result is independent of the (common) slope of
the labor supply curves.
Using a circumflex to denote log deviations, consider a positive
shock to technology, ![]() . In equilibrium, the
positive income effect of this shock generates an upward shift in
the labor supply curves; since our model assumes identical wealth
effects across agents, we abstract from these shifts in the diagram
for the sake of clarity. The technology shock also results in an
equilibrium output response,
. In equilibrium, the
positive income effect of this shock generates an upward shift in
the labor supply curves; since our model assumes identical wealth
effects across agents, we abstract from these shifts in the diagram
for the sake of clarity. The technology shock also results in an
equilibrium output response, ![]() ; since the
effect of this response is identical across labor demand curves, we
abstract from these in the diagram as well. Finally, note that
capital is a state variable, so that the response of capital to the
shock is
; since the
effect of this response is identical across labor demand curves, we
abstract from these in the diagram as well. Finally, note that
capital is a state variable, so that the response of capital to the
shock is ![]() .
.
Hence, the only effect that requires diagrammatic consideration
is the direct effect of the shock to the labor demand curves, and
we plot these in the middle and bottom rows of Figure 2. Suppose,
momentarily, that the technology shock results in identical shifts
in the two demand curves: this is illustrated as the dotted lines
in the middle row. As is geometrically obvious, this results in a
larger equilibrium response of young labor input relative to the
old, i.e.
![]() . This is due to
the relative complementarity of old labor to capital, implying that
the marginal revenue product of labor is more sensitive to changes
in labor for
. This is due to
the relative complementarity of old labor to capital, implying that
the marginal revenue product of labor is more sensitive to changes
in labor for ![]() relative to
relative to ![]() . After a positive shift in labor demand, a smaller
change in old labor is required to achieve the same change in its
marginal revenue product, and we call this the relative
slope effect.
. After a positive shift in labor demand, a smaller
change in old labor is required to achieve the same change in its
marginal revenue product, and we call this the relative
slope effect.
But note that the positive shock actually generates a larger
vertical shift in the demand for ![]() than for
than for
![]() :
:
![]() . That
is, the shock has a larger direct effect on the marginal revenue
product of young labor. This is depicted by the dash-dot line in
the left panel of the bottom row. This additional relative
shift effect reinforces the relative slope effect. Hence, in
equilibrium,
. That
is, the shock has a larger direct effect on the marginal revenue
product of young labor. This is depicted by the dash-dot line in
the left panel of the bottom row. This additional relative
shift effect reinforces the relative slope effect. Hence, in
equilibrium,
![]() .
.
For the extreme case with infinite Frisch labor supply
elasticities (
![]() ) displayed, the
equilibrium wage response is equated across young and old labor.
However, for the more general case of positive Frisch elasticity (
) displayed, the
equilibrium wage response is equated across young and old labor.
However, for the more general case of positive Frisch elasticity (
![]() ), the response of
the young wage to a technology shock will be greater than that of
the old wage with capital-experience complementarity. This is
illustrated in the top row of Figure 3. The young and
old labor supply curves exhibit identical (less than infinite)
Frisch elasticities. With capital-experience complementarity, a
shock to technology simultaneously generates a larger hours and
wage response of the young as compared to the old.
), the response of
the young wage to a technology shock will be greater than that of
the old wage with capital-experience complementarity. This is
illustrated in the top row of Figure 3. The young and
old labor supply curves exhibit identical (less than infinite)
Frisch elasticities. With capital-experience complementarity, a
shock to technology simultaneously generates a larger hours and
wage response of the young as compared to the old.
Analytically, this can be derived from the household's FONCs with respect to labor supply. Using the fact that consumption is equated across agents:
Substituting in the labor market clearing conditions, this can be rewritten in terms of log deviations as
When
![]() ,
,
![]() follows directly
when
follows directly
when
![]() , as is the case
with capital-experience complementarity. The intuition for this is
straightforward: when agents have identical labor supply curves,
the only way to induce a greater hours response for young workers
is through a larger wage response.
, as is the case
with capital-experience complementarity. The intuition for this is
straightforward: when agents have identical labor supply curves,
the only way to induce a greater hours response for young workers
is through a larger wage response.
Note, however, that this condition implies a stronger result.
With capital-experience complementarity, the wage response of young
workers can be greater than that of the old, even when young labor
supply is more elastic (i.e. when
![]() ). We view this as
an important result, since our point is not to claim that labor
supply characteristics are identical across all agents. Indeed, the
Frisch elasticity of young workers may be greater, or the income
effect of consumption changes for young workers may be smaller, or
both, relative to the old. The mechanism embodied in
capital-experience complementarity is still capable of jointly
delivering greater cyclical volatility of hours and wages for the
young relative to the old.
). We view this as
an important result, since our point is not to claim that labor
supply characteristics are identical across all agents. Indeed, the
Frisch elasticity of young workers may be greater, or the income
effect of consumption changes for young workers may be smaller, or
both, relative to the old. The mechanism embodied in
capital-experience complementarity is still capable of jointly
delivering greater cyclical volatility of hours and wages for the
young relative to the old.
On the other hand, assume there is no capital-experience
complementarity, so that there are no differences in the response
of labor demand to a technology shock. As we discuss formally in
Appendix A.3, and demonstrate
graphically in the bottom row of Figure 3, then one must
assume that the Frisch labor supply elasticity of the young is
higher than that of the old in order to match the fact that
![]() is more responsive to shocks
than
is more responsive to shocks
than
![]() . However, in this case with
identical labor demand characteristics, such a model cannot match
the fact that
. However, in this case with
identical labor demand characteristics, such a model cannot match
the fact that
![]() is more responsive than
is more responsive than
![]() . This has been made obvious in
the bottom row of Figure 3, where the labor
supply curve of the young has been illustrated as being perfectly
elastic. More generally, as long as labor supply is more elastic
for the young relative to the old, the wage response of the young
will be smaller in response to identical labor demand fluctuations.
Hence, matching both the higher relative volatility of young
hours and young wages requires a model where labor demand
shocks are not age neutral.
. This has been made obvious in
the bottom row of Figure 3, where the labor
supply curve of the young has been illustrated as being perfectly
elastic. More generally, as long as labor supply is more elastic
for the young relative to the old, the wage response of the young
will be smaller in response to identical labor demand fluctuations.
Hence, matching both the higher relative volatility of young
hours and young wages requires a model where labor demand
shocks are not age neutral.
5. Quantitative Specification
In this section, we describe the quantitative specification used
for evaluating the model. To maintain comparability with the RBC
literature, we adopt a standard calibration when possible. However,
the model's parameters governing elasticities of substitution in
production, ![]() and
and ![]() , cannot
be calibrated to match standard first moments in the U.S. data.
Instead, we adopt a structural estimation procedure to identify
these values using data from the NIPA and CPS. After describing the
procedure, we discuss calibration of the remaining parameter
values. Given the evidence in the previous sections, we classify
15-29 year olds as young and 30-64 year olds as old.
, cannot
be calibrated to match standard first moments in the U.S. data.
Instead, we adopt a structural estimation procedure to identify
these values using data from the NIPA and CPS. After describing the
procedure, we discuss calibration of the remaining parameter
values. Given the evidence in the previous sections, we classify
15-29 year olds as young and 30-64 year olds as old.
5.1 Structural Estimation
Our strategy entails estimating ![]() and
and
![]() from the model's factor demand
equations.20 Consider the firm's FONC with
respect to the demand for
from the model's factor demand
equations.20 Consider the firm's FONC with
respect to the demand for ![]() rewritten in
logged, first-differenced form:
rewritten in
logged, first-differenced form:
| (5.1) |
where ![]() is a constant, and
is a constant, and ![]() is a function of current and lagged shock innovations
is a function of current and lagged shock innovations
Hence, ![]() is identified from the response of
is identified from the response of
![]() to exogenous changes in
to exogenous changes in ![]() and
and ![]() .
.
The age-specific wage measures analyzed in Section 3.1 are
constructed using hours data in order to translate direct
information on labor income into information on hourly wages,
similar to Krusell, Ohanian,
Rios-Rull, and Violante (2000)'s hourly wage and Katz and Murphy (1992)'s weekly wage
constructions. To avoid problems stemming from using ![]() , which is partly constructed from
, which is partly constructed from ![]() , in our regression, we estimate a variant of (5.1) for which
direct data on the left-hand side variable is available.21
This is obtained by multiplying both sides of the FONC by
, in our regression, we estimate a variant of (5.1) for which
direct data on the left-hand side variable is available.21
This is obtained by multiplying both sides of the FONC by
![]()
| (5.2) |
where
![]() denotes labor
income earned by young workers, for which data is available
directly from the CPS. If there were no endogeneity issues (see
below),
denotes labor
income earned by young workers, for which data is available
directly from the CPS. If there were no endogeneity issues (see
below), ![]() could be estimated from a simple
restricted least-squares regression.
could be estimated from a simple
restricted least-squares regression.
To estimate ![]() , we proceed in a similar
manner. Combining the firm's FONCs with respect to
, we proceed in a similar
manner. Combining the firm's FONCs with respect to ![]() and
and ![]() and performing similar
manipulations obtains
and performing similar
manipulations obtains
| (5.3) |
where ![]() denotes the share of national income
earned by old labor, and
denotes the share of national income
earned by old labor, and ![]() the share of national
income earned by capital.
the share of national
income earned by capital.
Importantly, this procedure does not require imposing any
restrictions from the model's specification of household
behavior.22 The only assumptions required to pin
down ![]() and
and ![]() are:
are:
![]() profit maximization on the part of
firms, and
profit maximization on the part of
firms, and ![]() that changes in factor prices
reflect changes in marginal revenue products. As is obvious from
our estimating equations, (5.2) and (5.3), our
identification does not in any way use the fact that young hours
are more volatile over the cycle than old hours. Moreover, no
aspect of our approach imposes that
that changes in factor prices
reflect changes in marginal revenue products. As is obvious from
our estimating equations, (5.2) and (5.3), our
identification does not in any way use the fact that young hours
are more volatile over the cycle than old hours. Moreover, no
aspect of our approach imposes that
![]() . Whether this condition is
satisfied depends on the relation between aggregate prices and
quantities observed in the data.
. Whether this condition is
satisfied depends on the relation between aggregate prices and
quantities observed in the data.
5.1.1 Instruments
Since both of our estimating equations are based on the estimation of factor demand equations, we need to address the endogeneity of the regressors to the error term. The structural equations identify the error term as due to shocks to productivity. In order to obtain unbiased estimates more generally, we must isolate variation in our regressors that is unrelated to shocks shifting firms' factor demand, be they technology shocks or other omitted factors from the FONCs.
We do so by adopting an instrumental variables (IV) approach.
Specifically, we use two instruments: lagged birth rates and the
Ramey and
Shapiro (1998) dates indicating the onset of exogenous military
build-ups.23 In a standard RBC model like the one
we consider, the introduction of exogenous government spending
shocks introduces exogenous shifts in labor supply due to the
income effect of such shocks (see Christiano and Eichenbaum (1992)). This results in
changes in ![]() ,
, ![]() , and
, and
![]() that are unrelated to shifts in factor
demand.
that are unrelated to shifts in factor
demand.
Our second instrument is lagged birth rates. This instrument allows us again to identify changes in current labor supply, this time due to changes in past fertility that are uncorrelated to shifts in factor demand.24 Recall that
Lagged birth rates are valid if we assume that fertility is
exogenous to past technology shock innovations,
![]() . If one
believes that fertility decisions, say, 15 years ago might be
endogenous to innovations at least 15 years ago, then some bias
might be induced with these instruments. However, note that in the
case of the 15-year lagged birth rate, the concern is its
correlation with the sum
. If one
believes that fertility decisions, say, 15 years ago might be
endogenous to innovations at least 15 years ago, then some bias
might be induced with these instruments. However, note that in the
case of the 15-year lagged birth rate, the concern is its
correlation with the sum
![]() in
in ![]() . For standard values of shock
persistence,
. For standard values of shock
persistence, ![]() , relevant for business cycle
analysis, the impact of this is almost neligible. Obviously, for
birthrates of larger lag, this is even smaller. We thus conclude
that, from an empirical standpoint, lagged birth rates are valid
instruments.
, relevant for business cycle
analysis, the impact of this is almost neligible. Obviously, for
birthrates of larger lag, this is even smaller. We thus conclude
that, from an empirical standpoint, lagged birth rates are valid
instruments.
We obtain IV estimates of
![]() and
and
![]() , with Newey-West standard
errors of
, with Newey-West standard
errors of ![]() and
and ![]() ,
respectively.25There is clear evidence for the
relevance of our instruments from readily available weak-instrument
hypothesis tests. Anderson (1951) and Cragg and Donald (1993) test the null that the
instrumented regressors are under-identified due to the
instruments' irrelevance: we reject using either statistic in both
(5.2) and (5.3) with
,
respectively.25There is clear evidence for the
relevance of our instruments from readily available weak-instrument
hypothesis tests. Anderson (1951) and Cragg and Donald (1993) test the null that the
instrumented regressors are under-identified due to the
instruments' irrelevance: we reject using either statistic in both
(5.2) and (5.3) with
![]() -values below 0.007 in all cases. Thus, the
data suggest that weak-instrument issues are not of
concern.26
-values below 0.007 in all cases. Thus, the
data suggest that weak-instrument issues are not of
concern.26
5.1.2 Specification Testing
Here, we provide additional evidence from a series of
specification tests in favor of our model of capital-experience
complementarity. To do so, we maintain the following assumptions
from our benchmark model: (i) that final output is produced using
physical capital, ![]() , old labor input,
, old labor input,
![]() , and young labor input,
, and young labor input, ![]() , and (ii) that the production function features a
nested CES functional form.
, and (ii) that the production function features a
nested CES functional form.
Our specification (4.3) posits that the
innermost nesting is a CES composite of ![]() -
-![]() . But more generally, the production
function could alternatively feature an innermost nesting of
. But more generally, the production
function could alternatively feature an innermost nesting of
![]() -
-![]() or
or ![]() -
-![]() . Each of these specifications
generate different FONCs as estimating equations. These equations
differ in terms of dependent and independent variables, but
maintain the same functional forms. Our approach is to test for
misspecification in these regressions in order to determine which
of these three alternatives the data rejects (if any).27
. Each of these specifications
generate different FONCs as estimating equations. These equations
differ in terms of dependent and independent variables, but
maintain the same functional forms. Our approach is to test for
misspecification in these regressions in order to determine which
of these three alternatives the data rejects (if any).27
Before proceeding, we note that this testing approach may appear narrow in scope, particularly due to our maintained assumption, (ii). We argue that this is not the case for two primary reasons. First, virtually all quantitative macroeconomic models embody a high degree of log-linearity in preferences and technology, and our nested CES production function is simply a generalization of that. Secondly, our alternative specifications for production allow for the possibility that labor demand is symmetric across young and old labor. Specifically, consider the specification:
where both
![]() and
and
![]() are CES
functions in their two arguments.28 For this nesting, it
is easy to show that there is no difference in the cyclical
properties of labor demand across
are CES
functions in their two arguments.28 For this nesting, it
is easy to show that there is no difference in the cyclical
properties of labor demand across ![]() and
and
![]() ; see Appendix A.3 for
details. Hence, our specification tests allow us to discern whether
the data, in fact, prefer a model featuring labor demand
differences due to capital-experience complementarity.
; see Appendix A.3 for
details. Hence, our specification tests allow us to discern whether
the data, in fact, prefer a model featuring labor demand
differences due to capital-experience complementarity.
To this end, we perform the Ramsey (1969) test for model misspecification. In particular, our model's production function, (4.3), delivers linear estimating equations, (5.2) and (5.3). The alternative production function nestings deliver analogously linear pairs of FONCs for estimation. As discussed in Davidson and MacKinnon (2004), the Ramsey test is a straightforward and powerful method for testing the linear restrictions imposed in these regressions. The null hypothesis of the test is that the linear estimating equations are correctly specified.
To summarize, the procedure amounts to a joint hypothesis test
that coefficients on non-linear terms are equal to zero; this test
statistic has an asymptotic
![]() distribution (see Appendix
A.5 for additional discussion). For our chosen
distribution (see Appendix
A.5 for additional discussion). For our chosen ![]() -
-![]() nesting, the statistic equals 0.47
with
nesting, the statistic equals 0.47
with ![]() -value 0.79; we cannot reject the null
hypothesis of no model misspecification. On the other hand, for the
alternative
-value 0.79; we cannot reject the null
hypothesis of no model misspecification. On the other hand, for the
alternative ![]() -
-![]() and
and ![]() -
-![]() nestings this statistic takes the
value 13.99 and 31.78 with associated
nestings this statistic takes the
value 13.99 and 31.78 with associated ![]() -values 0.001
and 0.000, respectively. Hence, we find clear evidence to reject
the null hypothesis that these estimating equations are correctly
specified. We take this as evidence that the data favors our
specification embodying capital-experience complementarity.
-values 0.001
and 0.000, respectively. Hence, we find clear evidence to reject
the null hypothesis that these estimating equations are correctly
specified. We take this as evidence that the data favors our
specification embodying capital-experience complementarity.
5.2 Calibration
Given the estimated values for ![]() and
and
![]() , the remaining parameters are
calibrated as is standard, with
, the remaining parameters are
calibrated as is standard, with
![]() ,
,
![]() . The only two " new"
parameters are
. The only two " new"
parameters are ![]() and
and ![]() , the
share parameters in our production function (4.3). Following
Krusell, Ohanian,
Rios-Rull, and Violante (2000) we calibrate these to match national income shares.
Specifically, in our model we set
, the
share parameters in our production function (4.3). Following
Krusell, Ohanian,
Rios-Rull, and Violante (2000) we calibrate these to match national income shares.
Specifically, in our model we set ![]() and
and
![]() to match the 1968-2005 national
income shares of
to match the 1968-2005 national
income shares of
![]() and
and
![]() . With values for
. With values for
![]() and
data on output and factor inputs, we back out the implied
technology series
and
data on output and factor inputs, we back out the implied
technology series
![]() 29
29
6. Quantitative Evaluation
Column 1 in Table 6 presents statistics for HP-filtered U.S. data. As is well known,
the volatility of aggregate hours is almost identical to the
volatility of output (the ratio of standard deviations is
![]() ). The remaining rows in Column 1 report
the relative volatility of hours and wages for the two age groups.
While aggregate hours worked is as volatile as output, this masks
large differences across the young and the old. The hours of the
young are about
). The remaining rows in Column 1 report
the relative volatility of hours and wages for the two age groups.
While aggregate hours worked is as volatile as output, this masks
large differences across the young and the old. The hours of the
young are about ![]() more volatile than output,
while the hours of the old are less volatile than output. As noted
in Section 3.1, the volatility
of real wages is also greater for the young than for the old. For
our 15-29 and 30-64 year old age groups, the ratio of real wage
volatility is
more volatile than output,
while the hours of the old are less volatile than output. As noted
in Section 3.1, the volatility
of real wages is also greater for the young than for the old. For
our 15-29 and 30-64 year old age groups, the ratio of real wage
volatility is ![]() .
.
We begin the quantitative evaluation of the model by setting
![]() , so that utility is
linear in hours worked. This is a useful benchmark since the
standard RBC model (with homogenous labor and Cobb-Douglas
production function) requires very high labor supply elasticity to
generate significant volatility of hours. In particular, the
indivisible labor model (with perfectly elastic aggregate labor
supply) generates a ratio of the standard deviation of hours to
output of approximately
, so that utility is
linear in hours worked. This is a useful benchmark since the
standard RBC model (with homogenous labor and Cobb-Douglas
production function) requires very high labor supply elasticity to
generate significant volatility of hours. In particular, the
indivisible labor model (with perfectly elastic aggregate labor
supply) generates a ratio of the standard deviation of hours to
output of approximately ![]() .30 In
this sense, the volatility of aggregate hours worked represents a
puzzle to the RBC literature.
.30 In
this sense, the volatility of aggregate hours worked represents a
puzzle to the RBC literature.
As Column ![]() of Table 6 reports, the capital-experience complementarity model generates
volatility of total hours that is very close to that observed in
the data; the relative standard deviation of aggregate hours to
output is
of Table 6 reports, the capital-experience complementarity model generates
volatility of total hours that is very close to that observed in
the data; the relative standard deviation of aggregate hours to
output is ![]() . The next two rows show that the
key to this success lays in the model's ability to generate a
series of hours worked by the young that fluctuates substantially
more than output and old hours over the business cycle. The model
generates a volatility ratio of
. The next two rows show that the
key to this success lays in the model's ability to generate a
series of hours worked by the young that fluctuates substantially
more than output and old hours over the business cycle. The model
generates a volatility ratio of ![]() for young hours
to output, which is slightly greater than the value of
for young hours
to output, which is slightly greater than the value of ![]() observed in the data. On the other hand, the model
understates the volatility of old hours relative to output: the
relative standard deviation is
observed in the data. On the other hand, the model
understates the volatility of old hours relative to output: the
relative standard deviation is ![]() , while this is
, while this is
![]() in the data. Our quantitative
specification has (essentially) unit elasticity of substitution
between capital and old hours (
in the data. Our quantitative
specification has (essentially) unit elasticity of substitution
between capital and old hours (![]() ), and
infinite Frisch elasticity of labor supply for the old. These are
the same features displayed by the homogenous labor input in the
standard RBC model with indivisible labor, discussed in the
preceding paragraph. Thus the capital-experience complementarity
model generates a relative volatility of old hours to output
similar to the relative volatility of aggregate hours to output in
the standard RBC model.
), and
infinite Frisch elasticity of labor supply for the old. These are
the same features displayed by the homogenous labor input in the
standard RBC model with indivisible labor, discussed in the
preceding paragraph. Thus the capital-experience complementarity
model generates a relative volatility of old hours to output
similar to the relative volatility of aggregate hours to output in
the standard RBC model.
Finally, while the benchmark calibration is successful with respect to the hours dimension, it cannot account for the behavior of relative wages between the young and the old. This is not a surprise since we have infinite Frisch labor supply elasticity for both family members; in Section 4.4, we showed that the volatility of age-specific wages would be identical for this case.
In Column ![]() we consider the following
modification: we change only the Frisch labor supply elasticity of
the young to match the relative wage volatility. This requires a
minimal change, moving
we consider the following
modification: we change only the Frisch labor supply elasticity of
the young to match the relative wage volatility. This requires a
minimal change, moving
![]() from 0 to
from 0 to ![]() . The
model now generates greater volatility in the wage of young labor
compared to old labor, as observed in the U.S. Moreover, the model
generates volatility of age-specific wages relative to output that
is also close to those found in the data.31 Not surprisingly,
lower elasticity of young labor supply induces a fall in the
volatility of young hours, and hence, aggregate hours relative to
output. However, the fall is quantitatively small, and the values
for
. The
model now generates greater volatility in the wage of young labor
compared to old labor, as observed in the U.S. Moreover, the model
generates volatility of age-specific wages relative to output that
is also close to those found in the data.31 Not surprisingly,
lower elasticity of young labor supply induces a fall in the
volatility of young hours, and hence, aggregate hours relative to
output. However, the fall is quantitatively small, and the values
for
![]() and
and
![]() are still very similar to those found in the data. It is
interesting to note that, as in the case with
are still very similar to those found in the data. It is
interesting to note that, as in the case with
![]() , the larger
discrepancy between model and data is in matching the relative
volatility of old hours worked to output, and not in matching the
much greater volatility of hours worked by the young.
, the larger
discrepancy between model and data is in matching the relative
volatility of old hours worked to output, and not in matching the
much greater volatility of hours worked by the young.
In sum, we see that the simulated model generates age-specific hours volatilities that are similar to those observed in the data. As a by-product of this success, the model generates volatility of aggregate hours that is very close to that of aggregate output. Moreover, the model accounts for the joint behavior of age-specific hours and wages.
7. Conclusion
We have presented an RBC model displaying capital-experience complementarity in production. This is motivated by our investigation of the joint behavior of age-specific hours and wages. Young individuals' hours and wages are more volatile over the business cycle than those of old individuals. Within an RBC framework, differences in the cyclical characteristics of age-specific labor demand can explain this fact, while differences in labor supply characteristics on their own cannot. We view our model as a straightforward and parsimonious extension to the standard RBC model that allows for such a difference in labor demand. We estimate the key structural parameters governing the degree of capital-experience complementarity, in a manner that does not target the observed difference in the volatility of hours.
Our quantitative model is able to match the relative volatility of age-specific hours to output. As a result, it is also able to replicate the relative volatility of aggregate hours with respect to output. Hence, capital-experience complementarity in production provides a solution to the long standing hours volatility puzzle in the RBC literature.
Table 1. Volatility of Hours Worked by Age Group, U.S.
Ages 15-19 |
Ages 20-24 | Ages 25 -29 | Ages 30-39 | Ages 40-49 | Ages 50-59 | Ages 60-64 | |
|---|---|---|---|---|---|---|---|
| filtered volatility | 4.351 | 2.130 | 1.471 | 1.073 | 0.790 | 0.824 | 1.309 |
| 0.79 | 0.80 | 0.83 | 0.88 | 0.89 | 0.72 | 0.30 | |
| cyclical volatility | 3.868 | 1.902 | 1.318 | 1.014 | 0.752 | 0.705 | 0.708 |
| share of hours (%) | 3.34 | 10.64 | 13.23 | 26.12 | 23.98 | 17.73 | 4.97 |
| share of hours volatility (%) | 11.62 | 18.21 | 15.70 | 23.83 | 16.23 | 11.25 | 3.17 |
Notes: Data from the March CPS, 1968-2005.
Filtered volatility is the percentage standard deviation of
HP-filtered log data. Cyclical volatility is the percentage
standard deviation of HP-filtered log data as projected on
aggregate business cycle measures, with the ![]() from
this projection reported. Share of hours is the sample average
share of aggregate hours worked by the age group. Share of hours
volatility is the age group's share of "aggregate hours
volatility," the average of age-specific cyclical volatilities
weighted by hours shares.
from
this projection reported. Share of hours is the sample average
share of aggregate hours worked by the age group. Share of hours
volatility is the age group's share of "aggregate hours
volatility," the average of age-specific cyclical volatilities
weighted by hours shares.
Table 2. Volatility of Hours Worked by Age and Gender, U.S.
| Ages 15-19 | Ages 20-24 | Ages 25 -29 | Ages 30-39 | Ages 40-49 | Ages 50-59 | Ages 60-64 | |
|---|---|---|---|---|---|---|---|
| filtered volatility: female | 4.865 | 2.067 | 1.594 | 1.141 | 0.955 | 1.034 | 1.826 |
| filtered volatility: male | 4.664 | 2.774 | 1.645 | 1.257 | 0.854 | 0.891 | 1.906 |
| cyclical volatility: female | 4.087 | 1.726 | 1.183 | 0.872 | 0.776 | 0.706 | 0.887 |
| cyclical volatility: male | 3.829 | 2.208 | 1.472 | 1.151 | 0.762 | 0.695 | 0.826 |
Notes: Data from the March CPS, 1968-2005. Filtered volatility is the percentage standard deviation of HP-filtered log data. Cyclical volatility is the percentage standard deviation of HP-filtered log data as projected on aggregate business cycle measures.
Table 3. Volatility of Hours Worked by Age and Education, U.S.
| Ages 20-24 | Ages 25 -29 | Ages 30-39 | Ages 40-49 | Ages 50-59 | Ages 60-64 | |
|---|---|---|---|---|---|---|
| filtered volatility: high school and less | 2.362 | 1.942 | 1.574 | 1.061 | 1.172 | 1.847 |
| filtered volatility: more than high school | 2.228 | 1.257 | 0.692 | 0.734 | 0.814 | 1.764 |
| cyclical volatility: high school and less | 2.106 | 1.739 | 1.467 | 0.920 | 0.894 | 0.973 |
| cyclical volatility: more than high school | 1.694 | 1.026 | 0.532 | 0.526 | 0.331 | 0.515 |
Notes: Data from the March CPS, 1968-2005. Filtered volatility is the percentage standard deviation of HP-filtered log data. Cyclical volatility is the percentage standard deviation of HP-filtered log data as projected on aggregate business cycle measures.
Table 4. Volatility of Real Hourly Wages by Age Group, U.S.
| Ages 15-19 | Ages 20-24 | Ages 25 -29 | Ages 30-39 | Ages 40-49 | Ages 50-59 | Ages 60-64 | |
|---|---|---|---|---|---|---|---|
| filtered volatility | 2.87 | 1.59 | 1.27 | 1.09 | 1.19 | 1.53 | 1.64 |
| 0.35 | 0.28 | 0.23 | 0.17 | 0.14 | 0.12 | 0.14 | |
| cyclical volatility | 1.69 | 0.84 | 0.61 | 0.46 | 0.44 | 0.54 | 0.61 |
Notes: Data from the March CPS, 1963-2005.
Filtered volatility is the percentage standard deviation of
HP-filtered log data. Cyclical volatility is the percentage
standard deviation of HP-filtered log data as projected on
aggregate business cycle measures, with the ![]() from
this projection reported.
from
this projection reported.
Table 5. Hours Decomposition, Participation Margin
| Ages 15-19 | Ages 20-24 | Ages 25 -29 | Ages 30-39 | Ages 40-49 | Ages 50-59 | Ages 60-64 | |
|---|---|---|---|---|---|---|---|
| filtered volatility: covariance not included (%) | 27.28 | 8.87 | 7.84 | 6.83 | 8.97 | 14.00 | 48.00 |
| filtered volatility: covariance included (%) | 36.64 | 18.67 | 9.27 | 14.04 | 10.74 | 20.58 | 48.29 |
| cyclical volatility: covariance not included (%) | 24.26 | 4.39 | 1.96 | 1.43 | 0.40 | 2.41 | 1.69 |
| cyclical volatility: covariance included (%) | 35.87 | 15.89 | 7.34 | 7.85 | 2.12 | 10.61 | 4.94 |
Notes: Data from the March CPS, 1968-2005. Shown are percentage shares of total hours variation attributed to the participation margin. Total hours per age group member is the product two variables: labor force participation per age group, and hours per labor force participant in that age group. "Covariance not included" means covariance terms are ignored, so total variation is just the sum of the variables' variances and the share attributed to the participation margin is the variance of labor force participation. "Covariance included" means total variation includes covariance terms, so total variation is the sum of the variables' variances plus two times their covariance and the share attributed to the participation margin is the variance of labor force participation plus the covariance. Filtered volatility is the standard deviation of HP-filtered log data. Cyclical volatility is the standard deviation of HP-filtered log data as projected on aggregate business cycle measures.
Table 6. Data and Model Moments
| Relative Volatility - U.S. Data | Relative Volatility: Model: Benchmark | Relative Volatility - Model: Alternative |
|
|---|---|---|---|
| std( | 0.97 | 0.92 | 0.89 |
| std( | 1.48 | 1.55 | 1.41 |
| std( | 0.82 | 0.68 | 0.69 |
| std( | 0.35 | 0.26 | 0.32 |
| std( | 0.25 | 0.26 | 0.27 |
| std( | 1.26 | 1.00 | 1.20 |
Notes: Column 1: HP filtered data from March
CPS, 1968-2005. Column 2: Rogerson-Hansen
preferences,
![]() . Column
3:
. Column
3:
![]() ,
,
![]() to match data on relative
age-specific wages.
to match data on relative
age-specific wages.
Figure 1. Unemployment Response to Recession
Notes: Data from BLS, 1948:I-2004:II. Dynamic behavior of age-specific unemployment rates over a recession. Solid line represents unemployment rate response, averaged over NBER defined recessions. Dotted line represents two-standard-error band. Date 0 represents onset of recession, as identified by NBER.
Figure 2. Labor Supply and Demand Diagrams 1
Notes: All panels: Red lines labeled "S"
depict the labor supply curves derived from the household's FONCs
with Rogerson-Hansen preferences in log-log space with common slope
![]() ; blue lines labeled "D"
depict labor demand curves. Top panel: slope of
demand curve for
; blue lines labeled "D"
depict labor demand curves. Top panel: slope of
demand curve for ![]() is flatter than the demand curve
for
is flatter than the demand curve
for ![]() . Middle panel: we
abstract from the wealth effects of a productivity shock on the
labor supply since they are identical across young and old; the
shock causes both demand curves to shift up; the "relative slope"
effect is evident in
. Middle panel: we
abstract from the wealth effects of a productivity shock on the
labor supply since they are identical across young and old; the
shock causes both demand curves to shift up; the "relative slope"
effect is evident in
![]() . Bottom panel: the "relative shift" effect is
evident from the labor demand for
. Bottom panel: the "relative shift" effect is
evident from the labor demand for ![]() shifting
up by more than for
shifting
up by more than for ![]() , increasing
, increasing
![]() even more
even more
Figure 3. Labor Supply and Demand Diagrams 2
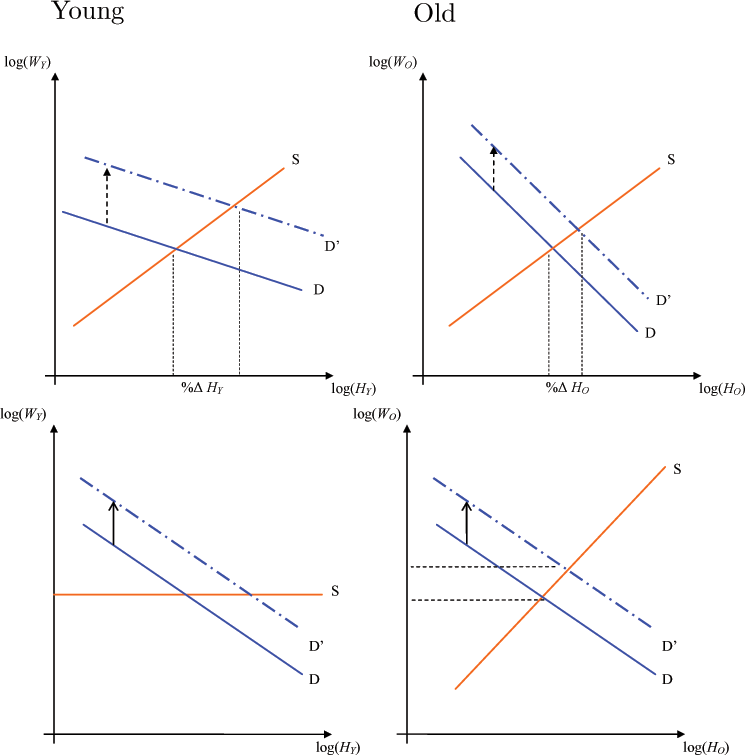
Notes - All panels: Red lines labeled "S"
depict the labor supply curves derived from the household's FONCs
in log-log space; blue lines labeled "D" depict labor demand
curves. Top panel: supply curves with common slope
![]() and demand curves
with capital-experience complementarity. Bottom
panel: demand curves without capital-experience
complementarity while the supply curve for
and demand curves
with capital-experience complementarity. Bottom
panel: demand curves without capital-experience
complementarity while the supply curve for ![]() is
more elastic than the supply curve for
is
more elastic than the supply curve for ![]() in order
to match the larger
in order
to match the larger
![]() .
.
Figure 4. Major Industry Unionization Rates and Young/Old Hours Relative Volatility
Notes: Unionization rate data available from BLS for 1983-2005, major industries as defined by BLS supersectors. Hours data from March CPS, 1983-2005. Relative volatility is ratio of standard deviation of 15-29 year old hours to standard deviation of 30-59 year old hours.
References
Anderson, T. W. (1951): "Estimating linear restrictions on regression coefficients for multivariate normal distributions," Annals of Mathematical Statistics, 22, 327-351.
Baxter, M., and R. G. King (1999): "Measuring Business Cycles: Approximate Band-Pass Filters For Economic Time Series," The Review of Economics and Statistics, 81(4), 575-593.
Beaudry, P., and D. Green (2003): "Wages and Unemployment in the United States and Germany: What Explains the Differences?"," American Economic Review, 93(3), 573-602.
Burnside, C. (2000): "Some facts About the HP Filter," Discussion paper, World Bank.
Burnside, C., M. Eichenbaum, and S. Rebelo (1995): "Capital Utilization and Returns to Scale," vol. NBER Macroeconomics Annual, pp. 67-110. NBER.
Castro, R., and D. Coen-Pirani (2008): "Why have aggregate skilled hours become so cyclical since the mid-1980s?," International Economic Review, 49(1), 135-185.
Christiano, L. J., and M. Eichenbaum (1992): "Current Real-Business-Cycle Theories and Aggregate Labor-Market Fluctuations," American Economic Review, 82(3), 430-50.
Clark, K. B., and L. H. Summers (1981): "Demographic Differences in Cyclical Employment Variation," The Journal of Human Resources, XVI, 61-79.
Cragg, J. G., and S. G. Donald (1993): "Testing Identifiability and Specification in Instrumental Variable Models," Econometric Theory, 9, 222-240.
Davidson, R., and J. G. MacKinnon (2004): Econometric Theory and Methods. Oxford University Press.
Francis, N., and V. A. Ramey (2008): "Measures of Per Capita Hours and their Implications for the Technology-Hours Debate," Discussion paper, UCSD.
Gomme, P., R. Rogerson, P. Rupert, and R. Wright (2004): "The Business Cycle and the Life Cycle," in NBER Macroeconomics Annual, vol. 19, pp. 415-461.
Hansen, G. D. (1985): "Indivisible labor and the business cycle," Journal of Monetary Economics, 16(3), 309-327.
Hansen, G. D., and S. Imrohoroglu (2008): "Business Cycle Fluctuations and the Life Cycle: How Important is On-The-Job Skill Accumulation?," Discussion paper, UCLA.
Hoynes, H. W. (2000): "Local Labor Markets and Welfare Spells: Do Demand Conditions Matter?," The Review of Economics and Statistics, (3), 351-368.
Katz, L. F., and K. M. Murphy (1992): "Changes in Relative Wages, 1963-1987: Supply and Demand Factors," The Quarterly Journal of Economics, 107(1), 35-78.
King, R. G., and S. T. Rebelo (1999): "Resuscitating real business cycles," in Handbook of Macroeconomics, ed. by J. B. Taylor, and M. Woodford, vol. 1 of Handbook of Macroeconomics, chap. 14, pp. 927-1007. Elsevier.
Krusell, P., L. E. Ohanian, J.-V. Rios-Rull, and G. L. Violante (2000): "Capital-Skill Complementarity and Inequality: A Macroeconomic Analysis," Econometrica, 68(5), 1029-1054.
Kydland, F. E., and E. C. Prescott (1993): "Cyclical movements of the labor input and its implicit real wage," Economic Review, (Q II), 12-23.
Nagypal, E. (2004): "Learning-by-Doing Versus Learning About Match Quality: Can We Tell Them Apart?," Discussion paper, Northwestern University.
Ramey, V. A., and M. D. Shapiro (1998): "Costly Capital Reallocation and the Effects of Government Spending," Carnegie-Rochester Conference Series on Public Policy, 48, 145-194.
Ravn, M. O., and H. Uhlig (2002): "On Adjusting the Hodrick-Prescott Filter for the Frequency of Observations," The Review of Economics and Statistics, 84, 371-380.
Rios-Rull, J.-V. (1996): "Life-Cycle Economies and Aggregate Fluctuations," Review of Economic Studies, 63(3), 465-89.
Rogerson, R. (1988): "Indivisible labor, lotteries and equilibrium," Journal of Monetary Economics, 21(1), 3-16.
Solon, G., R. Barsky, and J. A. Parker (1994): "Measuring the Cyclicality of Real Wages: How Important Is Composition Bias?," The Quarterly Journal of Economics, 109(1), 1-25.
A Appendix
A.1 Hours Variance Decomposition
In this subsection, we provide a decomposition of the volatility of hours worked into its primary components. Our view is that such a decomposition provides preliminary evidence on the relative importance of labor supply and labor demand factors in understanding differences in volatility across age groups. This type of analysis is informative with respect to the structural model we pursue. For example, differences owing to life-cycle considerations would plausibly attribute a greater proportion of the volatility of hours to volatility in labor force participation among some age groups as compared to others. Schooling decisions might be a margin of adjustment which is more relevant for young agents than to those in their prime-age. Similarly, the decision to re-enter or drop out of the labor force over the business cycle might be more relevant for those above the retirement age than others.
Note that hours worked per member of an age group (![]() ) can be written as the following product:
) can be written as the following product:
where ![]() is hours per labor force participant and
is hours per labor force participant and
![]() is labor force participant per age-group
member. Hence, changes in
is labor force participant per age-group
member. Hence, changes in ![]() can be due to
changes in these terms, which we refer to as the "hours margin"
and the "participation margin," respectively. As such we
decompose the variance of hours worked in the following way:
can be due to
changes in these terms, which we refer to as the "hours margin"
and the "participation margin," respectively. As such we
decompose the variance of hours worked in the following way:
| (A.1) |
where ![]() denotes deviations of the log of
denotes deviations of the log of
![]() from its HP-filtered trend, and similarly
for the other variables.32 Our point in decomposing
from its HP-filtered trend, and similarly
for the other variables.32 Our point in decomposing
![]() is to see
how influential is the participation margin, which we do not model,
relative to the hours margin, which we do model.
is to see
how influential is the participation margin, which we do not model,
relative to the hours margin, which we do model.
The goal of simply accounting for the participation margin does not tell us how to attribute the covariance terms in (A.1) and so we do the following. For one set of calculations, we ignore covariance in (A.1). Then the participation margin is simply
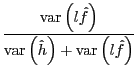 |
We denote these results "covariance not included."
For the other set of calculations, we include covariance.
Moreover, we take a equitable stance towards the participation
margin and attribute to it half of the covariance term including
![]() . Here the participation margin is
. Here the participation margin is
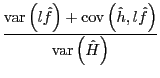 |
using (A.1). We denote these results "covariance included."
As discussed in the text, the picture that emerges here is that the participation margin is less influential than the hours margins we model for all age groups.
A.2 Seniority Rules and Young Workers
We test the potential importance of such institutional features by looking at the relationship between intersectoral unionization rates and age-specific hours worked volatility. Specifically, we assume all labor unions place an emphasis on the concerns of its (employed) members, and either implicitly or explicitly endorse LIFO rules in employment decisions. To the extent that different industries and sectors feature different rates of unionization, we should expect variation in the importance of LIFO effects. To test this, we look at the volatility of young workers' hours worked relative to that of the prime-aged over the cycle. Since seniority is highly-correlated with age, we should expect that the quantitative importance of LIFO rules will obtain in age group comparisons.33
We disaggregate hours worked by age and nine BLS-defined nonfarm "supersectors," which roughly correspond to 1-digit level SIC codes. We obtain unionization rate data from the BLS starting in 1983. In Figure 4, we present the scatterplot of the ratio of cyclical volatility of 15-29 year olds relative to 30-64 year olds to unionization, 1983-2005. The unionization rate measure is the average rate observed over the sample period. This serves as a useful summary statistic since unionization rates have been relatively stable since 1983, and importantly, the ordinal ranking across supersectors has not changed.
We see that there is no evidence that more highly unionized
sectors feature greater relative volatility of the young.
Performing a simple OLS regression obtains an
![]() and a positive slope estimate
that is not close to being statistically significant. As such, we
do not find prima facie evidence for the importance of seniority or
LIFO rules in explaining age differences in hours and employment
volatility.
and a positive slope estimate
that is not close to being statistically significant. As such, we
do not find prima facie evidence for the importance of seniority or
LIFO rules in explaining age differences in hours and employment
volatility.
A.3 Labor Supply Models
As discussed in the introduction, in order to maintain comparability with the literature, we are interested in a model that represents a minimal deviation from the standard RBC model. We begin by analyzing two simple models based on labor supply differences. As expected from the previous discussion, while these models can account for the differences in the cyclicality of age-specific hours, they have counterfactual implications regarding the cyclicality of age-specific wages. We then conclude that within the RBC framework, labor demand differences are crucial for matching differences in the cyclicality of age-specific wages and analyze such a model in the following Section.
Differences in Labor Supply: Model I In the first model we consider we assume that final goods are produced by perfectly competitive firms according to the Cobb-Douglas production function:
Here ![]() is the aggregate labor input in the
economy and it satisfies
is the aggregate labor input in the
economy and it satisfies
That is, the aggregate labor input is the sum of the hours of the
young, ![]() , and the hours of the old,
, and the hours of the old,
![]() . The parameter
. The parameter ![]() allows for a difference in the efficiency of hours supplied between
the young and the old. The rest of the model is identical to the
one we consider in the paper.
allows for a difference in the efficiency of hours supplied between
the young and the old. The rest of the model is identical to the
one we consider in the paper.
In this enviorment we have
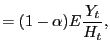 |
(A.2) | |
 |
(A.3) |
From the FOC of the household we get
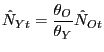
|
(A.4) |
Thus, if
![]() , i.e., the Frisch
labor supply elasticity of the young is higher then that of the old
(recall that the Frisch labor supply elasticity equals
, i.e., the Frisch
labor supply elasticity of the young is higher then that of the old
(recall that the Frisch labor supply elasticity equals
![]() ), then the model can match
), then the model can match
![]() .
However, from (A.2) and (A.3) it follows that by construction the relative volatility of wages equals one in this
model. Thus, this model cannot account for the joint behavior of
age specific hours and age specific relative wages that is observed
in the U.S. data.
.
However, from (A.2) and (A.3) it follows that by construction the relative volatility of wages equals one in this
model. Thus, this model cannot account for the joint behavior of
age specific hours and age specific relative wages that is observed
in the U.S. data.
Differences in Labor Supply: Model II We maintain the same assumptions regarding the households as in the previous. We only vary the production function by postulating the following production function
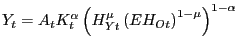 |
Note that in this version we allow for the labor input of the young and the old to differ. However, we assume that both of these inputs have the same elasticity of substitution with capital. Given this production function we get that
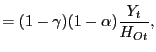 |
(A.5) | |
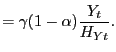 |
(A.6) |
Using the prices determined in (A.5)-(A.6) and the fact
that
![]() and
and
![]() we
get
we
get
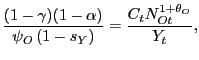
|
(A.7) |
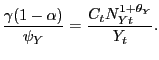
|
(A.8) |
Log-linearizing the ratio of these two equations it follows that
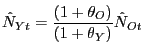
|
(A.9) |
Similarly to the previous model we have considered, the case of
![]() implies the
volatility of hours worked is identical for the young and the old.
The only case in which
implies the
volatility of hours worked is identical for the young and the old.
The only case in which
![]() is
if
is
if
![]() -
i.e.
-
i.e.
![]() However, from the
labor supply equations it follows
However, from the
labor supply equations it follows
and thus
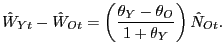 |
Since we are interested in calibrations where
![]() , it follows that
, it follows that
![]() . The immediate
implication is that the fluctuations in the wage of the young are
smaller then the fluctuations in the wage of the old.34
. The immediate
implication is that the fluctuations in the wage of the young are
smaller then the fluctuations in the wage of the old.34
To conclude this section; The two models based on "labor supply" differences can easily match the relative volatility of age specific hours. The first model can also match the relative volatilities of young and old hours to output. However, it is inherent to the models' mechanisms that they have counterfactual implications regarding the volatility of age specific wages. These results lead us to consider a "Labor-Demand" channel.
A.4 Proofs
The method of proof follows the arguments made in the text.
Assume
![]() , so that production exhibits
capital-experience complementarity. The firm's FONCs written in log
deviation form are:
, so that production exhibits
capital-experience complementarity. The firm's FONCs written in log
deviation form are:
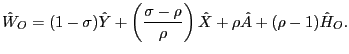 |
Here,
![]() ,
so that:
,
so that:
 |
We have used the fact that ![]() in the
impact period of a shock. Note that
in the
impact period of a shock. Note that ![]() . Hence:
. Hence:
Assuming
![]() , the
household's FONCs in log deviation form are:
, the
household's FONCs in log deviation form are:
so that:
Substituting in the firm's FONCs and simplifying, we obtain:
 |
The first term on the right-hand side of the equality is greater
than one since
![]() . Moreover, since
. Moreover, since ![]() , the second term on the right-hand side is
greater than zero. Hence, capital-experience complementarity
implies that
, the second term on the right-hand side is
greater than zero. Hence, capital-experience complementarity
implies that
![]() in response to a
positive technology shock,
in response to a
positive technology shock, ![]() .
.
A.5 Specification Testing
If we rewrite the production function (4.3)
where ![]() denotes a CES aggregator, we can
see that the three considered specifications are
denotes a CES aggregator, we can
see that the three considered specifications are
which we label according to the pair of variables appearing in the
innermost CES aggregator. From the three first order conditions for
any one of these specifications, we derive estimation equations.
For ![]() these equations are written out as
(5.2) and (5.3); for
these equations are written out as
(5.2) and (5.3); for
![]() the equations are identical except
obviously with
the equations are identical except
obviously with ![]() and
and ![]() subscripts
interchanged. For
subscripts
interchanged. For
![]() we estimate the equations
we estimate the equations
Because the model's only shock drops out of these equations, theoretically we do not need to estimate these equations using instruments; nonetheless, doing so ad hoc does not change the test result.
To understand the Ramsey (1969) test, recall that the
conditional expectation ![]() is a function
is a function
![]() . Therefore we can express the
conditional expectation as a Taylor expansion of
. Therefore we can express the
conditional expectation as a Taylor expansion of ![]() .
Let that expansion be around the linear prediction of
.
Let that expansion be around the linear prediction of ![]() , call it
, call it ![]() ; a linear prediction of the
left-hand side variable is what estimating equations provide. Of
course, the function
; a linear prediction of the
left-hand side variable is what estimating equations provide. Of
course, the function ![]() itself is linear if all its
higher order (second and beyond) derivatives are zero: said another
way,
itself is linear if all its
higher order (second and beyond) derivatives are zero: said another
way, ![]() is not linear if there is a
nonzero coefficient on a higher order expansion term. We look for
evidence of higher order expansion terms by regressing the
residuals on higher powers of the regression fitted values; in
practice one can restrict consideration to low powers of the fitted
values as suggested by Davidson and MacKinnon (2004).
is not linear if there is a
nonzero coefficient on a higher order expansion term. We look for
evidence of higher order expansion terms by regressing the
residuals on higher powers of the regression fitted values; in
practice one can restrict consideration to low powers of the fitted
values as suggested by Davidson and MacKinnon (2004).
For any pair of estimation equations involving regressors
![]() and
and ![]() , we run the
seemingly unrelated regressions of the residuals
, we run the
seemingly unrelated regressions of the residuals ![]() on fitted values and fitted values squared35
on fitted values and fitted values squared35
The specification test of the null hypothesis
![]() has a
has a
![]() distribution and we report this
test statistic and
distribution and we report this
test statistic and ![]() -value in the body of the
paper.
-value in the body of the
paper.
A.6 Data
Data on hours, employment shares, and wages come from the Current Population Survey (CPS) conducted by the Census Bureau. To obtain wage data, we use questions in the March CPS about income obtained in the previous (last) year.36 In order to turn this income data into wage data, we must know how many hours the individual worked last year. The hours for the previous year are constructed as the number of weeks worked last year multiplied by a measure of how many hours-per-week were worked by the individual last year. We follow Krusell, Ohanian, Rios-Rull, and Violante (2000) in imputing the hours-per-week from the data on how many hours the individual worked in the previous (last) week.
Our measure of hours-per-week is different than Krusell, Ohanian, Rios-Rull, and Violante (2000) in the following. We note whether the worker described her work last year as either full-time (FT) or part-time (PT). Her last week's hours are imputed as the hours-per-week only if the value falls within believable values, given that her work last year was either FT or PT. If her previous week's hours are not consistent with FT or PT work, we impute a "disaggregated" group average as the hours-per-week; by contrast, Krusell, Ohanian, Rios-Rull, and Violante (2000) impute a "disaggregated" group average only if the worker reported that she worked last year but worked zero hours last week.
Our " disaggregated" groups are formed by dividing respondents by age, education, gender, and last year's FT/PT status. Given that there are eleven 5-year age bins (15-19,20-24,...,60-64,65+), 5 eduction bins (below HS, HS, some college, college graduate, postgraduate work), 2 genders, and a FT or PT status, there are 220 possible groups. Our " disaggregated" groups combine education bins for some age-gender-FT/PT groups to ensure that for every year in 1964-2006 our " disaggregated" groups each have at least fifty members.37 This is done so that the " disaggregated" group average is not overly reliant on only a few observations.
Conditional on the the other characteristics we consider, we use the information on PT and FT as follows:
- If a person claims to be PT last year and works between 1 and 34 hours last week, we impute their hours-per-week last year as their hours last week; otherwise (they worked 0 or more than 34 hours last week) they are imputed the group average
- If a person claims to be FT last year and works 35 or more hours last week, we impute their hours-per-week last year as their hours last week; otherwise (they worked 0-34 hours last week) they are imputed the group average
Let
![]() be the part of
be the part of ![]() with hours last week that are FT-status-fitting for imputation
purposes (given the FT/PT nature of
with hours last week that are FT-status-fitting for imputation
purposes (given the FT/PT nature of ![]() ), and
), and
![]() be those whose hours last
week are not FT-status-fitting. Let
be those whose hours last
week are not FT-status-fitting. Let ![]() ,
,
![]() ,
, ![]() , and
, and
![]() be worker
be worker ![]() 's hours
last week, number of weeks worked last year, wage and salary income
last year, and CPS Person weight, respectively.38 Then the
measures of group
's hours
last week, number of weeks worked last year, wage and salary income
last year, and CPS Person weight, respectively.38 Then the
measures of group ![]() 's " disaggregated" group
average, weight, hours worked last year, and income last year
are
's " disaggregated" group
average, weight, hours worked last year, and income last year
are
 |
(A.10) |
 |
(A.11) |
 |
(A.12) |
 |
(A.13) |
Let ![]() be a set of
be a set of ![]() s: this
is a larger group, such as all workers in the 15-19 age category,
comprised of smaller "disaggregated" groups. Our construction of
an efficiency wage measure for
s: this
is a larger group, such as all workers in the 15-19 age category,
comprised of smaller "disaggregated" groups. Our construction of
an efficiency wage measure for ![]() is similar to
that of Krusell, Ohanian,
Rios-Rull, and Violante (2000): our efficiency measurement
is similar to
that of Krusell, Ohanian,
Rios-Rull, and Violante (2000): our efficiency measurement ![]() for each
for each ![]() is the average of their wage (
is the average of their wage (
![]() ) for the years
1985-1989.39
) for the years
1985-1989.39
|
(A.14) |
It is worth mentioning that the March CPS has a specific question "On average, how many hours per week did you work last year, when you worked?" starting in 1976. We find that making sure the hours imputation is FT-status-fitting leads to hours measures that are close to the post-1976 question when both are available. By ignoring the FT-status, one underreports the groups' hours.
Our data on hours come directly from the hours last week question. Likewise, our labor force share data comes from a labor force status question pertaining to last week.
We have found that these last week hours have level shifts between the 1967 and 1968 survey years and therefore start our hours series at 1968. The last year information used in the wage series appears unaffected during this time, so we use data going back to the 1964 survey year (data about 1963). The statistics on wages remain virtually identical if we start the wage series at survey year 1968.
Footnotes
1. We thank Manuel Amador, Paul Beaudry, Larry Christiano, Marty Eichenbaum, Valerie Ramey, Sergio Rebelo, Victor Rios-Rull, William Gui Woolston, and numerous workshop participants for helpful comments. Siu thanks the Social Sciences and Humanities Research Council of Canada for financial support. The views in this paper are solely the responsibility of the authors and should not be interpreted as reflecting the views of the Board of Governors of the Federal Reserve System or of any other person associated with the Federal Reserve System. Return to text
2. Stanford University and NBER, [email protected] Return to text
3. Federal Reserve Board of Governors, [email protected] Return to text
4. University of British Columbia, [email protected] Return to text
5. By RBC framework, we are referring to neoclassical models in which households and firms take all prices as given, and interact in competitive spot markets. The papers discussed in the previous paragraph model age differences as owing to labor supply characteristics. See Nagypal (2004) for an alternative approach highlighting the interaction between age and worker-occupation match. Return to text
6. Section 4.4 and Appendix A.3 discusses this in depth. Return to text
7. Through analysis of the transfer function of the HP filter, Ravn and Uhlig (2002) find this to be the optimal value for annual data. Using a similar approach, Burnside (2000) recommends a smoothing parameter value of 6.65. Finally, see Baxter and King (1999), who recommend a value of 10, through visual inspection of the transfer function. Throughout this paper, we have repeated our analysis of annual data using the band-pass filter proposed by Baxter and King (1999), removing fluctuations less frequent than 8 years. The results are essentially identical in all cases. Return to text
8. These results corroborate the findings of Gomme, Rogerson, Rupert, and Wright (2004), and extend them to include data from the 2001 recession. See also clarksu81, Rios-Rull (1996), and Nagypal (2004) who document differences in cyclical sensitivity across age groups. More broadly, the literature documents differences as a function of skill; see for instance, Kydland and Prescott (1993) and Hoynes (2000), and the references therein. Note that those studies are confined to the analysis of U.S. data. Return to text
9. Given the small fraction of teenagers with postsecondary education, we omit them from this analysis. Return to text
10. Gomme, Rogerson, Rupert, and Wright (2004) discuss age differences with further demographic breakdowns (e.g., marital status, industry of occupation) for the U.S. They find that essentially none of the age differences in volatility are due to differences in the distribution of hours worked across industries. This finding (along with our desire to maintain comparability to the standard RBC model) motivates our investigation of a one-sector model in Section 4. Return to text
11. See also Nagypal (2004) who provides an analysis of age group differences during recessionary episodes. Return to text
12. Using weekly wages, as in Katz and Murphy (1992), yields the similar results to the ones we report here for hourly wages. Return to text
13. Finally, we note that this pattern of cyclicality in age-specific wages is robust to further disaggregation by education and gender, but are not presented here for brevity. Return to text
14. Solon, Barsky, and Parker (1994) make the related point on the relative procyclicality of hours and wages between men and women. Return to text
15. For example, young individuals potentially face different trade-offs between market work and other activities (opportunities for educational attainment, home production, and leisure that may not be available to older-aged individuals). Return to text
16. Again, this is calculated as a projection on a constant, current detrended aggregate output, and current and lagged detrended aggregate hours. Return to text
17. The portion of cyclical volatility
for the 60+ year olds is noticeably lower than for filtered
volatility; this comes from the low ![]() of these
business cycle projections for these age groups' labor force
participation decisions. Return to
text
of these
business cycle projections for these age groups' labor force
participation decisions. Return to
text
18. We thank Valerie Ramey for encouraging us to investigate this mechanism. Return to text
19. Francis and Ramey (2008) use a variant of this utility function to study how demographic shifts lead to low frequency movements in hours worked and productivity. Return to text
20. A similar approach is used in Burnside, Eichenbaum, and Rebelo (1995) and the references therein. Return to text
21. The data used in estimation come from
standard sources. Briefly, ![]() ,
, ![]() , and
, and ![]() come from the BEA's NIPA and
Fixed Asset Tables.
come from the BEA's NIPA and
Fixed Asset Tables. ![]() ,
, ![]() ,
, ![]() , and
, and ![]() are
constructed using March CPS data. Because of this, our data
comprise annual observations for the period 1968 - 2005. See
Appendix A.6 for a detailed discussion of the data construction. Return to text
are
constructed using March CPS data. Because of this, our data
comprise annual observations for the period 1968 - 2005. See
Appendix A.6 for a detailed discussion of the data construction. Return to text
22. We see this as a virtue since our goal is not to claim that labor supply characteristics are indeed identical across the young and old, as maintained in our benchmark calibration. Instead, or goal is to isolate the quantitative role of differences in the cyclical demand for young and old labor. Return to text
23. The estimates of ![]() and
and ![]() are identical if we use real
government defense spending instead of the Ramey and
Shapiro (1998) dates.
Similarly, instrumenting only with lagged birth rates does not
alter our estimates. Return to
text
are identical if we use real
government defense spending instead of the Ramey and
Shapiro (1998) dates.
Similarly, instrumenting only with lagged birth rates does not
alter our estimates. Return to
text
24. See also Beaudry and Green (2003) who use exogenous demographic variation as an instrument in production function estimation. Return to text
25. Based on the autocorrelations of the residuals, we allow four lags in the kernel. Return to text
26. More informally, ![]() s from the first-stage regressions are 0.67, 0.42, and
0.18 for
s from the first-stage regressions are 0.67, 0.42, and
0.18 for
![]() ,
,
![]() , and
, and
![]() , respectively. Return to text
, respectively. Return to text
27. For each of these different specifications we change the regressors and instruments accordingly. Return to text
28. The standard RBC model's
specification is a special case of this, where
![]() is a linear function (so that
young and old labor are perfect substitutes) and
is a linear function (so that
young and old labor are perfect substitutes) and
![]() is Cobb-Douglas. Return to text
is Cobb-Douglas. Return to text
29. We are calibrating a quarterly model, however up to now we have dealt with annual data measures. The reason for this is that quarterly data on age-specific hours do not begin until 1976. We do have semiannual data on age-specific hours from 1968-2005 (constructed by the authors from the March CPS and the October CPS surveys held by NBER). From this data we see that the relevant time series display the same volatilities relative to output. Likewise, the relative volatilities of young and old hours are the same in both the annual and semiannual time series. We conclude that for these relationships the frequency of observation does not alter our results. Return to text
30. See for example, Hansen (1985), Rogerson (1988), King and Rebelo (1999). Return to text
31. Note that we are reporting the volatility for cyclical fluctuations in real wages, as constructed in Section 3.1. As previously shown, a significant portion of high frequency wage variation is not correlated with the cycle. Given the focus on business cyle fluctuations in hours and wages, we concentrate on the variation in wages that is due to the cycle. Return to text
32. See Hansen (1985) for a similar decomposition. Return to text
33. Note that we implicitly assume that the unionization rate is exogenous to the relative volatility between the young and prime-aged workers. We do not assume that it is exogenous to the level of total volatility of the sector. Return to text
34. This is true as long as the two wages correlate positively. Return to text
35. Higher powers of the fitted values produce similar results and the same test results. Return to text
36. As noted below, a specific question reporting wages only appears in the CPS survey starting in 1982. Return to text
37. Additionally cutting by race (white/nonwhite) does not change matters much. Return to text
38. In the March supplement, we have both a CPS Basic Person weight, and a CPS Supplemental Person weight. Personnel at the Census Bureau have advised us to use the latter for all the data questions we are addressing, even though some of these data are not part of the March Annual Supplement. Return to text
39. Krusell, Ohanian, Rios-Rull, and Violante (2000) use the wage in 1980 as the efficiency measurement. We use an average of the wage to allow for the possibility that the efficiency measure varies over the cycle. Hence, by averaging over five years we aim to smooth the efficiency measurement. The results remain the same using either efficiency measurement. Return to text
This version is optimized for use by screen readers. Descriptions for all mathematical expressions are provided in LaTex format. A printable pdf version is available. Return to text