Monetary Policy Report submitted to the Congress on July 20, 2004, pursuant to section 2B of the Federal Reserve Act


Section 2

ECONOMIC AND FINANCIAL DEVELOPMENTS IN 2004

After having surged in the second half of 2003, economic activity continued to expand at a solid pace in the first half of 2004. In the labor market, payroll employment started to increase last fall after a long string of declines and picked up further during the first half of this year. Headline inflation has been boosted significantly by the jump in energy prices this year, but core inflation has also moved up from the exceptionally low levels of late 2003.
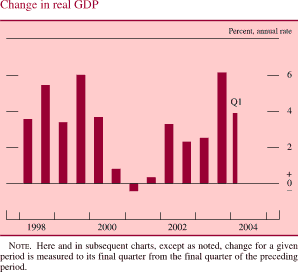
Change in real GDP. Percent, annual rate. Bar chart. Date range is 1998 to Q1 2004. Change in real GDP begins at about 3.8 percent; it then increases to about 5.6 percent in the second half of 1998. Then it decreases to about 3.7 percent in early 1999. In the second half of 1999 it increases to about 6 percent. In the first half of 2002 it decreases to about negative 3 percent and then it increases and ends at about 3.9 percent. NOTE. Here and in subsequent charts, except as noted, change for a given period is measured to its final quarter from the final quarter of the preceding period.

The Household Sector

Consumer Spending

Consumer spending, which had gathered a good bit of steam in the second half of 2003, continued to move higher in the first half of 2004. The growth in spending was spurred by substantial gains in income. In addition, household wealth has risen sharply over the past year, and consumer surveys indicate that individuals are generally upbeat in their assessments of the economy's prospects and of their own situations.

Personal consumption expenditures rose at an annual rate of 3-3/4 percent in real terms in the first quarter. Spending on light motor vehicles, which had been supported in late 2003 by aggressive price and financing incentives, slipped somewhat in early 2004. But outlays for goods other than motor vehicles, which had risen 6-1/2 percent in real terms in 2003, posted another huge increase in the first quarter; spending on services also perked up after having advanced only modestly in 2003. The available data point to a much smaller increase in consumer spending in the second quarter; the deceleration mainly reflects a sharp slowing in the growth of outlays on goods other than motor vehicles.
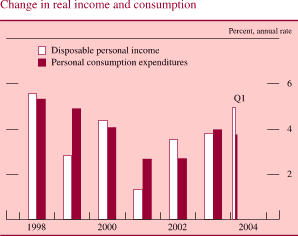
Change in real income and consumption. Percent, annual rate. Bar chart. There are two series (Disposable personal income and Personal consumption expenditures). Date range is 1998 to Q1 2004. As shown in the figure, disposable personal income begins at about 5.6 percent, then it decreases to about 3.8 percent in 1999. In 2000 it increases to about 4.2 percent, then it decreases to about 1.3 percent in 2001. It then increases and ends at about 4.9 percent. Personal consumption expenditures begins at about 5.5 percent, then it decreases to 2.3 percent in 2002. Then it increases and ends at about 3.8 percent.

Real disposable personal income (DPI)--that is, after-tax income adjusted for inflation--rose at an annual rate of nearly 4 percent between the fourth quarter of 2003 and May 2004, a gain about in line with its rate of growth last year. To be sure, the rise in energy prices cut into the growth of real income in the first half of the year. However, aggregate wages and salaries, boosted by increases in both employment and earnings, rose appreciably in nominal terms. In addition, last year's tax legislation, which had already reduced withholding rates in mid-2003, added further to households' cash flow by increasing refunds and lowering final settlements this spring.

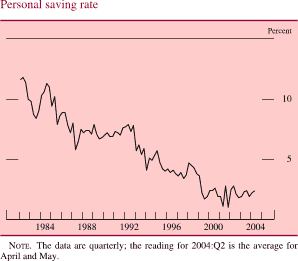
Household wealth increased only about in line with nominal DPI in the first quarter of 2004, and the wealth-to-income ratio was likely little changed in the second quarter as well. Nonetheless, the increase in wealth over the past year has been considerable--and probably large enough to more or less offset any lingering restraint on spending growth from the earlier declines in stock prices. Thus, with wealth approximately a neutral influence on the growth of spending of late, the personal saving rate has held fairly steady. In fact, the average saving rate over the first five months of the year--at 2-1/4 percent of DPI--was very close to the annual figures for 2002 and 2003.

Wealth-to-income ratio. Ratio. Line chart. Date range is 1982 to 2004. As shown in the figure, series begins at about 4.3. During 1983-1994 it fluctuates within the range of about 4.2 to about 4.9. It generally increases to about 6.3 in 2000, then it decreases and ends at about 5.4. NOTE. The data are quarterly and extend through 2004:Q1. The wealth-to-income ratio is the ratio of household net worth to disposable personal income.

Personal saving rate. By percent. Line chart. Date range is 1981 to 2004. As shown in the figure, series begins at about 11.5 percent, then it generally decreases to about 8 percent in 1983, then it increases to about 11 percent in 1984. Then decreases and ends at about 2.5 percent. NOTE. The data are quarterly; the reading for 2004:Q2 is the average for April and May.

Residential Investment

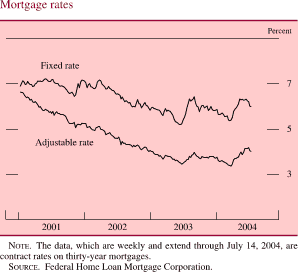
Activity in the housing sector remained torrid in the first half of 2004. Although starts in the single-family sector faltered a bit early in the year, in part because of unusually adverse weather, they subsequently snapped back and reached an annual rate of more than 1.6 million units in April and May--8-1/2 percent greater than the already rapid pace for 2003 as a whole. Sales of new and existing homes have also been exceptionally strong, and they hit record highs in May. In general, housing activity has been supported by the favorable developments regarding jobs and income and, especially early in the year, by low mortgage rates. Rates on thirty-year fixed-rate mortgages, which had dipped to 5-1/2 percent in March, rose markedly in the spring; they have edged down in recent weeks and now stand at 6 percent, a level still quite low by historical standards.
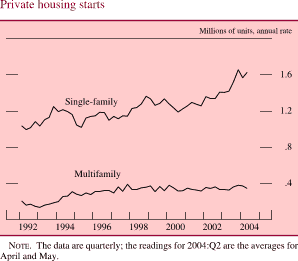
Private housing starts. Millions of units, annual rate. Line chart. There are two series (Single-family and Multifamily). Date range is 1992-2004. As shown in the figure, single-family begins at about 1. From 1992 through 2000 it fluctuates within the range of about 1 percent and about 1.4. Then it increases and ends at about 1.65. Multifamily begins at about 0.2 in early 1991, it than increases to end at about 0.39. NOTE. The data are quarterly; the readings for 2004:Q2 are the averages for April and May.

Mortgage rates. Line chart. By Percent. There are two series (Fixed rate and Adjustable rate). Date range is 2001 to 2004. As shown in the figure Fixed rate begins at about 7 percent, then it decreases to about 5.1 percent in 2003 and then it generally increases to about 6.5 percent by the end of 2003. It ends at about 6 percent. Adjustable rate begins at about 6.8 percent, then it decreases to about 3.3 percent in 2003. Then it increases to end at about 3.5 percent. NOTE. The data, which are weekly and extend through July 14, 2004, are contract rates on thirty-year mortgages. SOURCE. Federal Home Loan Mortgage Corporation.

Home prices have continued to rise rapidly. For example, the national repeat-sales price index from the Office of Federal Housing Enterprise Oversight--which partially adjusts for shifts in the quality of homes sold--rose 7-3/4 percent over the year ending in the first quarter (the latest available data), a rate similar to the average annual gain since late 2000. By this measure--and many others--house price increases have outstripped gains in incomes as well as in rents in recent years.

Starts in the multifamily sector averaged an annual rate of 360,000 units over the first five months of the year, a pace slightly faster than that of the past several years. Low interest rates have apparently helped maintain the profitability of apartment construction, given that other fundamental determinants of activity in the sector have been weak: In particular, rents have remained soft, and in the first quarter, vacancy rates for multifamily rental properties reached a new high.

Household Finance

Household debt rose at an annual rate of about 10-3/4 percent in the first quarter of 2004. The especially rapid growth of mortgage debt was driven by the strong pace of activity in the housing market and the renewed wave of mortgage refinancing. However, the second-quarter rise in interest rates appears to have slowed the rate of refinancing and, consequently, the amount of equity being extracted from the value of homes through such transactions. Consumer credit--which constitutes the bulk of household debt aside from mortgage borrowing--expanded at an annual rate of about 6 percent over the first quarter of the year and at roughly a 4 percent pace in April and May. The growth of consumer credit likely has continued to be restrained by the substitution toward mortgage debt as a means to finance household expenditures.
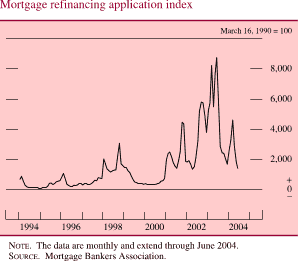
Mortgage refinancing application index. March 16, 1990 = 100. Line chat. Date range is 1994-2004. Series begins at about 700 in early 1994. From 1994 to 2001 it within the range of between 0 and 3,000. In 2003 it generally increases to about 8,400 in 2003. Then it decreases to end at about 1,800. NOTE. The data are monthly and extend through June 2004. SOURCE. Mortgage Bankers Association.

Low interest rates, in concert with strong growth in disposable personal income, have helped to keep financial obligations manageable for most households. In the first quarter of the year, the debt service ratio and the financial obligations ratio for the household sector in the aggregate, both of which gauge pre-committed expenditures relative to disposable income, continued to edge down from their peaks in 2001. Other indicators also suggest that the financial well-being of households has stabilized and may be improving. Delinquencies on credit card and auto loans generally declined in the first three months of the year, and bankruptcy rates, while still high, stepped down in the first quarter from their recent peak.

Household financial obligations ratio. By Percent. Line chart. Date range is 1991 to 2004. Series begins at about 17.5 percent, then it deceases 16.1 percent in 1993. From 1994-2001 it increases to about 18.5 percent. Then it decreases and ends at about 18 percent. NOTE. The data are quarterly and extend through 2004:Q1. The financial obligations ratio equals the sum of required payments on mortgage and consumer debt, automobile leases, rent on tenant-occupied property, homeowners’ insurance, and property taxes, all divided by disposable personal income.

Delinquency rates on selected types of household loans. By Percent. Line chart. There are three series (Mortgages, Credit card pools and Auto loans at domestic auto finance companies). Date range is 1992 to 2004. All series start in early 1992. As shown in the figure, mortgages begin at about 1.6 percent, then it fluctuates but stays at about 1.6 percent by the end. Credit card pools begin at about 6 percent, then it decreases to about 4 percent in 1995. Then it increases to about 5.25 in 1997. In 2000 it decreases to about 4.5 percent. The series ends at about 4.75 percent. An auto loan at domestic auto finance companies begins at about 2.6 percent, then it increases to about 3.5 percent in 1997. It decreases to end at about 2 percent. NOTE. The data are quarterly and extend through 2004:Q1. SOURCE. For mortgages, the Mortgage Bankers Association; for auto loans, the Big Three automakers; for credit cards, Moody’s Investors Service.

Rapid increases in home prices have continued to buoy household net worth this year. In contrast, stock prices are about unchanged. Although news on earnings and economic activity has generally been favorable, rising oil prices and interest rates and, perhaps, heightened geopolitical concerns have weighed on investor sentiment. Nevertheless, inflows into equity mutual funds have been even stronger thus far in 2004 than they were last year.

The Business Sector

Fixed Investment

For the most part, businesses appear to be shaking off the extraordinary reluctance to undertake new investment projects that was evident in 2002 and 2003. Indeed, although outlays on nonresidential construction have not yet turned up decisively, real spending on equipment and software (E&S) has been advancing briskly. The broadly based growth in E&S spending has been driven by increasingly favorable fundamentals: positive expectations for sales, high levels of corporate profits and cash flow, a desire to replace or upgrade aging equipment after a period of weak investment spending, and the continued low cost of capital.

Real E&S spending rose at an annual rate of more than 15 percent in the second half of last year, and it posted another sizable increase in the first quarter of 2004 despite flat business purchases of motor vehicles and a dip in deliveries of aircraft. Excluding transportation equipment, real spending on E&S rose at an annual rate of 13-1/2 percent in the first quarter. In the high-tech category, real purchases of computers and software remained on the solid uptrend that has been evident for the past couple of years, and real outlays on communications equipment increased further, reaching a level about 20 percent above the low in the fourth quarter of 2002. Spending for equipment other than high-tech and transportation, which accounts for about 40 percent of E&S (measured in nominal terms), also rose markedly in the first quarter. Such spending tends to be particularly sensitive to the prospects for aggregate demand. In addition, it may be receiving a lift from the partial-expensing tax provision, which is especially valuable for equipment with relatively long service lives for tax purposes; that provision is slated to expire at the end of 2004.

Change in real business fixed investment. Percent, annual rate. Bar chart. There are four series (Structures, Equipment and software and High-tech equipment and software, Other equipment excluding transportation). Date range is 1998 to Q1 2004. Structures begin at about 4 percent, then it decreases to about negative 1 percent in 1999. In 2000 it increases to about 9 percent and then it decreases to about negative 15 percent in 2002.Series ends at about negative 7 percent. Equipment and software begins at about 14 percent, then it decreases to about negative 8 percent in 2001. Then it generally increases and ends at about 9 percent. High-tech equipment begins at about 25 percent, then it decreases to about negative 11 percent in 2001. Then it increases to end at about 15 percent. Other equipment excluding transportation starts at about 2 percent, then it increases to about 4 percent in 2000. Series generally decreases to about negative 10 percent in 2001, then it increases to end at about 13 percent. NOTE. High-tech equipment consists of computers and peripheral equipment and communications equipment.

Equipment spending appears to have posted another solid increase in the second quarter. Outlays on transportation equipment seem to have rebounded, and the incoming data on high-tech equipment point to robust real expenditures. Some indicators for spending on other nontransportation equipment have been a bit soft recently. But the May level of shipments for this broad category was still above that of the first quarter, and backlogs of unfilled orders, which have risen impressively over the past year, continued to build.

Real nonresidential construction has remained about unchanged, on net, since the steep decline in 2001 and 2002. Construction of office buildings is still running at roughly half the pace of 2000, although vacancy rates have stabilized--albeit at very high levels--and the decline in rents has slowed. Factory construction also remains sluggish. Construction of retail and wholesale facilities, in contrast, has held up fairly well, a performance consistent with the strength in consumer spending. Outlays on buildings for health care and education also have been reasonably well sustained.

Inventory Investment

Inventory investment has generally remained subdued even as final sales have strengthened. Although real nonfarm inventory investment picked up to an annual rate of $30 billion in the first quarter, the accumulation occurred almost entirely in the motor vehicle sector, in which sagging sales and a high level of production early in the year created a noticeable bulge in dealer stocks, especially of light trucks. In the second quarter, the automakers reduced assemblies; but with sales running only a little above their first-quarter pace on average, inventories of motor vehicles remained elevated. Outside the motor vehicle industry, nonfarm inventories increased at a meager $6 billion annual rate in real terms in the first quarter, and the available data point to only a moderate step-up in real stockbuilding, on balance, in April and May. In general, non-auto inventories appear lean relative to sales, even after factoring in the downward trend in inventory-sales ratios that has accompanied the ongoing improvements in supply-chain and logistics management.

Corporate Profits and Business Finance

Continuing the gains of last year, profits of the business sector to date have remained strong. In the first quarter of 2004, earnings per share for S&P 500 firms were about 26 percent higher than their level four quarters earlier, and before-tax profits of nonfinancial corporations as a share of GDP from that sector edged up following a steep increase in 2003. A jump in profits in the petroleum and gas industries owing to higher oil prices was responsible for much of the rise in earnings. However, firms across many industries, with the notable exception of telecommunication services, registered solid gains in earnings. In response to this pattern of higher profits, analysts have been steadily marking up their forecasts for earnings in subsequent quarters.
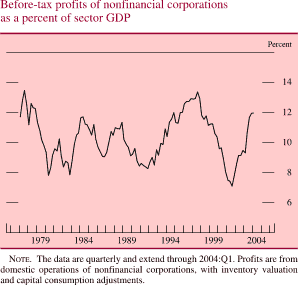
Before-tax profits of nonfinancial corporations as a percent of sector GDP. Line chart. By percent. Date range is 1977-2004. As shown in the figure, the series begins at about 11.7 percent in the beginning of 1977. It increases to about 12.5 percent in early 1978. Then it generally decreases to about 8 percent in 1980. From 1981 through 1997 it fluctuates within the range of about 7.9 and about 13.3 percent. It generally decreases to about 7 percent in 2001. Then it increases and ends at about 12 percent. NOTE. The data are quarterly and extend through 2004:Q1. Profits are from domestic operations of nonfinancial corporations, with inventory valuation and capital consumption adjustments.

Net equity issuance has remained negative this year. Seasoned offerings have been scarce, the pace of initial public offerings has only inched up, and share retirements have continued to be strong. Corporations have continued to repurchase shares at a rapid rate to manage their cash positions, even as they have increased dividend payments.

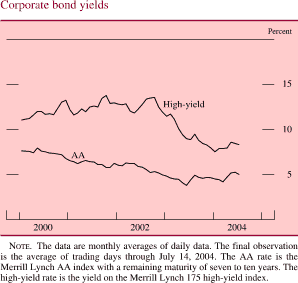
Firms relied heavily on their elevated profits and substantial cash holdings to finance their investment in inventories and fixed capital in the first half of 2004. As a result, the growth of nonfinancial business debt remained modest. Much of the proceeds from bond issuance was used to pay down higher-cost debt, and the timing of the issuance of investment-grade bonds in particular was influenced by movements in interest rates; issuance spiked in March in the wake of the drop in yields but subsided in April as rates rebounded. Short-term debt financing showed signs of turning around after contracting over the previous three years. Commercial paper outstanding expanded in the first two quarters of 2004. Business loans at banks have fallen on balance so far this year but at a much slower pace than in 2003. The Federal Reserve's Senior Loan Officer Opinion Survey conducted in April 2004 indicated that demand for business loans had begun to expand and that commercial banks had again eased both standards and terms on these loans over the previous three months.

Major components of net business financing. Billions of dollars. Bar chart. There are three series (Commercial paper, Bonds and Bank loans) and one line’ Sum of major components’. Date range is 2002 to 2004. Bank loans begins at about negative $50 billion in 2002. From Q1 2003-Q1 2004 it fluctuates but stays at about negative $50 billion. It ends at about negative $10 billion in Q2 2004. Bonds begin at about $150 billion in 2002. Then it decreases to about $40 billion in the second half of 2002. In Q2 2003 it increases to about $300 billion, then it increases to about $250 billion in the first half of 2003. Then it decreases to end at about $100 billion in Q1 2004. Commercial paper begins at about negative $90 billion in 2002. In Q3 2003 it generally increases to about $10 billion. Then it decreases to about negative $90 billion. Then series increases by the end at about $40 billion in Q2 2004. ‘Sum of major components’ begins at about $60 billion in early 2002, then it decreases to about negative $100 billion in the middle of 2002. In the middle of 2003 it generally increases to about $180 billion and then decreases to about negative $40 billion. It then increases to about $100 billion in Q1 2004. Series ends at about $20 billion in Q2 2004. NOTE. Seasonally adjusted annual rate for nonfinancial corporate business. The data for the sum of major components are quarterly. The data for 2004:Q2 are estimated.

Corporate bond yields. By percent. Line chart. There are two series (High yield and AA). Date range is 2000 to 2004. High yield starts at about 11.5 percent in early 2000. From 2000-2002 it fluctuates within the range of about 11.5 percent and about 13.5 percent. Then it decreases to end at about 8 percent. AA begins at about 7.5 percent and during Q2 2000-2004 increases to end at about 5 percent. NOTE. The data are monthly averages of daily data. The final observation is the average of trading days through July 14, 2004. The AA rate is the Merrill Lynch AA index with a remaining maturity of seven to ten years. The high-yield rate is the yield on the Merrill Lynch 175 high-yield index.

Net percentage of domestic banks tightening standards on commercial and industrial loans to large and medium-sized firms. By percent. Line chart. Date range is 1990-2004. Series begins at about 59 percent, then it generally decreases to about negative 20 percent. From 1994-1998 it increases to about 38 percent, then it decreases to about 6 percent in 1999. In 2001 it generally increases to about 60 percent, then it generally decreases to end at about negative 22 percent. NOTE. The data are based on a survey generally conducted four times per year; the last reading is from the April 2004 survey. Large and medium-sized firms are those with annual sales of $50 million or more. Net percentage is the percentage reporting a tightening less the percentage reporting an easing. SOURCE. Federal Reserve, Senior Loan Officer Opinion Survey on Bank Lending Practices.

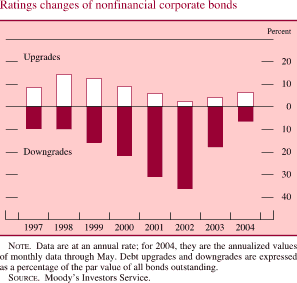
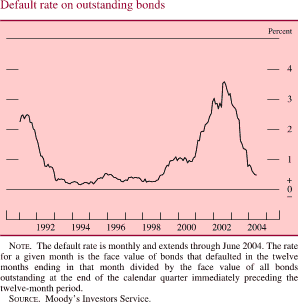
Strong profits, low interest rates, and continued deleveraging helped improve the credit quality of nonfinancial firms over the first half of the year. In the second quarter, the delinquency rate on business loans dropped for the sixth consecutive quarter; the continued decline has reversed a large part of the preceding run-up. Early in the year the twelve-month trailing default rate on outstanding bonds fell into the relatively low range observed over much of the 1990s, and in June it registered another decline. Moreover, in the first part of the year, the pace of upgrades of bond ratings by Moody's Investors Service rose while the pace of downgrades fell.

Delinquency rates on selected types of loans at banks. By percent. Line chart. There are three lines (Commercial and industrial, Consumer and Residential real estate). Date range is 1991-2004. Commercial and industrial begins at about 6 percent, then it decreases to about 1.6 percent in 1998. In 2002 it increases to about 4 percent, then generally decreases to end at about 2.5 percent. Residential real estate begins at about 3.2 percent; during 1992-2002 it decreases to end at about 1.7 percent. Consumer begins at about 4 percent, then it decreases to about 2.8 percent in 1994. During 1995-2002 it increases to end at about 3.2 percent. NOTE. The data, from bank Call Reports, are quarterly, are seasonally adjusted, and extend through 2004:Q1.

Default rate on outstanding bonds. By percent. Line chart. Date range is 1991 to 2004. The series begins at about 2.3 percent in early 1991. In 1993 it generally decreases to about 0.2 percent. During 1994-1998 it fluctuates but stays at about 0.3 percent, then it generally increases to about 3.7 percent in 2002. Then it generally decreases to end at about 0.4 percent. NOTE. The default rate is monthly and extends through June 2004. The rate for a given month is the face value of bonds that defaulted in the twelve months ending in that month divided by the face value of all bonds outstanding at the end of the calendar quarter immediately preceding the twelve-month period. SOURCE. Moody’s Investors Service.

Ratings changes of nonfinancial corporations. By percent. Bar chart. There are two series (Upgrades and Downgrades). Date range is 1997 to 2004. Upgrades begin at about 8 percent, then it increases to about 14 percent in 1998. Then it decreases to about 3 percent in 2002 and then it increases to end at about 6 percent. Downgrades begin at about negative 10, then it decreases to about negative 37 in 2002. Then it increases and ands at about negative 8 percent. NOTE. Data are at an annual rate; for 2004, they are the annualized values of monthly data through May. Debt upgrades and downgrades are expressed as a percentage of the par value of all bonds outstanding. SOURCE. Moody’s Investors Service.

Borrowing against commercial real estate assets continued at a rapid pace during the first half of this year. Anecdotal reports suggest that some firms were using mortgages on commercial property to lock in low-cost, long-term funding. Despite the persistently high vacancy rates for most types of commercial property, the loans backed by these assets have continued to perform well. Delinquency rates on commercial mortgages held by banks and insurance companies remained very low in the first quarter. A drop in delinquencies on commercial-mortgage-backed securities (CMBS) in recent months has partially reversed last year's rise, and the narrow risk spreads on CMBS suggest that investors have limited concerns about loan quality.

The Government Sector

Federal Government

The deficit in the federal unified budget has continued to widen. Over the twelve months ending in June, the unified budget recorded a deficit of $431 billion, $120 billion more than during the comparable period last year and equal to nearly 4 percent of nominal GDP. In large part, the rise in the deficit is attributable to further rapid increases in spending on defense and other programs and the loss of revenues resulting from the tax legislation enacted in recent years. In addition, interest costs, which fell sharply between fiscal 1997 and fiscal 2003 as a result of budget surpluses and declining interest rates, have leveled off and thus are no longer a significant factor helping to restrain the deficit. The primary deficit, which excludes net interest, totaled $276 billion over the twelve months ending in June, also approximately $120 billion more than over the year ending in June 2003.

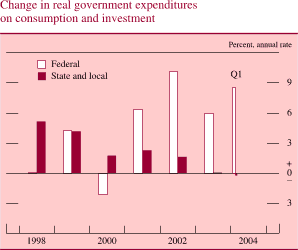
Over the twelve months ending in June, nominal federal spending was nearly 7 percent higher than during the same period a year earlier and stood at about 20 percent of nominal GDP--virtually the same as in fiscal 2003 but 1-1/2 percentage points above the recent low in fiscal 2000. Spurred by the war in Iraq, defense spending ramped up another 14 percent; outlays for nondefense discretionary programs, which include homeland security, moved up further as well. Spending on the major health programs rose at a rapid clip, in part because the Jobs and Growth Tax Relief Reconciliation Act of 2003 (JGTRRA) temporarily increased grants to the states under the Medicaid program and boosted payments to some Medicare providers. In addition, as noted, net interest payments, which had plummeted between 1997 and 2003, flattened out. Real federal expenditures for consumption and gross investment--the part of government spending that is a component of real GDP--rose at an annual rate of 8-1/2 percent in the first calendar quarter of 2004; that increase reflected a surge in real defense spending, which now stands more than 30 percent above the levels that prevailed, on average, from 1997 to 2000.
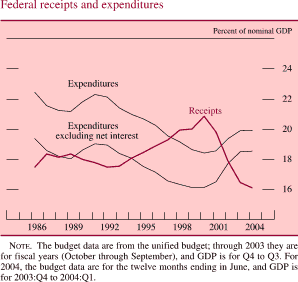
Federal receipts and expenditures. By percent of nominal GDP. line chart. There are three series (Expenditures, Receipts and Expenditures excluding net interest). Date range is 1985 to 2004. Expenditures and Expenditures excluding net interest generally moving together with Expenditures excluding net interest being about 3 percent lower. Expenditures begin at about 22.5 percent in early 1985 and Receipts and Expenditures excluding net interest begins at about 19.5 percent. Then during 1986-1999 they generally decrease. Expenditures to about 18.5 percent and Expenditures excluding net interest to about 16 percent. Expenditures end at about 20 percent and Expenditures excluding net interest ends at about 18.5 percent. Receipts begin at about 17.5 percent. From 1985 to 2001 it increases to about 21 percent, then it generally decreases and ends at about 16 percent. NOTE. The budget data are from the unified budget; through 2003 they are for fiscal years (October through September), and GDP is for Q4 to Q3. For 2004, the budget data are for the twelve months ending in June, and GDP is for 2003:Q4 to 2004:Q1.

Change in real government expenditures on consumption and investment. Bar chart. Percent, annual rate. There are two series (Federal and State and local). Date range is 1998 to Q1 2004. Federal begins at about 1 percent. In 2000 it decreases to about negative 2 percent. In 2002 increases to about 10 percent. It ends at about 8 percent. State and local begins at about 5 percentThen it generally decreases by the end to about negative 0.5 percent.

Federal receipts in the twelve months ending in June were 1-1/2 percent higher than during the comparable period of the previous year after having fallen markedly between fiscal 2000 and fiscal 2003. Receipts received a substantial boost over the past year from a strong gain in corporate taxes, which were lifted by robust profits. Social insurance taxes, which tend to move in line with wages and salaries, also increased. But individual income taxes were below last year's level: Although taxable incomes rose moderately, collections were reduced by the lower withholding rates in place since mid-2003 and by the effects of JGTRRA on refunds and final settlements this spring.

The deterioration in the unified budget since 2000 has been mirrored in a sharp downswing in federal saving--essentially, the unified surplus or deficit adjusted to conform to the accounting practices followed in the national income and product accounts (NIPA). Gross federal saving fell from a high of nearly 3 percent of nominal GDP in 2000 to negative 3 percent of GDP in the first quarter of 2004; measured net of estimated depreciation, federal saving fell from 2 percent of GDP to negative 4 percent of GDP over this period. In the past couple of years, the rise in business saving from the rebound in profits and reductions in corporate taxes has cushioned to some extent the effect of growing budget deficits on national saving. In fact, because of the dramatic increase in business saving in recent quarters, national saving has recovered some from the extreme lows of early 2003. Even so, as of the first quarter of 2004, national saving (measured net of estimated depreciation) was still equal to just about 2-1/2 percent of GDP, compared with a recent high of 6-1/2 percent in 1998. If not reversed over the longer haul, such low levels of national saving could eventually impinge on private capital formation and thus slow the rise of living standards.
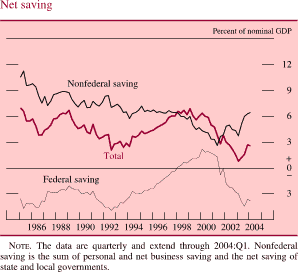
Net saving. By percent of nominal GDP. line chart. There are three series (Nonfederal saving, Total and Federal saving). Date range is 1985 to 2004. All series start in early 1994. Nonfederal saving and Total generally moving together with Total being about 4 percent lower. Nonfederal saving begins at about 10.5 percent, then it generally decreases to about 7 percent in 1986. Total begins at about 7 percent, then it generally decreases to about 3 percent in 1986. From 1987 to 1997 they fluctuate within the range of about 9 and about 2 percent, with total being about 4 percent lower. In 1998 they split. Total decreases to end at about 3 percent. Nonfederal saving decreases to about 2.8 percent in 2001, then increases to end at about 6.2 percent. Federal saving begins at about negative 3.2 percent, then it increases to about 2.7 percent in 2000, then it decreases to end at about negative 4 percent. NOTE. The data are quarterly and extend through 2004:Q1. Nonfederal saving is the sum of personal and net business saving and the net saving of 1998 2000 2002 2004 state and local governments.

Reflecting the need to finance the sizable federal budget deficit, federal debt held by the public expanded at an annual rate of 11-3/4 percent in the first half of the year. The ratio of this debt to nominal GDP now exceeds 36 percent. The Treasury tilted its issuance toward longer-term and inflation-indexed securities somewhat, and announced semiannual issuance of a twenty-year inflation-protected bond beginning in July and a five-year inflation-protected note beginning in October.

Federal government debt held by the public. By Percent of nominal GDP. Line chart. Date range of 1963 to 2004. As shown in the figure, the series begins at about 40 percent in early 1963. In 1974 it decreases to about 23 percent. In 1994 it increases to about 50 percent, then it decreases and ends at about 36 percent. NOTE. Through 2003, the data for debt are year-end figures, and the corresponding value for GDP is for Q4 at an annual rate; the final observation is for 2004:Q1. Excludes securities held as investments of federal government accounts.

State and Local Governments

States and localities have started to see some improvement in their budget positions after having gone through several difficult years. Strong growth in household income and consumer spending has boosted revenues in recent quarters, as have the additional federal grants authorized under JGTRRA. And although rising medical costs and security needs have continued to put upward pressure on spending, state and local governments have generally held the line on hiring and have kept other outlays in check. The restraint on spending, in combination with a drawdown of reserve funds and some increases in taxes, has helped states and localities satisfy their balanced-budget requirements. In fact, between the third quarter of 2003 and the first quarter of 2004, NIPA net saving (excluding social insurance funds) for this sector averaged $21 billion at an annual rate (1/4 percent of nominal GDP), compared with negative $7 billion in 2002 and negative $31 billion in the first half of 2003. (Net saving is roughly similar to the surplus or deficit in an operating budget.) Although a few states are still struggling with strained fiscal situations, most have entered fiscal 2005 (which started on July 1 in all but four states) with expectations of respectable growth in revenues and with budgets in place that allow for some increases in spending on high-priority services and some rebuilding of reserve funds.
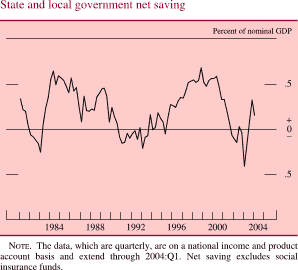
State and local government net saving. By percent of GDP. line chart. Date range is 1981 to 2004. As shown in the figure, the series begins at about 0.4 percent in early 1981. In 1983 it generally decreases to about negative 0.25 percent. In 1984 it generally increases to about 0.65 percent. During 1995-1993 it decreases to about negative 0. 2 percent. In 1998 it increases to about 0.7 percent. Then it decreases to about negative 0.4 percent in 2003. Series ends at about 0.2 percent. NOTE. The data, which are quarterly, are on a national income and product account basis and extend through 2004:Q1. Net saving excludes social insurance funds.

Real consumption and investment spending by state and local governments was essentially flat in the first quarter of 2004; available indicators point to a moderate increase in the second quarter. Outlays for consumption items, which were little changed in 2003, appear to have remained subdued throughout the first half of the year. Investment expenditures also were about unchanged in the first quarter, but they turned up sharply in the spring, mainly because of a jump in spending on highways.

Significant demand for infrastructure spending and favorable interest rates led to robust issuance of state and local government debt to finance capital expenditures and to advance refund higher-cost debt. Nevertheless, over the first half of the year, net issuance edged down from its rapid pace in 2003 to about a 6 percent annual rate. The deceleration reflected a decline in short-term borrowing as improvements in the fiscal positions of state and local governments lessened the need for temporary funding of budget shortfalls.

The credit quality of municipal borrowers has stabilized after two years of deterioration; for the year to date, upgrades and downgrades of credit ratings have been roughly equal. In a marked change from last year's sentiment, rating agencies have begun to express guarded optimism about the credit quality of states because of improvements in state revenue flows and restraint on spending.

The External Sector

In the first quarter of 2004, the U.S. current account deficit expanded to an annual rate of $580 billion, or about 5 percent of GDP. As in the past, the widening was driven primarily by a larger deficit in trade of goods and services. The surplus on net investment income declined in the first quarter but remained well above its average value in the previous year. The deficit on net unilateral transfers rose because of a concentration of disbursements of government grants in the first quarter.
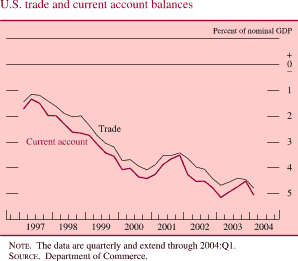
U.S. trade and current account balances. Percent of nominal GDP. Line chart. There are two lines (Trade and Current account). Date range of 1997 to 2004. They start at about negative 1.5 percent in early 1997. Both series generally move together with Current account being slightly lower. They decrease to about negative 4 percent in 2000, then they increase to about negative 4.5 in 2001. Current account ends at about negative 5 percent and trade ends at about negative 4.8 percent. NOTE. The data are quarterly and extend through 2004:Q1. SOURCE. Department of Commerce.

International Trade

The U.S. trade deficit in goods and services registered $548 billion at an annual rate in the first quarter, about $46 billion larger than in the fourth quarter of 2003. On average, data for April and May suggest that the trade deficit continued to widen in the second quarter.

Change in real imports and exports of goods and services. Percent, annual rate. Bar chart with 2 series (Imports and Exports). Date range of 1997 to Q1 2004. All series start in the beginning of 1997. ‘Imports’ begins at about 14 percent. During 1998-2001 it decreases to about negative 7.5 percent. Then it increases and ends at about 10 percent. Exports begins at about 7.5 percent and decreases to 2.5 percent in 1998. From 1999 to 2002 it fluctuates within the range of about 7.5 and about negative 12 percent. It ends at about 7.5 percent. SOURCE. Department of Commerce.

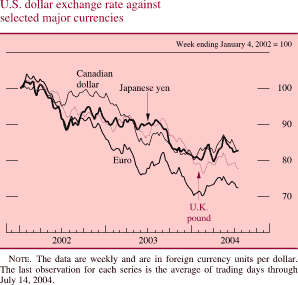
Real exports of goods and services increased at an annual rate of 7-1/2 percent in the first quarter of 2004, well off the blistering 20 percent pace of the fourth quarter but still above the average for 2003. Solid gains in exports since mid-2003 arose in part from the strong economic performance of many of our major trading partners. In addition, the net decline in the exchange value of the dollar since 2002 continued to make U.S. goods and services more competitive abroad. Increases in exports of U.S. goods were widespread across our major trading partners, with the exception of Japan, and were concentrated in real exports of capital goods, industrial supplies, and consumer goods. Real exports of agricultural products fell sharply, hurt by foreign bans on U.S. beef products following reports of mad cow disease in a U.S. herd. Exports of services rose moderately.

Prices of total exports rose at an annual rate of 5-3/4 percent in the first quarter, boosted by another jump in agricultural prices along with substantial increases in the prices of other primary commodities and industrial supplies. Prices of U.S. agricultural exports have been pushed up by very strong global demand, particularly from China. For specific products, such as cotton and soybeans, lower production in some countries also contributed to price run- ups. More recently, prices of soybeans and other agricultural products have eased in the face of a slowing in the growth of demand from China and the anticipation of larger harvests. Even so, available data point to continued strong increases in export prices in the second quarter.

Supported by solid U.S. economic growth, real imports of goods and services rose at an annual rate of 10-1/2 percent in the first quarter. This increase was below the fourth-quarter pace but still roughly double the rate of increase for 2003 as a whole. Real imports of goods were boosted by a sharp increase in oil imports. Gains in imports of non-oil goods were also sizable and widespread across categories. Imports of services grew slightly in the first quarter.

The spot price of West Texas intermediate (WTI) crude oil surged above $40 per barrel in May and has since fluctuated close to that level. The run-up in the price since the beginning of the year has been driven by surprisingly strong global demand for oil. Supply issues have been important as well. These were mainly continued violence in Iraq, including the sabotage of oil facilities, attacks on foreigners in Saudi Arabia, ongoing unrest in Nigeria, political turmoil in Venezuela, and tax payment difficulties at a major Russian oil company. The recent increase in OPEC production (mainly by Saudi Arabia) has eased the upward pressure on prices a bit, but they have remained elevated.

Prices of oil and of nonfuel commodities. Two lines chart. Date range of 2001 to 2004. Nonfuel (January 2001 = 100) begins at about 100 in early 2001, then it decreases to about 89 in Q4 2001. Then it increases to end at about 122. Oil (Dollars per barrel) begins at about 30 in early 2001, then it decreases to about 20 in Q4 2001.It increases and ends at about 42. NOTE. The data are monthly and extend through June 2004. The oil price is the spot price of West Texas intermediate crude oil. The price of nonfuel commodities is an index of forty-five primary-commodity prices from the International Monetary Fund.

Prices of imported non-oil goods rose at an annual rate of 5-1/2 percent in the first quarter after minimal increases in the second half of 2003. Prices for imported consumer goods rose at an annual rate of 2-3/4 percent after being flat in 2003. Skyrocketing global commodity prices last year and early this year boosted prices of imported industrial supplies (especially metals) and of foods, feed, and beverages. The jump in commodity prices reflected strong demand, the net depreciation of the dollar over the past two years, and the limited expansion in supply of many commodities since the 2001 trough in commodity prices. Available data suggest a modest step-down in the rate of increase of import prices in the second quarter; the move in part reflects a flattening of consumer goods prices.
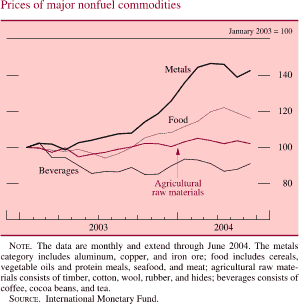
Prices of major nonfuel commodities. Lines chart. January 2003 = 100. There are four lines charts (Metals, Food, Beverages and Agricultural raw materials). Date range of 2003 to 2004. All series start at about 100 on early 2003. Metals generally increases to about 145 in the first half of 2004, then it decreases and ends at about 142 in the second half of 2004. Food increases to about 121 in the first half of 2004, then it decreases to end at about 119 in the second half of 2004. Agricultural raw materials decreases to 98 in the second half of 2003. Then it increases to end at about 102. Beverages decreases to about 85 in the second half of 2003, then it increases to end at about 90. NOTE. The data are monthly and extend through June 2004. The metals category includes aluminum, copper, and iron ore; food includes cereals, vegetable oils and protein meals, seafood, and meat; agricultural raw materials consists of timber, cotton, wool, rubber, and hides; beverages consists of coffee, cocoa beans, and tea. SOURCE. International Monetary Fund.

The Financial Account

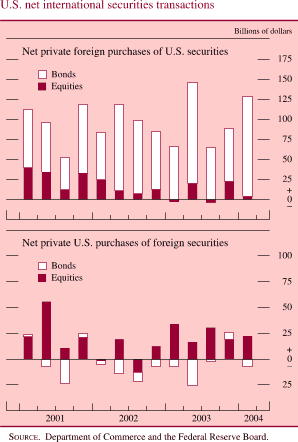
The U.S. current account deficit has continued to be financed largely by foreign flows into U.S. bonds. Foreign official inflows, already sizable in 2003, rose sharply in the first quarter of 2004 and then moderated somewhat. Similarly, private foreign purchases of U.S. bonds, which were significant in 2003, increased sharply in the first quarter and also appear to have moderated in the second quarter. In contrast, foreign demand for U.S. equities was weak in 2003 and has remained so in 2004. Purchases of foreign equities by private U.S. investors appear to be strengthening, but U.S. investors still show no appetite for foreign bonds.
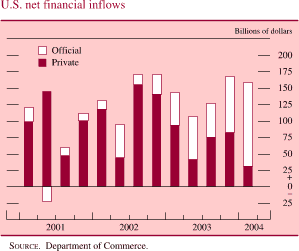
U.S. net financial inflows. Billions of dollars. Bar chart with 2 series (Official and Private). Date range of 2001 to 2004. Private begins at about 100 billions of dollars in Q1 2001, then it increases to about $148 billion in Q2 2001. From Q3 2001-Q3 2003 it fluctuates within the range of about $35 billion and $160 billion. It ends at about $30 billion in Q1 2004. Official begins at about $25 billion, then it decreases to about negative $25 billion in Q2 2001. Then it increases to end at about $100 billion. SOURCE. Department of Commerce.

U.S.net international securities transactions. Net private foreign purchases of U.S. securities. Billions of dollars. Bar chart with 2 series (Bonds and Equities). Data range is 2001 to 2004. Bonds start at about $75 billion. Then it fluctuates within the range of about $ 45 billion and about $130 billion from Q2 2001 to Q1 2003. In Q2 2003 it increases to about$ 150 billion, then it decreases to about $65 billion in Q4 2003. It ends at about $125 billion. Equities begin at about $40 billion. It then decreases to about $15 billion in Q3 2001 and then it fluctuates within the range of about $30 billion and about negative $10 billion. It ends at about $10 billion. U.S. international securities transactions. Net private U.S. purchases of foreign securities. Billions of dollars. Bar chart with 2 series (Bonds and Equities ). Data range is 2001 to 2004. Bonds starts in the first quarter of 2000 at about$ 10 billion. It decreases to about negative $30 billion in Q3 2001. It fluctuates within the range of about $15 billion and about negative $25 billion from Q4 2001 to Q3 2003.It ends at about negative $15 billion. Equities begin in the first quarter of 2001 at about $20 billion. It increases to about $60 billion in Q2 2001. Then it fluctuates within the range of about $40 billion and about negative $15 billion during Q3 2001 and Q4 2003. It ends at about $24 billion. SOURCE. Department of Commerce and the Federal Reserve Board.

Direct investment into the United States in the first quarter continued to be restrained by the slowdown of global mergers and acquisitions since 2002. In contrast, U.S. direct investment abroad was strong in 2003 and in the first quarter of 2004, as the effect of fewer mergers and acquisitions was offset by sizable reinvested earnings.

The Labor Market

Employment and Unemployment

The demand for labor turned up in late 2003 after an extended period of weakness, and it has gathered additional steam this year. After averaging about 60,000 per month in the fourth quarter of 2003, gains in private nonfarm payroll employment rose to an average of about 200,000 per month in the first half of 2004. The job gains were especially large in March, April, and May but ebbed somewhat in June. The civilian unemployment rate, which had fallen from a recent peak of 6.3 percent in June 2003 to 5.7 percent in December 2003, was little changed over the first half of the year. In June, it stood at 5.6 percent.
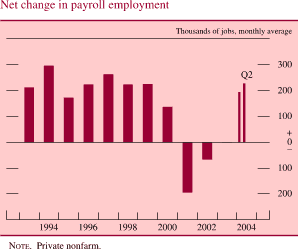
Net change in payroll employment. Thousands of jobs, monthly average. Bar chart. Data range is 1993 to January 2004. The series begins at about 210 in 1993. Then it increases to about 300 in 1994. Then it decreases to about 180 in 1995.In 1997 it increases to about 270, then it generally decreases to about negative 200 in 2001. In 2002 series starts to increase and ends at about 220. NOTE. Private nonfarm.

Civilian unemployment rate. Line chart. By percent. Date range is 1972-2004. As shown in the figure, the series begins at about 5 percent. From 1973 to 1995 it fluctuates within the range of about 5 and 11.5 percent. Then it decreases to about 4 percent in 2001 and then it increases to end at about 5.8 percent. NOTE. The data are monthly and extend through June 2004.

The increases in payrolls over the first half of 2004 were widespread. Especially notable was the turnaround in the manufacturing sector, in which employment bottomed out in January and then rose a cumulative 65,000 jobs through June. The rise in manufacturing jobs was concentrated in the durable goods industries--in particular, those making fabricated metals and other construction-related products, computers and electronic equipment, and machinery. After a long string of declines, employment at producers of nondurable goods was little changed, on net, over the first half. Job gains in virtually all other major sectors have been greater this year than last. In particular, hiring in retail trade, which had been lackluster in 2003, turned up appreciably, and construction employment increased further. The professional and business services sector also posted a sizable rise, in part because the rebound in manufacturing activity lifted hiring at temporary-help firms. A clear indication of the breadth of the employment increases is provided by the six-month diffusion index compiled by the Bureau of Labor Statistics (BLS). The index is equal to the percentage of industries that increased employment over the most recent six months plus one-half the percentage with unchanged employment; in June, the index moved up to its highest level since April 2000.

Productivity and Labor Costs

Gains in labor productivity have slowed somewhat in recent quarters after the spectacular increases of mid-2003. Still, according to the currently published data, output per hour in the nonfarm business sector rose a remarkable 5-1/2 percent over the year ending in the first quarter. Over the past three years, increases in productivity have averaged more than 4 percent per year, compared with average increases of about 2-1/2 percent per year in the second half of the 1990s. During that earlier period, an expansion of the capital stock was an important source of productivity growth. However, in the more recent period, when the business environment--at least until the past few quarters--was characterized by sluggish demand, lean capital budgets, and an extraordinary reluctance of firms to add to payrolls, businesses appear to have raised their productivity mainly through changes in organizational structures and better use of the capital already in place. With hiring having picked up of late, measured productivity growth may slow in coming quarters; but if recent experience is any guide, businesses will continue to focus on achieving structural improvements in the efficiency of their operations. The upswing in investment spending now under way also bodes well for sustained favorable productivity performance in the period ahead.
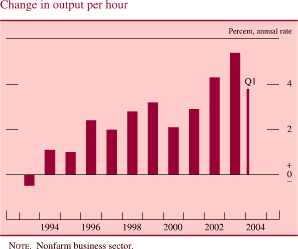
Change in output per hour. By percent, annual rate. Bar chart. Date range is 1993-2004. As shown in the figure, Change in output per hour begins at about negative 2 percent in 1993. Then it increases to about 6 percent in 2003. The series ends at about 3.9 percent. NOTE. Nonfarm business sector.

The rapid productivity growth in recent years has helped to bolster increases in hourly compensation in the face of the soft labor market and the low consumer price inflation in 2003. As a result, increases in the employment cost index (ECI) measure of hourly compensation, which is based on a survey of private nonfarm businesses conducted quarterly by the BLS, have held fairly steady of late. In fact, the rise in the ECI over the twelve months ending in March--at a shade less than 4 percent--was virtually the same as the increases over the preceding two years. Benefit costs, which rose 7 percent over the year ending in March, have continued to be the fastest rising portion of hourly compensation; health insurance costs have remained on a steep uptrend, and employers have boosted their contributions to defined-benefit retirement plans to make up for earlier stock market losses. The rising benefit costs have likely exerted some downward pressure on wages, which rose just 2-1/2 percent over the twelve months ending in March; the twelve-month change in the wage component of the ECI, which was close to 4 percent in 2000 and 2001, has been in the range of 2-1/2 percent to 3 percent since late 2002.
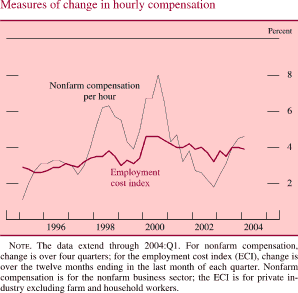
Measures of change in hourly compensation. By percent. Bar chart. There are two series (Nonfarm compensation per hour and Employment cost index). Date range is 1995-2004. Both series start in early 1995. Nonfarm compensation per hour begins at about 1 percent. Then it increases to about 6.2 percent in 1998. Then it decreases to about 4 percent in 1999. Then it generally increases to about 8 percent in 2000. In 2002 it decreases to about 1.7 percent. It ends at about 4.5 percent. Employment cost index begins at about 3 percent in early 1995. Then fluctuates within the range of about 2.7 and about 4.3 percent from 1995 through 2003 and ends at about 4.5 percent. NOTE. The data extend through 2004:Q1. For nonfarm compensation, change is over four quarters; for the employment cost index (ECI), change is over the twelve months ending in the last month of each quarter. Nonfarm compensation is for the nonfarm business sector; the ECI is for private industry excluding farm and household workers.

The change in compensation per hour in the nonfarm business (NFB) sector--an alternative measure of hourly compensation based on data constructed for the NIPA--has swung widely in recent years. Fluctuations in the value of stock option exercises, which are excluded from the ECI but included in the NFB measure, likely account for some of the differential movements in the two series. The four-quarter change in the NFB measure bottomed out at a bit less than 2 percent in 2002, when the value of exercised options was dropping; it has moved up steadily since that time and, in the first quarter, stood at 4-1/2 percent--a rate not much different from the increase in the ECI. With productivity growth slowing to a pace below that of NFB hourly compensation, unit labor costs rose in both the fourth and first quarters after having trended down over the preceding two years.
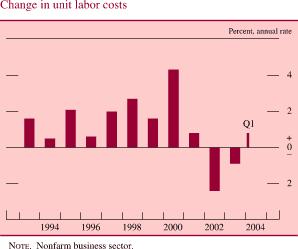
Change in unit labor costs. By percent. Bar chart. Date range is 1993-Q1 2004. Series begins at about 1.7 percent. From 1994 to 2001 it fluctuates within the range of about 0.5 and about 4.2 percent. Then it generally decreases to about negative 2.3 percent in 2002.Then it generally increases and ends at about 1 percent. NOTE. Nonfarm business sector.

Prices

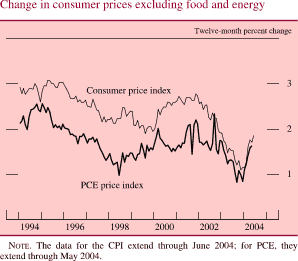
Inflation moved higher in the first half of 2004. After rising just 1-1/2 percent over the four quarters of 2003, the price index for personal consumption expenditures (PCE) increased at an annual rate of 3-1/2 percent between the fourth quarter of 2003 and May 2004. In that period, energy prices soared, and increases in core consumer prices picked up to an annual rate of 2-1/4 percent--more than 1 percentage point faster than the increase in 2003. Data for the consumer price index (CPI) are available through June and show some moderation in the core component of the series. Over the first half of the year, the core CPI rose at an annual rate of 2-1/2 percent, compared with an increase of 1-1/4 percent over the four quarters of 2003.
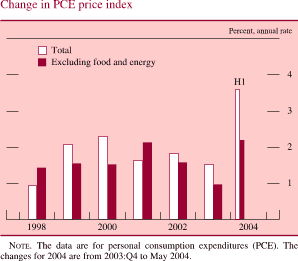
Change in PCE price index. Percent, annual rate. Bar chart. There are two series (Total and Excluding food and energy). Date range 1998 to H12004. Both series start at 1998. Total begins at about 0.9 percent, then it generally increases to about 2.3 percent in 2000. In 2003 it decreases to about 1.5 percent. Series ends at about 3.7 percent in 2004. Excluding food and energy begins at about 1.4 percent, then it increases to about 2.1 percent in 2001. In 2003 it decreases to about 1 percent. Series ends at about 2.2 percent. NOTE. The data are for personal consumption expenditures (PCE). The changes for 2004 are from 2003:Q4 to May 2004.

Change in consumer prices excluding food and energy. Twelve-month percent change. Line chart with 2 series (Consumer price index and PCE price index). Date range is 1994-2004. Both series start in 1994 and generally move together with PCE price index being lower. Consumer price index begins at about 2.9 percent, PCE price index begins at about 2.1 percent. They then decrease until 1999. Consumer price index to about 2 percent and PCE price index to about 1.5 percent. Then in 2001 they increase Consumer price index to about 2.7 percent and PCE price index to about 1.5 percent. Consumer price index ends at about 1.9 percent. PCE price index ends at about 1.7 percent. NOTE. The data for the CPI extend through June 2004; for PCE, they extend through May 2004.

Reflecting the surge in crude oil prices, PCE energy prices rose at an annual rate of more than 25 percent in the first quarter; they apparently posted another outsized increase in the second quarter. Gasoline prices increased rapidly through May as crude oil costs rose and as price markups were boosted by strong demand and lean inventories; although gasoline prices have fallen on balance since late May, they are currently nearly 30 percent above their level at the end of last year. As for natural gas, which can often substitute for fuel oil in the industrial sector, spot prices were elevated at the start of the year, fell somewhat in February and March, and trended up over the spring. The higher spot prices for natural gas this spring pushed up prices paid by consumers through June. PCE electricity prices appear to have risen at an annual rate of 3 percent over the first half of the year, a pace similar to that in 2003.

Although volatile from month to month, consumer food prices rose moderately on balance over the first half of 2004 after having moved up in late 2003. Robust global demand is imparting upward impetus to food prices, but U.S. producers are in the process of boosting supply, which should help restrain increases in retail food prices in coming quarters.

The step-up in core PCE inflation this year has been especially pronounced in a few categories. In particular, prices of motor vehicles have firmed after a noticeable decrease in 2003. In addition, increases in shelter costs, which were surprisingly low in 2003, are now running more in line with earlier trends. Core inflation has also been lifted this year by substantial increases, on balance, in a number of categories for which prices cannot be derived from market transactions and thus must be imputed by the Bureau of Economic Analysis--for example, prices of financial services provided by banks without explicit charge. These non-market-based prices, which were about flat in 2003, are difficult to estimate, and the imputed figures tend to be volatile.

A number of factors have contributed to the run-up in core inflation this year. Higher oil prices have doubtless raised the cost of producing other goods and services. So have the steep increases in prices of non-oil commodities such as copper and lumber, which came about as economic activity strengthened worldwide and as industrial capacity utilization both here and abroad tightened. Likewise, the decline in the dollar has boosted non-oil import prices and thus the costs of inputs for many domestic producers. The weaker dollar has also likely lessened the pressure on firms facing foreign competition to hold the line on prices--a consideration that is probably contributing to the widespread perception that firms' pricing power has increased lately. Moreover, unit labor costs have edged up recently after having declined noticeably in 2002 and 2003.

From a cyclical perspective, the sharp upturn in commodity prices is not surprising, given the pickup in the growth of industrial production. In fact, such large increases in commodity prices are typical as economic activity accelerates and capacity utilization rises--especially for products for which the supply is relatively fixed in the short run. Some portion of these increases usually proves transitory. More important, cyclical swings in commodity prices tend to have only a minor effect on overall inflation, both because they account for a small share of total costs and because changes in commodity prices tend to be partly absorbed in firms' profit margins, at least for a time.

The faster rate of inflation this year underscores the difficulty of gauging price pressures. Nevertheless, on the whole, the evidence suggests that slack remains in labor and product markets, which should be exerting some downward pressure on inflation. The unemployment rate--at 5-1/2 percent currently--is not significantly lower than it was through much of 2002 and 2003, when core inflation was trending down. And despite the run-up this year, capacity utilization in the manufacturing sector is still below its longer-run average. In addition, the strong upward trend in productivity is continuing to help keep the rise in labor costs muted, and profit margins are sufficiently wide to give firms scope to absorb cost increases for a while without putting undue upward pressure on prices.

The upturn in actual inflation has been echoed in some measures of inflation expectations. For example, according to the Michigan Survey Research Center, the median expectation for inflation over the coming year has averaged slightly more than 3 percent since early spring after hovering in the area of 2-1/4 percent to 2-3/4 percent in 2003 and early 2004. The median expectation for inflation over the next five to ten years has been running a bit below 3 percent in recent months, a reading similar to the figures for 2002 and 2003. According to the Survey of Professional Forecasters conducted by the Federal Reserve Bank of Philadelphia, expectations of inflation over the next ten years held steady in June at 2-1/2 percent. Inflation compensation over the next five years as measured by the spread between the yield on nominal Treasury securities and their indexed counterparts rose noticeably during the first half of 2004. To be sure, inflation compensation is also influenced by perceptions of inflation risk and the secular increase in demand for inflation-indexed debt, but the rise in near-term inflation compensation likely reflects, at least in part, higher inflation expectations. Similar to the survey-based measures of longer-run inflation expectations, inflation compensation for the period five years to ten years ahead was little changed on net over the first half of the year.

Broader NIPA price measures are available only through the first quarter, and the four-quarter changes in these series do not show the rise in inflation indicated by the monthly data discussed above. In particular, the rate of increase in the price index for GDP over the year ending in the first quarter was just 1-3/4 percent, the same as over the preceding year. The four-quarter change in the price index for gross domestic purchases--which is defined as the prices paid for purchases of domestic and imported consumption, investment, and government goods and services--dropped from 2-1/4 percent to 1-3/4 percent over the same period; the deceleration reflects mainly the effects of energy prices, which rose even more rapidly over the year ending in the first quarter of 2003 than they did over the most recent year.
 

Alternative measures of price change
Percent  
Chart of table rule
 
Price measure
 
2002
to
2003
2003
to
2004
Chain-type (Q1 to Q1)
Gross domestic product 1.7 1.8
Gross domestic purchases
2.3 1.7
Personal consumption expenditures 2.4 1.6
    Excluding food and energy 1.6 1.3
Fixed-weight (Q2 to Q2)
Consumer price index 2.2 2.8
    Excluding food and energy 1.5 1.8
Chart of table rule

          Note.  Changes are based on quarterly averages of seasonally
adjusted data.
 

U.S. Financial Markets

As 2004 opened, financial market conditions were quite accommodative, with low corporate bond yields, narrow risk spreads, and relatively easy terms and standards on bank lending. Although equity prices changed little, and interest rates rose on balance in response to positive economic news and expectations of a tightening of monetary policy, financial conditions in the first half of the year remained supportive of economic growth. Business borrowing nevertheless remained tentative, while increases in the debt of the federal government and of households were sizable.

Interest Rates

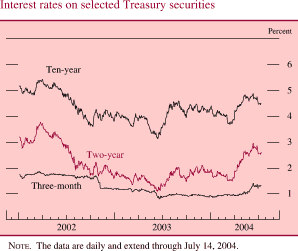
From the end of 2003 through the end of March, yields on nominal Treasury coupon securities fell, on net, about 30 to 45 basis points. Although interest rates rose immediately after the FOMC's January meeting in response to the Committee's decision to remove its statement that monetary policy could remain accommodative for "a considerable period," the increase proved to be short lived. Weak employment reports released in early February and early March prompted yields to fall amid doubts about the strength of the economic expansion. Federal funds futures contracts at the end of March appeared to indicate that market participants placed small odds on a tightening of monetary policy before late 2004, and contracts also seemed to price in only a gradual increase in the federal funds rate during 2005.

Interest rates on selected Treasury securities. By percent. Line chart. There are three series (Ten-year, Two-year and Three-month). Date range is 2002-2004. All series start in early 2002. Ten-year begins at about 5.1 percent. It decreases to about 3.6 percent in Q4 2002. From Q1 2003 to Q1 2004 it fluctuates within the range of about 3.1 and about 4.8 percent. It ends at about 4.5 percent. Two-year begins at about 3.2 percent. Then it decreases to about 1.2 percent in Q2 2003. Then it increases and ends at about 2.5 percent. Three-month begins at about 1.8 percent, then it decreases and ends at about 1.3. NOTE. The data are daily and extend through July 14, 2004.

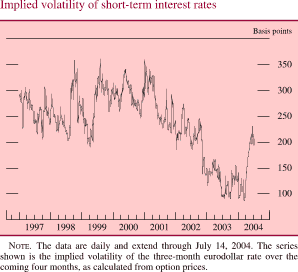
Interest rates backed up in the second quarter as data releases increasingly suggested that the economic expansion would remain vigorous. Yields on the two-year and ten-year nominal Treasury notes ended the first half of the year 90 and 36 basis points higher, respectively, than at the end of 2003, as markets adjusted to the greater likelihood of an earlier onset and more rapid pace of monetary policy tightening. The surprisingly strong employment reports published in April and May, higher-than-expected readings on core inflation, and surging oil prices all spurred increases in Treasury yields. After the release of the employment report in May, federal funds futures contracts priced in a hike in the target federal funds rate at the June FOMC meeting and a more rapid tightening of monetary policy than had been anticipated. With the evolving outlook for monetary policy, the volatility of short-term interest rates implied by option prices jumped in the first half of the year after staying in a relatively low range in 2003. Near-term interest rates declined a bit after the Committee's decision at its June meeting to raise the intended federal funds rate 25 basis points; the Committee's reaffirmation that policy accommodation likely could be removed at a "measured" pace apparently reassured investors that a steep rise in the federal funds rate probably was not in train.

Implied volatility of short-term interest rates. By basis points. Line chart. Date range is 1997-2004. The series begins at about 290 in early 1997. From 1997 to 2001 it fluctuates within the range of about 190 and about 360. Then it decreases to about 90 in 2003. Series increases and ends at about 200. NOTE. The data are daily and extend through July 14, 2004. The series shown is the implied volatility of the three-month euro dollar rate over the coming four months, as calculated from option prices.

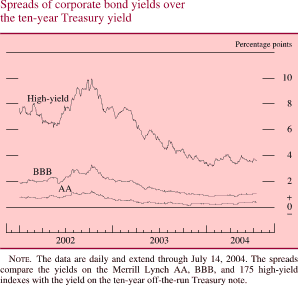
Yields on investment-grade corporate debt moved roughly in line with those on comparable nominal Treasury securities over the first half of the year, producing little net change in risk spreads from their level at the end of last year. Spreads on speculative-grade debt over Treasury debt declined a bit further after having narrowed sharply during 2003 as the economic expansion was seen as gathering steam.

Spreads of corporate bond yields over the ten-year Treasury yield. Percentage points. Line chart. There are three series (High yield, BBB and AA). Date range is 2002 to 2004. High yield begins at about 7.9 percent in early 2002. Then it generally increases to about 10 percent in the end of Q4 2002. Then it decreases and ends at about 3.7 percent. BBB begins at about 2 percent. Then it increases to about 3.2 percent in Q4 2002 and then it decreases and ends at about 1 percent. AA begins at about 0.9 percent and during Q2 2002 –Q2 2004 increases and ends at about 0.3 percent. NOTE. The data are daily and extend through July 14, 2004. The spreads compare the yields on the Merrill Lynch AA, BBB, and 175 high-yield indexes with the yield on the ten-year off-the-run Treasury note.

Equity Markets

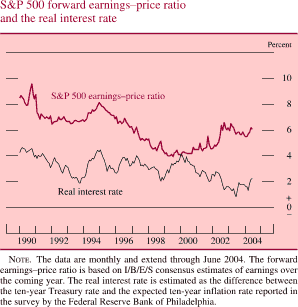
Over the first half of 2004, equity prices were subject to the strong crosscurrents of robust earnings reports, rising interest rates, fluctuating fears about geopolitical developments, and sharply higher oil prices. On balance, broad equity price indexes at the end of June had edged about 2-1/2 percent to 3-1/4 percent above year-end levels after having surged 25-30 percent over the course of 2003. Over the first half, analysts raised their estimates of profits for coming quarters; the upward revision outstripped the more modest increase in equity prices and boosted the ratio of expected year-ahead earnings to stock prices. With real interest rates higher, however, the difference between the earnings-price ratio and the real ten-year Treasury yield--a crude measure of the equity risk premium--changed little to remain close to its average value over the past two decades and above its level during the late 1990s.

Major stock price indexes. Week of January 2, 2002 = 100. There are two series (Wilshire 5000 and Russell 2000 ). Date range is 2002-2004. Both series generally move together with Wilshire 5000 being lower. They start in early 2002 at about 100. Then they decrease to about 68 in Q4 2002. In Q2 2003 they split. Then they increase to end, Russell 2000 ends at about 117. Wilshire 5000 ends at about 103. NOTE. The data are daily and extend through July 14, 2004.

S&P 500 forward earnings–price ratio and the real interest rate. Line chart. By percent. There are two lines (S&P 500 earnings–price ratio and Real interest rate). Date range is 1990-2004. Both lines start in early 1990. S&P 500 earnings–price ratio begins at about 8.6 percent, then it increases to about 9.8 percent in 1990. Then it decreases to about 6.3 percent in 1993. Then it increases to about 8.3 percent in 1994. It then decreases to about 4 percent in 2000. In 2004 it ends at about 6 percent. Real interest rate begins at about 4.2 percent. From 1991-2000 it fluctuates within the range of about 4.3 and about 1.9 percent. Then it decreases and ends at about 2 percent. NOTE. The data are monthly and extend through June 2004. The forward earnings–price ratio is based on I/B/E/S consensus estimates of earnings over the coming year. The real interest rate is estimated as the difference between the ten-year Treasury rate and the expected ten-year inflation rate reported in the survey by the Federal Reserve Bank of Philadelphia.

Debt and Financial Intermediation

Aggregate debt of the domestic nonfinancial sectors expanded at an annual rate of about 8-1/2 percent in the first quarter of 2004, a gain similar to last year's increase. Debt growth in the business sector has remained subdued so far this year, as ample internal funding has limited the need for external finance. In contrast, household debt has continued to expand rapidly, spurred by an elevated pace of home purchases and cash-outs from mortgage refinancing. The large federal budget deficit led to another sharp increase in Treasury debt in the first half of this year. Municipal borrowing moderated somewhat, on balance, in the first half of the year, as the improving fiscal condition of state and local governments reduced the need for short-term borrowing to cover budget gaps.

Change in domestic nonfinancial debt. By percent. Line chart. There are three lines (Total, Nonfederal and Federal, held by public). Date range is 1990-2003. Total begins at about 6.9 percent in 1990; it then generally decreases to about 4.2 percent in 1991. From 1991 to 1998 it increases to about 6.9 percent, then in 2000 it decreases to about 5 percent and it ends at about 9 percent. Nonfederal begins at about 6 percent, then it decreases to about 3 percent in 1991. From 1992 to 1998 it increases to about 9 percent. Then it decreases and ends at about 8 percent. Federal, held by public begins at about 11 percent, then from 1993 to 2000 it generally decreases to about negative 7 percent. Then it generally increases and ends at about 12 percent. NOTE. For 2004, change is from 2003:Q4 to 2004:Q1 at an annual rate. For earlier years, the data are annual and are computed by dividing the annual flow for a given year by the level at the end of the preceding year. The total consists of nonfederal debt and federal debt held by the public. Nonfederal debt consists of the outstanding credit market debt of state and local governments, households, nonprofit organizations, and nonfinancial businesses. Federal debt held by the public excludes securities held as investments of federal government accounts.

The growth of credit on the books of depository institutions picked up to an annual rate of 14 percent in the first quarter of 2004. Financing secured by residential real estate--including home mortgages, home equity loans, and mortgage-backed securities--drove the expansion. In contrast, business loans continued to run off, falling at an annual rate of about 5 percent in the first half of the year after a 10 percent drop in 2003. The deceleration was consistent with some signs that demand for business loans was beginning to recover as well as with an easing of standards and terms on these loans.

The M2 Monetary Aggregate

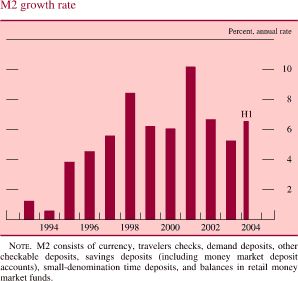
In the first half of 2004, short-term interest rates were stable and M2 grew at an annual rate of 6-1/2 percent--a pace that was roughly in line with estimates of nominal GDP--after contracting at a record rate in the fourth quarter of 2003. Liquid deposits--the largest component of M2--had been depressed late last year by the ebbing of last summer's mortgage refinancing boom. Mortgage refinancings tend to boost M2 as the proceeds are temporarily placed in non-interest-bearing deposit accounts pending disbursement of funds to the holders of mortgage-backed securities. When refinancings slowed last year, the decline in such escrow accounts held down the growth of liquid deposits. In the first half of this year, M2 probably received a boost from the new round of mortgage refinancings that followed the first-quarter decline in mortgage interest rates. The strength in liquid deposits was partly offset, however, by continued weakness in money market mutual funds and small time deposits. Given the recent very low yields on these two components of M2, households likely viewed them as less attractive savings vehicles than other assets.

M2 growth rate. By percent, annual rate. Bar chart. Date range is 1993-H2 2004. M2 growth rate begins at about 1.5 percent. It decreases to about 0.6 percent in 1994.Then it increases to about 8.5 percent in 1998. It decreases to about 6.1 by 2000. Then it increases to about 10.2 percent. The series ends at about 6.7 percent in 2004. NOTE. M2 consists of currency, travelers checks, demand deposits, other checkable deposits, savings deposits (including money market deposit accounts), small-denomination time deposits, and balances in retail money market funds.

International Developments

Foreign economic activity expanded in the first half of this year at a pace only slightly below the rapid increase in the second half of 2003. Global trade has been boosted by strong demand, especially from the United States and China. The run-up in oil and commodity prices has contributed to rising, though still moderate, inflation across the industrial and developing countries.

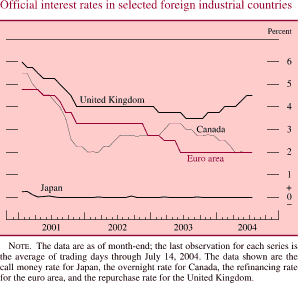
By the end of the first half of this year, monetary policy in most major foreign economies had either tightened or assumed a less accommodative tone. Citing high rates of capacity utilization and mounting inflationary pressures, the Bank of England has raised its target rate 100 basis points since early November. Mexico and China also have tightened policy. Elsewhere, including the euro area, Canada, and Japan, central banks most recently have kept policy unchanged after easing previously. In general, official statements are expressing increasing concern over the inflationary risks associated with stronger economic activity and higher world energy and commodity prices.

Official interest rates in selected foreign industrial countries. By percent. Line chart. There are four lines (United Kingdom, Euro area, Canada and Japan). Date range is 2001-2004. United Kingdom begins at about 6 percent, then it decreases to about 4 percent in Q4 2001.During Q4 2002-Q1 2003 it stays at about 4 percent. Then it increases and ends at about 4.5 percent. Euro area begins at about 4.8 percent. In Q4 2001 it decreases to about 3.2 percent. During 2002 it stays at about 3.2 percent. Then it decreases and ends at about 2 percent. Canada begins at about 5.6 percent, then it decreases to about 2 percent in Q1 2002.In Q2 2003 it increases to about 3.2 percent, then it decreases and ends at about 2 percent. Japan begins at about 0.2 percent, then it decreases to 0 percent in Q2 2001. Series stays at about 0 percent by the end. NOTE. The data are as of month-end; the last observation for each series is the average of trading days through July 14, 2004. The data shown are the call money rate for Japan, the overnight rate for Canada, the refinancing rate for the euro area, and the repurchase rate for the United Kingdom.

In foreign financial markets, equity price performance has been more mixed so far in 2004 than during the second half of 2003; sharply rising interest rates over the past few months have weighed on equity valuations, damping the effects of an improved earnings outlook. Since year-end, stock prices in Europe and Canada have changed little, on balance. In contrast, rapidly improving economic conditions in Japan have helped boost Japanese equity prices about 10 percent. Other Asian stock price indexes have fallen, on average, in part because of concerns about the possibility of an acute slowdown in China. Mexican stocks have been bolstered by strong earnings growth of leading Mexican communications firms and, more generally, by the strengthening U.S. expansion. Foreign long-term interest rates rose rapidly in the second quarter as new data (including from the United States) showing faster growth and higher inflation led market participants to expect more-aggressive monetary tightening. Over the first half of the year, the spread on internationally issued sovereign debt of emerging-market economies over U.S. Treasuries moved up somewhat from its very low level.

Equity indexes in selected foreign industrial countries. Line chart. Week ending January 3, 2003 = 100. There are four series (Japan, Canada, Euro area and United Kingdom). Date range is 2003 to 2004. All series start at about 100 in early 2003. Japan increases to 130 in Q4 2003, then it decreases to 115 and increases to end at about 139. Canada increases to about 132 in Q1 2004, then it decreases to end at about 127. United Kingdom decreases to about 90 in Q1 2003, then it increases to end at about 136. Euro area decreases to about 80 in Q1 2003, then it increases to end at about 138. NOTE. The data are weekly. The last observation for each series is the average of trading days through July 14, 2004.

Equity indexes in selected emerging-market economies. Line chart. Week ending January 3, 2003 = 100. There are four series (Argentina, Brazil, Mexico and Asian emerging-market economies). Date range is 2003 to 2004. All lines start at about 100 in early 2003. Argentina increases to about 240 in Q1 2004, then it decreases to end at about 190. Brazil increases to about 210 in Q1 2004, then it decreases to about 160 in Q2 2004. Series increases and ends at about 190. Mexico increases to about 175 in Q2 2004, then it decreases and ends at about 160. Asian emerging-market economies increases to about 150 in Q2 2004, then it decreases to end at about 135. NOTE. The data are weekly. The last observation for each series is the average of trading days through July 14, 2004. The Asian emerging-market economies are China, Hong Kong, India, Indonesia, Malaysia, Pakistan, the Philippines, Singapore, South Korea, Taiwan, and Thailand; the index weight for each of these economies is its market capitalization as a share of the group’s total.

Spread on internationally issued sovereign debt of emerging-market economies. Line chart. Percentage points. Date range is 2002 to 2004. Series begins at about 7 percent in early 2002, then it decreases to about 6 percent in Q2 2002. In Q4 2002 it increases to about 10 percent, then it decreases and ends at about 4.8 percent. NOTE. The data are weekly averages. The last observation is the average of trading days through July 14, 2004. The series shown is the J.P. Morgan Emerging Market Bond Index Plus (EMBI+), which is the spread of the yield of certain dollar-denominated sovereign debt instruments of emerging-market economies over U.S. Treasury securities; over the period shown, the index encompassed nineteen countries.

After depreciating over the previous two years, the value of the dollar rose slightly, on balance, in the first half of 2004. The firming of the dollar has been attributed to perceptions by market participants that near-term monetary tightening in the United States would be faster than such tightening abroad.

U.S. dollar nominal exchange rate, broad index.. Line chart. January 2001 = 100. Date range is 2000 to 2004. Series begins at about 100, then it increases to about 105 in Q1 2002. Then it generally decreases to about 100 in Q3 2002. In Q4 2002 it increases to about 103 and decreases to end at about 94. NOTE. The data are monthly and are in foreign currency units per dollar. The last observation is the average of trading days through July 14, 2004. The broad index is a weighted average of the foreign exchange values of the U.S. dollar against the currencies of a large group of major U.S. trading partners. The index weights, which change over time, are derived from U.S. export shares and from U.S. and foreign import shares.

U.S. dollar exchange rate against selected major currencies. Date range is 2002-2004. Week ending January 4, 2002 = 100. Line chart with four lines (Japanese yen, Euro, Canadian dollar and U.K. pound). All series start at about 100 in early 2001. Japanese yen decreases to about 88 in the middle of 2002, then it fluctuates within the range of about 90 and about 95. Then it decreases to end at about 84. Euro decreases to about 70 in Q1 2004, then it increases to end at about 72.5. Canadian dollar decreases to about 95 in the middle of 2002. Series increases to about 100 in Q4 2002, then it decreases to end at about 84. U.K. pound decreases to about 92 in the middle of 2002. Then it fluctuates between about 87 and about 92 from Q3 2002-Q4 2003. In Q1 2004 it decreases to about 77. It ends at about 79. NOTE. The data are weekly and are in foreign currency units per dollar. The last observation for each series is the average of trading days through July 14, 2004.

Industrial Economies

A broadly based recovery appears to have been established in Japan over the first half of 2004. Real GDP rose at an annual rate of more than 6 percent in the first quarter after an even greater increase in the fourth quarter. Aided by demand from China, growth of Japanese real exports remained robust. Personal consumption and business investment also firmed. More-recent indicators show that domestic strength continued in the spring with large gains in household expenditures and improved labor market conditions. Deflation continued to wane in Japan. Consumer price deflation over the first half of the year was slight, and wholesale prices increased. In financial markets, the stronger economy boosted equity markets and helped drive up the yield on the ten-year bellwether government bond to more than 1-3/4 percent from its June 2003 record low of about 1/2 percent. After making substantial sales of yen for dollars in the first quarter, Japanese authorities ceased intervention in mid-March. Even so, the yen depreciated early in the second quarter before appreciating to around ¥109 per dollar.

Economic conditions in the euro area firmed over the first half of 2004, but performance varied across countries, and the region as a whole continues to lag the global upturn. Real GDP in the euro area increased at an annual rate of 2-1/4 percent in the first quarter; output in France, Spain, and several smaller member countries rose relatively briskly, while growth in Germany and Italy was less robust. In the first quarter, domestic demand firmed noticeably, except in Germany, where growth was due entirely to a spike in exports. German consumer spending remains anemic, held down by a weak labor market and low consumer confidence. Euro-area indicators for the second quarter initially were upbeat, but more-recent data have been mixed. Labor markets have yet to benefit from the recovery, and the average unemployment rate in the region edged up to 9 percent in the spring. Inflation for the euro area over the twelve months ending in June was near 2-1/2 percent, a rate above the European Central Bank's medium-term goal of less than, but close to, 2 percent. Excluding energy, food, alcohol, and tobacco, prices rose slightly less than 2 percent over the same period.

Economic expansion in the United Kingdom continued unabated over the first half of 2004. Labor markets tightened further; the unemployment rate edged down to its lowest level in almost three decades, and labor earnings posted solid gains. Despite the strong economy, consumer price inflation over the twelve months ending in June was 1-1/2 percent, remaining below the central bank's official target rate of 2 percent. Conditions in the U.K. housing market, however, remained red hot, with double-digit price increases, high levels of household mortgage and consumer borrowing, and sizable withdrawals of home equity.

The Canadian economy picked up steam in the first half of 2004 after a year plagued with difficulties including SARS, mad cow disease, and a regional power outage. Sizable gains in consumption and investment boosted output in the first quarter, and indicators are pointing to continued good performance in these sectors. Export growth was strong, as the robust economic performance of the United States appears to have outweighed the negative effect of Canadian dollar appreciation on trade. The unemployment rate was relatively stable over the first half, and employment bounced back in the second quarter from a first-quarter lull. Consumer price inflation decreased early in the year, but energy costs helped drive up the rate to 2-1/2 percent over the twelve months ending in June. Prices excluding food, energy, and indirect taxes have remained more subdued, rising slightly less than 1-1/2 percent over the same period.

Emerging-Market Economies

Estimates suggest that real GDP in China surged in the first quarter with continued outsized gains in fixed-asset investment. Fears of overinvestment, particularly in the steel, cement, and aluminum industries, led Chinese officials to intensify their tightening measures early in the second quarter. These measures included increases in reserve requirements and in some interest rates as well as stricter criteria for the approval of investment projects. A sharp slowdown in estimated real GDP for the second quarter suggests that these steps are working. Despite the recent slowing in growth, Chinese exports and imports soared in the first half of the year, and trade was close to balanced.

Growth in the other Asian emerging-market economies slowed only moderately in the first quarter from the fast pace at the end of last year. Exports, which continued to be the driving force behind that growth, were fueled by Chinese demand as well as by the recovery in the global high-tech market and stronger world demand overall. Consumer demand generally rose across the region with the notable exception of Korea, where high levels of consumer debt are weighing on spending. Although still only moderate, inflation across the Asian emerging-market economies is beginning to rise as stronger aggregate demand takes hold and higher energy and commodity prices pass through to prices more generally.

The Mexican economy has been propelled this year by strong demand from the United States. Gains have been broadly based, with sharp increases in industrial production, exports, construction, and retail sales. Employment in the industries most closely linked to U.S. trade also has started to increase. Responding to a rise in twelve-month inflation to slightly above its 2 percent to 4 percent target range, the Bank of Mexico has tightened policy several times so far this year. Elevated oil prices boosted the Mexican public-sector fiscal surplus to a record high during the first five months of the year and facilitated an increase in federal transfers to state governments.

In Brazil, GDP grew robustly in the first quarter, and indications are that economic activity continued to expand in the second quarter with support from strong external demand. Job growth has been robust, although unemployment has remained high. Inflation, however, continues to concern authorities. Asset prices weakened earlier this year, in part because of rising global interest rates but also because of market participants' unease about the direction of structural and fiscal reforms; since then, asset prices have partially rebounded.

The recovery in Argentina has continued at a rapid pace in recent quarters, but limited investment in the energy sector, reflecting a lack of structural reforms, has forced the government to import electricity, natural gas, and fuel oil from neighboring countries. Creditors have shown little enthusiasm for the country's latest debt restructuring plan, and the federal government faces difficult challenges in normalizing its international financial situation and reforming its fiscal relations with the provinces.

Section 1


Home | News and events | Monetary policy | July 2004 report
Accessibility | Contact Us
Last update: September 9, 2013