
Humphrey-Hawkins Report, February 24, 1998
Section 2: Economic and Financial
Developments
in 1997 and Early 1998
The past year has been an exceptionally good one for the U.S. economy. Initial estimates indicate that real GDP increased nearly 4 percent over the four quarters of 1997. Household and business expenditures continued to rise rapidly, owing in part to supportive financial conditions, including a strong stock market, ample availability of credit, and, from April onward, declining intermediate- and long-term interest rates. In the aggregate, private domestic spending on consumption and investment rose nearly 5 percent on an inflation-adjusted basis. The strength of spending, along with a further sizable appreciation of the foreign exchange value of the U.S. dollar, brought a surge of imports, the largest in many years. Export growth, while lagging that of imports, also was substantial despite the appreciation of the dollar and the emergence after midyear of severe financial difficulties in several foreign economies, particularly among the advanced developing countries in Asia.
Meanwhile, inflation slowed from the already reduced rates of the
previous few years. Although wages and total hourly compensation
accelerated in a tight labor market, the inflationary impulse from that
source was more than offset by other factors, including rising
competition from imports, the price restraint from increased
manufacturing capacity, and a sizable gain in labor
productivity.

The Household Sector
Consumption Spending, Income, and Saving.
Bolstered by increases in income and wealth, personal consumption
expenditures rose substantially during 1997--about 3-3/4
percent, according to the initial estimate. Expenditures strengthened
for a wide variety of durable goods. Real outlays on home computers
continued to soar, rising even faster than they did over the previous
few years. Strength also was reported in purchases of furniture and
home appliances--products that tend to do well when home sales are
strong. Consumer expenditures on motor vehicles rose moderately, on
net, more than reversing the small declines of the previous two years.
Real expenditures on services increased more than 4 percent in
1997, the largest gain of recent years. Personal service categories
such as recreation, transportation, and education recorded large
increases. Consumers also boosted their outlays for business services,
including outlays related to financial
transactions.
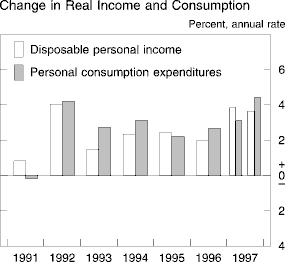
Real disposable personal income--after-tax income adjusted for inflation--is estimated to have increased about 3-3/4 percent during 1997, a gain that was exceeded on only one occasion in the previous decade. Income was boosted this past year by sizable gains in wages and salaries and by another year of large increases in dividends.
Measured in terms of annual averages, the personal saving rate fell further in 1997, according to current estimates. The 1997 average of 3.8 percent was about 1/2 percentage point below the 1996 average and roughly a full percentage point below the 1995 average. It also was the lowest annual reading in several decades. Various surveys of households show consumers to have become increasingly optimistic about prospects for the economy, and this rising degree of optimism may have led them to spend more freely from current income. Support for additional spending came from the further rise in the stock market, as the capital gains accruing to households increased the chances of their meeting longer-run net worth objectives even as they consumed a larger proportion of current income.
Residential Investment. Preliminary data
indicate that real residential investment increased nearly 6
percent during 1997. Real outlays for the construction of new
single-family structures rose moderately, and outlays for the
construction of multifamily units continued to recover from the extreme
lows that were reached earlier in the decade. Real outlays for
home improvements and brokers' commissions, categories that have a
combined weight of more than 35 percent in total residential
investment, moved up substantially from the final quarter of 1996 to
the final quarter of 1997. Spending on mobile homes, a small part of
the total, also
advanced.

The indicators of single-family housing activity were almost uniformly strong during the year. Sales of houses surged, driven by declines in mortgage interest rates and the increasingly favorable economic circumstances of households. Annual sales of new single-family houses were up about 5-1/2 percent from the number sold in the preceding year, and sales of existing homes moved up about 3 percent. House prices moved up more quickly than prices in general. Responding to the strong demand, starts of new single-family units remained at a high level, only a touch below that of 1996; the annual totals for single-family units have now exceeded 1 million units for six consecutive years, putting the current expansion in single-family housing construction nearly on a par with that of the 1980s in terms of longevity and strength. In January of this year, starts of and permits for single-family units were both quite strong.
Starts of multifamily units increased in 1997 for the fourth year in a row and were about double the record low of 1993. The increased construction of these units was supported by a firming of rents, abundant supplies of credit, and a reduction in vacancy rates in some markets. The national vacancy rate came down only slightly, however, and it has reversed only a portion of the sharp run-up that took place in the 1980s. This January, starts of multifamily units fell back to about the 1997 average after having surged to an exceptionally high level in the fourth quarter.
The home-ownership rate--the number of households that own their dwellings divided by the total number of households--moved up further in 1997, to about 65-3/4 percent, a historical high. The rate had fallen in the 1980s but has risen almost 2 percentage points in this decade.
Household Finance. Household net worth
appears to have grown roughly $3-1/2 trillion during 1997,
ending at its highest multiple relative to disposable personal income
on record. Most of this increase in net worth was the result of upward
revaluations of household assets rather than additional saving.
In particular, capital gains on corporate equities accounted
for about three-fourths of the increase in net worth. Flows of
household assets into mutual funds, pensions, and other vehicles for
holding equities indirectly were exceeded by outflows from directly
held equities.

Household borrowing not backed by real estate, including credit card balances, auto loans, and other consumer credit, increased 4-3/4 percent in 1997. These obligations grew at double-digit rates in 1994 and 1995 but have slowed fairly steadily since then. Mortgage borrowing, by contrast, has experienced relatively muted swings in growth during the current expansion. Home mortgages are estimated to have grown 7 percent last year, only a bit slower than in 1996. Within this category of credit, however, home equity loans have advanced sharply, reflecting in part the use of these loans in refinancing and consolidating credit card and other consumer obligations.
An element in the slowing of consumer credit growth may have been
assessments by some households that they were reaching the limits of
their capacity for carrying debt and by some lenders that they needed
to tighten selectively their standards for granting new loans. In the
mid-1990s, the percentage of household income required to meet debt
obligations rose to the upper end of its historical range, in large
part because of a sharp rise in credit card debt. Between 1994
and 1996 personal bankruptcies grew at more than a 20 percent
annual rate, to some extent because of households' rising debt
burden; a change in the federal bankruptcy law and a secular trend
toward associating less social stigma with bankruptcy also may have
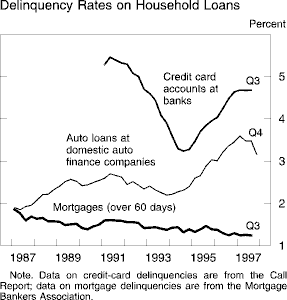
contributed. Over the same period, delinquency and charge-off rates on
consumer loans increased significantly.
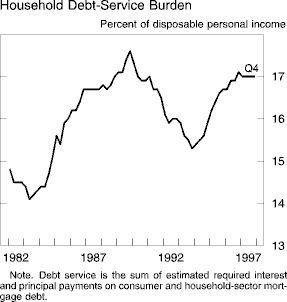
Last year, however, because the growth of household debt only
slightly outpaced that of income while interest rates drifted lower,
the household debt-service burden did not change. Reflecting, in part,
the stability of the aggregate household debt burden, delinquency
rates on many segments of consumer credit plateaued, although
charge-off rates generally continued to rise somewhat. Personal
bankruptcies advanced again last year but showed some signs of leveling
off in the third
quarter.
Some of the apparent leveling out of household debt-repayment problems may also have resulted from efforts by lenders to stem the growth of losses on consumer loans. For the past two years, a large percentage of the respondents to the Federal Reserve's quarterly Senior Loan Officer Opinion Survey on Bank Lending Practices have reported tightened standards on consumer loans. But the percentages reporting tightening have fallen a bit in the last few surveys, suggesting that many banks feel that they have now altered their standards sufficiently.
Although banks pulled back a bit from consumer lending, most households had little trouble obtaining credit in 1997. Bank restraint has most commonly taken the form of imposing lower credit limits or raising finance charges on outstanding balances; credit card solicitations continued at a record pace. Furthermore, many respondents to the Federal Reserve's January 1998 survey of loan officers said their banks had eased terms and standards on home equity loans, providing consumers easier access to an alternative source of finance.
Mortgage rates fell last month to levels that led many households to apply for loan refinancing. When households refinance, they may choose among options that have differing implications for cash flow, household balance sheets, and spending. Some households may decide to reduce their monthly payments, keeping the size of their mortgages unchanged. Others may keep their monthly payments unchanged, either speeding up their repayments or increasing their mortgages and taking out cash in the process, perhaps to augment current expenditures. In any case, the wave of refinancings is likely having only a small effect on the overall economy because the current difference between the average rate on outstanding mortgages and the rate on new ones is not very large.
The Business Sector
Investment Expenditures. Adjusted for
inflation, businesses' outlays for fixed investment rose about 8
percent during 1997 after gaining about 12 percent during 1996.
Spending continued to be spurred by rapid growth of the economy,
favorable financial conditions, attractive purchase prices for new
equipment, and optimism about the future. Business outlays for
equipment, which account for more than three-fourths of total business
fixed investment, moved up about 12 percent this past year,
making it the fourth year of the last five in which the annual gains
have exceeded 10 percent. As in previous years of the
expansion, real investment rose fastest for computers, the power of
which continued to advance rapidly at the same time their prices
continued to decline. Spending also moved up briskly for many other
types of equipment, including communications equipment, commercial
aircraft, industrial machinery, and construction machinery.
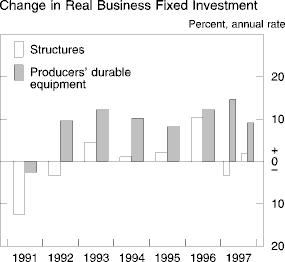
Real outlays for nonresidential construction, the remaining portion of business fixed investment, declined somewhat in 1997 after moving up in each of the four previous years. Construction of office buildings continued to increase in 1997, but sluggishness was apparent in the expenditure data for many other types of structures. Nonetheless, a tone of underlying firmness was apparent in other indicators of market conditions. Vacancy rates declined, for example, and rents seemed to be picking up. In some areas of the country, more builders have been putting up new office buildings on "spec"--that is, undertaking new construction before occupants have been lined up. The new projects are apparently being spurred to some degree by the ready availability of financing.
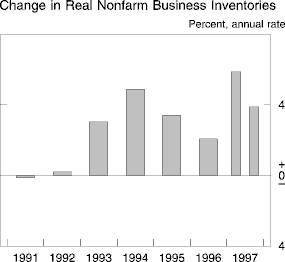
Business inventory investment picked up considerably in 1997. According
to the initial estimate, the level of inventories held by nonfarm
businesses rose about 5 percent in real terms over the course of
the year after increasing roughly 2 percent in 1996.
Accumulation was especially rapid in the commercial aircraft
industry, in which production has been ramped up in response to a huge
backlog of orders for new jets. With the rate of inventory growth
outpacing the growth of final sales last year, the stock-to-sales ratio
in the nonfarm sector ticked up slightly, after a small decline in the
preceding year. Although inventory accumulation does not seem likely to
persist at the pace of 1997, businesses in general do not appear to be
uncomfortable with the levels of stocks that they have been
carrying.
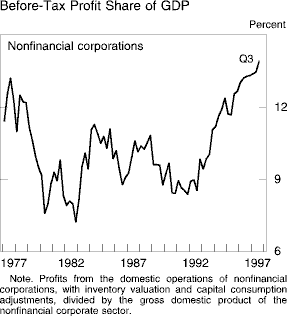
Corporate Profits and Business Finance. The
economic profits of U.S. corporations (book profits after inventory
valuation and capital consumption adjustments) increased at more than a
14 percent annual rate over the first three quarters of 1997, and
profits of nonfinancial corporations from their domestic operations
grew at a 13-1/2 percent annual rate. In the third quarter,
nonfinancial corporate profits amounted to nearly 14 percent of
that sector's nominal output, up from 7-1/4 percent in
1982 and the highest share since 1969. The elevated profit share
reflects both the high level of cash flow before interest costs, which
also stands at a multiyear peak relative to output, and the reductions
in interest costs that have taken place in the 1990s.
Fourth-quarter profit announcements indicate that year-over-year growth
in earnings was fairly strong; few corporations reported that they had
experienced much fallout yet from the events in Asia, but many warned
that profits in the first half of 1998 will be significantly
affected.
Despite the rapid growth in profits, the financing gap for nonfinancial corporations--capital expenditures less internal cash flow--widened, reflecting the strong expansion of spending on capital equipment and inventories. Furthermore, on net, firms continued to retire a large volume of equity, adding further to borrowing needs, as substantial gross issuance was swamped by stock repurchases and merger-related retirements. Given these financing requirements, the growth of nonfinancial corporate debt picked up to more than a 7 percent rate last year.
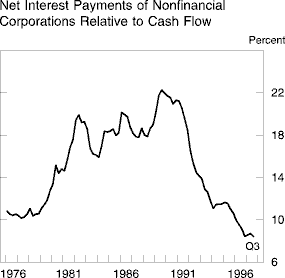
With the debt of nonfinancial corporations advancing briskly, the
ratio of their interest payments to cash flow was about unchanged last
year, after several years of decline that had left it at quite a low
level. Consequently, measures of debt-repayment difficulties also were
very favorable last year: The default rate on corporate bonds remained
extremely low, and the number of upgrades of debt about equaled the
number of downgrades. Similarly, only small percentages of business
loans at banks were delinquent or charged off. The rate of
business bankruptcies increased a bit but was still fairly low.
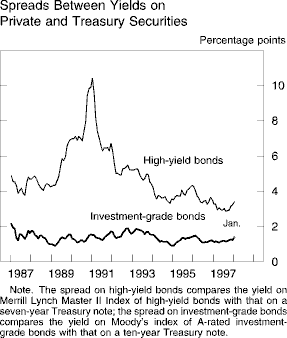
Businesses continued to find credit amply supplied at
advantageous terms last year. The spread between yields on
investment-grade bonds and yields on Treasury securities of similar
maturities remained narrow, varying only a little during the year. The
spreads on below-investment-grade bonds fell over the year, touching
new lows before widening a bit in the fall and early this year; the
widening occurred in large part because these securities benefited less
from the flight to U.S. assets in response to events in Asia
than did Treasury securities. Banks also appeared eager to lend to
businesses. Large percentages of the respondents to the Federal
Reserve's surveys, citing stiff competition as the reason, said they
had eased terms--particularly spreads--on business loans last year.
Much smaller percentages reported having eased standards on these
loans. The high ratios of stock prices to earnings suggest that equity
finance was also quite cheap last year. Nevertheless, the market for
initial public offerings of equity was cooler than in 1996--new issues
were priced below the expected range more often than above it, and
first-day trading returns were smaller on average.
The pickup in business borrowing was widespread across funding sources. Outstanding commercial paper, which had declined a bit in 1996, posted strong growth in 1997, as did bank business loans. Gross issuance of bonds was extremely high, particularly bonds with ratings below investment grade. Such lower-rated bonds made up nearly half of all issuance, a new record. Although sales of new investment-grade bonds slowed a bit in the fall, corporations were apparently waiting out the market volatility at that time, and issuance picked back up in January. Banks, real estate investment trusts, and commercial-mortgage-backed securities were the most significant sources of funds for income properties--residential apartments and commercial buildings--the financing of which expanded further last year.
The Government Sector
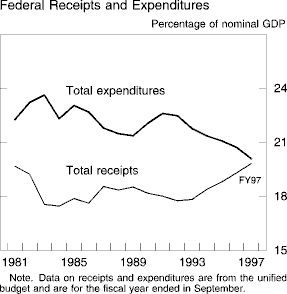
Federal Expenditures, Receipts, and Finance. Nominal outlays in the unified budget increased about 2-1/2 percent in fiscal year 1997 after moving up 3 percent in fiscal 1996. Fiscal 1997 was the sixth consecutive year that the growth of spending was less than the growth of nominal GDP. During that period, spending as a percentage of nominal GDP fell from about 22-1/2 percent to just over 20 percent. The set of factors that have combined to bring about this result includes implementation of fiscal policies aimed at reducing the deficit, which has helped slow the growth of discretionary spending and spending on some social and health services programs, and the strength of the economy, which has reduced outlays for income support.
In nominal terms, small to moderate increases were recorded in most major expenditure categories in fiscal 1997. Net interest outlays, which have been accounting for about 15 percent of total unified outlays in recent years, rose only a small amount in 1997, as did nominal outlays for defense and those for income security. Expenditures on Medicaid rose moderately for a second year after having grown very rapidly for many years; spending in this category has been restrained of late by the strong economy, the low rate of inflation in the medical area, and policy changes in the Medicaid program. Policy shifts and the strong economy also cut into outlays for food stamps, which fell about 10 percent in fiscal 1997. By contrast, spending on Medicare continued to rise at about three times the rate of total federal outlays. Growth of outlays for social security also exceeded the rate of rise of total expenditures.
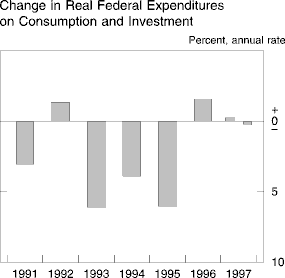
Real federal outlays for consumption and gross investment, the
part of federal spending that is counted in GDP, were unchanged, on
net, from the last quarter of 1996 to the final quarter of 1997. Real
outlays for defense, which account for about two-thirds of the spending
for consumption and investment, declined slightly, offsetting a small
increase in nondefense outlays. Because of much larger declines in most
other recent years, the level of real defense outlays at the end of
1997 was down about 22 percent from its level at the end of the
1980s; total real outlays for consumption and investment dropped about
14 percent over that period.
Federal receipts rose faster than nominal GDP for a fifth
consecutive year in fiscal 1997; receipts were 19-3/4
percent of GDP last year, up from 17-3/4 percent in fiscal
1992. The ratio tends to rise during business expansions, mainly
because of cyclical increases in the share of profits in nominal GDP.
In the past couple of years, the ratio also has been boosted by the tax
increases included in the Omnibus Reconciliation Act of 1993, by a
rising income share of high-income taxpayers, and by receipts from
surging capital gains realizations, which raise the numerator of the
ratio but not the denominator because capital gains realizations are
not part of GDP.
In fiscal 1997, combined receipts from individual income taxes and
social insurance taxes, which account for about 80 percent of
total receipts, moved up about 9-1/2 percent, even more
than in fiscal 1996. Receipts from the taxes on corporate profits were
up about 6 percent in fiscal 1997 after increasing about
9-1/2 percent in the preceding fiscal year. The total rise
in receipts in fiscal 1997, coupled with the subdued rate of increase
in nominal outlays, resulted in a budget deficit of $22 billion,
down from $107 billion in the preceding fiscal year.
With the budget moving close to balance, federal borrowing slowed sharply last year. The Treasury responded to the smaller-than-expected borrowing need by reducing sales of bills in order to keep its auctions of coupon securities predictable and of sufficient volume to maintain the liquidity of the secondary markets. The result was an unusually large net redemption of bills, which at times pushed yields on short-term bills down relative to yields on other Treasury securities and short-term private obligations.
Last year saw the first issuance by the Treasury of inflation-indexed securities. The Treasury sold indexed ten-year notes in January and April of last year and again this January, and sold five-year notes in July and October; it also announced it would sell indexed thirty-year bonds this April. Investor interest in the securities at those auctions was substantial, with the ratios of received bids to accepted bids resembling those for nominal securities. As expected, most of the securities were quickly acquired by final investors, and the trading volume as a share of the outstanding amount has been much smaller than for nominal securities.
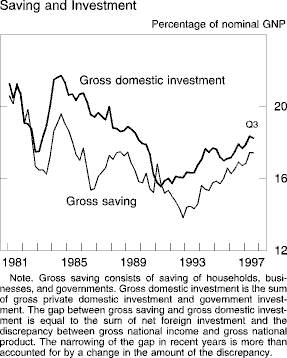
An important macroeconomic implication of the reduced federal
deficit is that the federal government has ceased to be a negative
influence on the level of national saving. The improvement in the
federal government's saving position in recent years has more than
accounted for a rise in the total gross saving of households,
businesses, and governments, from about 14-1/2 percent of
gross national product earlier in the decade, when federal
government saving was at a cyclical low and highly
negative, to more than 17 percent in the first three quarters of
1997. This rise in domestic saving, along with increased borrowing from
abroad, has financed the rise in domestic investment in this expansion.
Still higher rates of saving and investment were the norm a
couple of decades ago, when the personal saving rate was a good bit
above its level in recent
years.
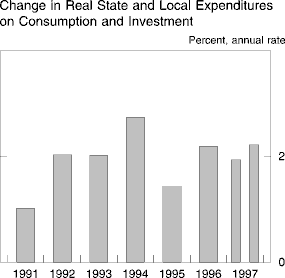
State and Local Governments. The real
outlays of state and local governments for consumption and investment
moved up about 2 percent over the four quarters of 1997, similar
to the average since the start of the 1990s. Investment expenditures,
which have grown about 2-1/2 percent per annum this decade,
rose at only half that pace in 1997, according to the initial estimate.
However, real consumption expenditures increased 2-1/4
percent last year, a touch above the average for the decade.
Compensation of government employees, which accounts for about
three-fifths of real consumption and investment expenditures, rose
about 1-3/4 percent in 1997 and has increased at an annual
rate of only about 1-1/4 percent since the end of the
1980s.
The efforts of state and local governments to hold down their labor expenses are also reflected in the recent data on nominal wages and hourly compensation. According to the employment cost indexes, hourly compensation of the workers employed by state and local governments increased 2-1/4 percent in 1997, a little less than in 1996 and the smallest annual increase in the seventeen-year history of the series. The increase in the average hourly wage of state and local employees amounted to about 2-3/4 percent in 1997, roughly the same as the gain in 1996. The average hourly cost of the benefit packages provided to state and local employees rose only 1-1/4 percent, a percentage point less than the increase in 1996.
With costs contained and receipts continuing to rise with the growth of the economy, financial pressures that were evident among state and local governments earlier in the expansion have diminished. The increased breathing room in the budgets of recent years is apparent in the consolidated current account of these governments: Surpluses in that account, excluding those that are earmarked for social insurance funds, had dipped to a low of about 1-1/2 percent of nominal receipts in 1991, but they have been larger than 3 percent of receipts in each of the past three years.
State and local debt expanded about 5-3/4 percent last year after changing little in 1996 and declining in the two preceding years. In those earlier years, municipal debt outstanding had been held down by the retirement of bonds that were "advance refunded" in the early 1990s. In such operations, funds that had earlier been raised and set aside were used to refund debt as it became callable. By the end of 1996, however, the stock of such debt had apparently been largely worked down.
External Sector
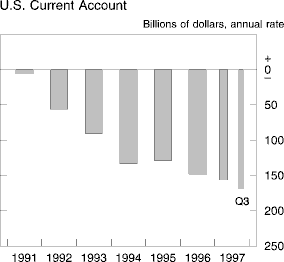
Trade and the Current Account. The nominal
trade deficit for goods and services was $114 billion in 1997,
little changed from the $111 billion deficit in 1996. For
the first three quarters of the year, the current account deficit
reached $160 billion at an annual rate, somewhat wider than the
1996 deficit of $148 billion. This deterioration of the current
account largely reflects continued declines in net investment income,
which for the first time recorded deficits in each of the first three
quarters of the year.
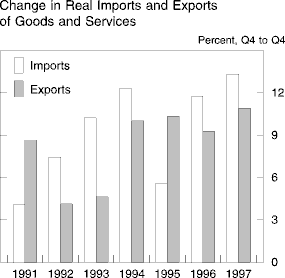
The quantity of imports of goods and services expanded strongly during 1997--about 13 percent according to preliminary estimates--as the very rapid growth experienced during the first half of the year moderated slightly during the second half. The expansion was fueled by continued vigorous growth of U.S. GDP. Additional declines in non-oil import prices--related in large part to the appreciation of the dollar--contributed as well. Of the major trade categories, increases in imports were sharpest for capital goods and consumer goods.
Export growth was also strong in 1997, particularly during the first
half of the year. The quantity of exports of goods and services
rose nearly 11 percent, after a rise of 9-1/4 percent
the preceding year. Despite further appreciation of the dollar, exports
accelerated in response to the strength of economic activity
abroad. Output growth in most of our industrial-country trading
partners firmed in 1997 from the moderate rates observed in 1996. Among
our developing-country trading partners, robust growth continued
through much of the year, but the onset of crises in several Asian
economies late in 1997 led to abrupt slowdowns in economic activity.
Growth of exports to Latin American countries and to Canada was
particularly strong. Exports to Western Europe also increased at a
healthy pace.
Capital Flows. In the first three quarters of 1997, large increases were reported in both foreign ownership of assets in the United States and U.S. ownership of assets abroad, reflecting the continued trend toward the globalization of both financial markets and the markets for goods. Little evidence of the gathering financial storm in Asia was apparent in the data on U.S. capital flows through the end of September. Foreign official assets in the United States rose $46 billion in the first three quarters of 1997. The increases were concentrated in the holdings of certain industrial countries and members of OPEC. Although substantial, these increases were below the pace for the first three quarters of 1996.
In contrast, increases in assets held by other foreigners in the first three quarters of 1997 surpassed those recorded in 1996. In particular, net purchases of U.S. Treasury securities by private foreigners rose to $130 billion, net purchases of U.S. corporate and other bonds reached $96 billion, and net purchases of U.S. stocks were a record $55 billion. In addition, foreign direct investment in the United States also posted a new high of $78 billion, as the strong pace of acquisitions of U.S. companies by foreigners continued.
U.S. direct investment abroad in the first three quarters of 1997 also exceeded the 1996 pace, with a record net outflow of $88 billion. U.S. net purchases of foreign securities in the first three quarters of 1997 were $74 billion, a little below the pace for 1996. However, net purchases of stocks in Japan and bonds in Latin America were up substantially. Banks in the United States reported a large increase in net claims on foreigners in the first quarter but only a modest increase in the next two quarters combined.
The Labor Market
Employment, Productivity, and Labor
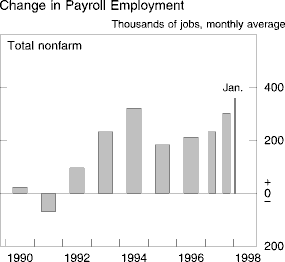
Supply. More than 3 million jobs were added to
nonfarm payrolls in 1997--a gain of nearly 2-3/4 percent,
measured from December to December. Patterns of hiring mirrored the
broadly based gains in output and spending. Manufacturing,
construction, trade, transportation, finance, and services all
exhibited appreciable strength. In manufacturing, the 1997 rise in the
job count followed two years of little change. Elsewhere, the gains in
1997 came on top of substantial increases in other recent years.
Especially rapid increases were posted this past year in some of the services industries, including computer services, management services, education, and recreation. Employment at suppliers of personnel, a category that includes the agencies that supply help on a temporary basis, also increased appreciably in 1997, but the gains in this category fell considerably short of those seen in previous years of the expansion. Help-supply firms reported that shortages of workers were limiting the pace of their expansion.
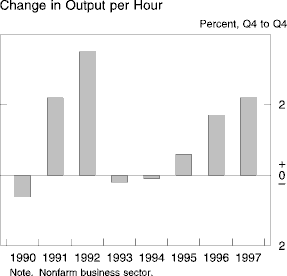
Labor productivity has risen rapidly over the past two years.
Revised data show the 1996 gain in output per hour in the
nonfarm business sector to have been about 1-3/4 percent,
and the increase in 1997 was larger still--about 2-1/4
percent, according to the first round of estimates. Although the
average rate of productivity increase since the end of the 1980s still
is only a little above 1 percent per year, the data for the past two
years provide hopeful indications that sustained high levels of
investment in new technologies may finally be translating into a
stronger trend.
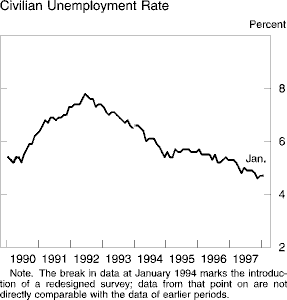
The civilian unemployment rate fell more than 1/2
percentage point from the fourth quarter of 1996 to the fourth
quarter of 1997, to an average of just under 4-3/4 percent.
The rate held steady at this level in January of this year. For most of
the past year, the rate has been running somewhat below the minimum
that was reached in the expansion of the 1980s. A variety of survey
data indicate that firms have had increased difficulty filling jobs.
After moving up a step in 1996, the labor force participation rate continued to edge higher in 1997. Without the increment to labor supply from increased participation over these two years, the unemployment rate would have fallen to an even lower level. Changes in the welfare system perhaps contributed to some extent to the small rise in participation in 1997, although this effect is difficult to disentangle from the normal tendency of participation to rise when the labor market is tight. Even though one-third of the adult population remained outside the labor force in 1997, the vast majority of those individuals likely were in pursuits that tended to preclude their workforce participation, such as retirement, schooling,or housework. The percentage of the working age population interested in work but not actively seeking it moved down further in 1997, to 2-1/4 percent in the fourth quarter, a record low in the history of the series, which began in 1970.
Wages and Hourly Compensation. According
to the employment cost indexes, hourly compensation in private industry
increased 3.4 percent from December of 1996 to December of 1997.
This rise exceeded that of the previous year by 0.3 percentage
point and was 0.8 percentage point greater than the increase of
1995. Although the patterns of change in hourly pay have varied quite a
bit by industry and occupation over the past two years, the overall
step-up seems to have been prompted, in large part, by the
tightening of labor markets. The implementation of a higher
minimum wage also seems to have been a factor in some industries and
occupations, although its impact is difficult to assess
precisely.

The wage and salary component of hourly compensation rose faster in 1997 than in any previous year of the expansion. Annual increases in the employment cost index for wages and salaries in private industry amounted to 2.8 percent in both 1994 and 1995, but the increases of 1996 and 1997 were 3.4 percent and 3.9 percent respectively. Wages and salaries in the service-producing industries accelerated nearly a full percentage point in 1997, pushed up, especially, by sharp pay increases in the finance, insurance, and real estate sector, in which commissions and bonuses have recently been boosted by high levels of mortgage refinancing and trading activity. By contrast, hourly wages in the goods-producing industries slowed a couple of tenths of a percentage point in 1997; the annual gains in these industries have been around 3 percent, on average, in each of the past six years.
Although the costs of the fringe benefits that companies provide to their employees also picked up in 1997, the yearly increase of 2.3 percent was not large by historical standards. As in other recent years, benefit costs in 1997 were restrained by a variety of influences. Most notably, the price of health care continued to rise at a subdued pace, and the ongoing strength of the economy limited the need for payments by firms to state unemployment trust funds. Even though some firms reported seeing renewed sharp increases in health care costs during the year, the employment cost data suggest that most firms still were keeping those costs under fairly tight control.
With nominal hourly compensation in almost all industries moving ahead at a faster pace than inflation, workers' pay generally increased in real terms, and the real gains were substantial in many occupations. Indeed, the employment cost index does not capture some of the forms of compensation that employers have been using to attract and retain workers--stock options and signing bonuses, for example.
Prices
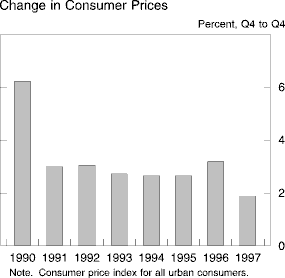
Indications of a slowing of inflation in 1997 were widespread in
the various measures of aggregate price change. The consumer price
index, which had picked up to more than a 3 percent rate of
rise over the four quarters of 1996, increased slightly less than
2 percent over the four quarters of 1997 as energy prices turned
down and increases in food prices slowed.
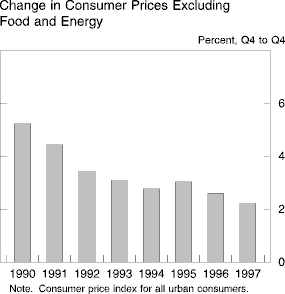
The CPI excluding food and energy--a widely used gauge of the underlying
trend of inflation--rose only 2-1/4 percent in 1997 after
increases of 3 percent in 1995 and 2-1/2 percent in
1996. The CPI for commodities other than food and energy rose about
1/2 percent over the four quarters of 1997 after moving up
slightly more than 1 percent in 1996. Price increases for
non-energy services, which have a much larger weight than commodities
in the core CPI, also slowed a little in 1997; a 3 percent
rise during the year was about 1/4 percentage point
less than the increase during 1996. Only small portions of the
slowdowns between 1996 and 1997 in the total CPI and in the CPI
excluding food and energy were the result of technical changes
implemented by the Bureau of Labor Statistics.
1
Other measures of aggregate price change also decelerated in 1997. The chain-type price index for gross domestic purchases--the broadest measure of prices paid by U.S. households, businesses, and governments--increased about 1-1/2 percent during 1997 after moving up 2-1/4 percent in 1996. The chain-type price index for gross domestic product, a measure of price change for the goods and services produced in this country (rather than the goods and services purchased), increased 1-3/4 percent in the latest year after rising 2-1/4 percent in 1996. The steeper slowing of the price index for aggregate purchases relative to that for aggregate production was largely a reflection of the prices of imports, which fell faster in 1997 than in 1996. Falling computer prices were an important influence on many of these measures of aggregate price change--more so than on the CPI, which gave small weight to computers through 1997 but has started weighting them more heavily this year.
Alternative Measures
of Price Change
Percent
|
Note. Changes are
based on quarterly averages and are
measured to the fourth quarter of the year indicated
from the fourth quarter of the previous year.
In real terms, imports of goods and services account for approximately 15 percent of the total purchases of households, businesses, and governments located in the United States. But that figure probably understates the degree of restraint that falling import prices have imposed on domestic inflation, because the lower prices for imports also make domestic producers of competing products less likely to raise prices. Prices have also been restrained by large additions to manufacturing capacity in this country, amounting to more than 5 percent in each of the past three years; this capacity growth helped to stave off the bottlenecks that so often have developed in the more advanced stages of other postwar business expansions. A gain in manufacturing production of more than 6 percent this past year was accompanied by only a moderate increase in the factory operating rate, which, at year-end, remained well below the highs reached in other recent expansions and the peak for this expansion, which was recorded about three years ago.
Reflecting the ample domestic supply and the effects of competition from goods produced abroad, the producer price index for finished goods declined about 3/4 percent from the fourth quarter of 1996 to the fourth quarter of 1997; excluding food and energy, it rose only fractionally. Prices of domestically produced materials (other than food and energy) also rose only slightly, on net. The prices of raw industrial commodities, many of which are traded in international markets, declined over the year; the weakness of prices in these markets was especially pronounced in late 1997, when the crises in Asia were worsening. Industrial commodity prices fell further in the first couple of weeks of 1998, but they since have changed little, on balance. The producer price index fell sharply in January of this year; the index excluding food and energy declined slightly.
After moving up more than 4 percent in 1996, the consumer price index for food increased only 1-3/4 percent in 1997. Impetus for the large increase of 1996 had come from a surge in the price of grain, which peaked around the middle of that year; since then, grain prices have dropped back considerably. An echo of the up-and-down price pattern for grains appeared at retail in the form of sharp price increases for meats, poultry, and dairy products in 1996 followed by small to moderate declines for most of those products in 1997. Moderate price increases were posted at retail for most other food categories last year.
The CPI for energy has traced out an even bigger swing than the price of food over the past two years--a jump of 7-1/2 percent over the four quarters of 1996 was followed by a decline of about 1 percent over the four quarters of 1997. As is usually the case in this sector, the key to these developments was the price of crude oil, which in 1997 more than reversed the run-up of the preceding year. Prices of oil have been held down in recent months by ample world supplies, the economic problems in Asia, and a mild winter.
Survey data on inflation expectations mostly showed moderate reductions during 1997 in respondents' views of the future rate of price increase, and some of the survey data for early 1998 have shown a more noticeable downward shift in inflation expectations. A lowering of inflation expectations has long been viewed as an essential ingredient in the pursuit of price stability, and the recent data are a sign that progress is still being made in that regard.
Credit, Money, Interest Rates,
and Equity
Prices
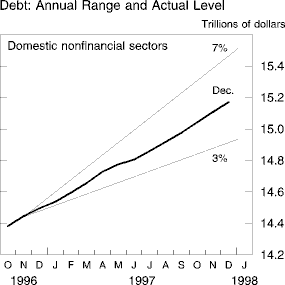
Credit and Depository Intermediation. The debt of
the domestic nonfinancial sectors grew at a 4-3/4 percent
rate last year, somewhat below the midpoint of the range established by
the FOMC and less than in 1996, when it grew 5-1/4 percent.
The deceleration was accounted for entirely by the federal
component, which, because of the reduced budget deficit, rose less than
1 percent last year, after having risen 3-3/4 percent
in 1996. Nonfederal debt grew 6 percent, a bit more than in 1996,
as the pickup in business borrowing more than offset the deceleration
of household debt.
Depository institutions increased their share of credit flows in 1997, with credit on their books expanding 5-3/4 percent, up appreciably from growth in 1996. The growth of bank credit, adjusted topg24.ps remove the effects of mark-to-market accounting rules, accelerated to an 8-1/4 percent pace, the largest rise in ten years; and banks' share of domestic nonfinancial debt outstanding climbed to its highest level since 1988. Bank credit accelerated in part because banks' holdings of securities--which had run off in 1995 and had been flat in 1996--expanded at a brisk pace last year; securities account for one-fourth of total bank credit. Loans, which make up the remainder of bank credit, also advanced a bit more quickly last year than in 1996, though more slowly than in 1995.
The increase in bank loans occurred despite a net decline in consumer loans on banks' books resulting both from sharply slower growth in loans originated by banks and from continued securitization of those loans. Real estate loans at banks, by contrast, posted solid growth last year. This category of credit benefited from a pickup in home mortgages, the rapid growth in home equity loans, which were substituting in part for consumer loans, an acceleration in commercial real estate lending, and the acquisition of thrift institutions by banks. Commercial and industrial loans expanded considerably last year, reflecting both the general rise in the demand by businesses for funds and an increase in banks' share of the nonmortgage business credit market as they competed vigorously for business loans by easing terms.
The rapid growth of banks' assets was facilitated by their continued high profitability and abundance of capital; at the end of the third quarter, nearly 99 percent of bank assets were at well-capitalized institutions. Problems with the repayment performance of consumer loans--which, while not deteriorating further, remained elevated by historical standards--hurt some banks; however, overall loan delinquency and charge-off rates stayed quite low, and measures of banks' profitability persisted at the elevated levels they have occupied for several years. Profits at a few large bank holding companies were reduced in the fourth quarter by trading losses resulting from the events in Asia. Nonetheless, the profits of the industry as a whole remained robust.
The profits and capital levels of thrift institutions, like those of banks, were high last year, and the thrifts also were aggressive lenders. The outstanding amount of credit extended by thrifts grew at about a 1-1/2 percent pace last year, but this sluggishness reflected entirely the acquisitions of thrifts by commercial banks; among thrifts not acquired during the year, asset growth was similar to that of banks.
Growth of Money and
Debt
Percent
|
Note. M1 consists of
currency, travelers checks, demand
deposits, and other checkable
deposits. M2 consists of M1
plus savings deposits (including money
market deposit
accounts), small-denomination time deposits, and
balances in retail money market funds. M3 consists of M2
plus
large-denomination time deposits, balances in
institutional money
market funds, RP liabilities (overnight
and term), and Eurodollars
(overnight and term). Debt
consists of the outstanding
credit market debt of the
U.S.
government, state and local governments, households
and nonprofit
organizations, nonfinancial businesses,
and farms.
1. From
average for fourth quarter of preceding year to
average
for fourth quarter of year indicated.
2. From average for
preceding quarter to average
for quarter indicated.
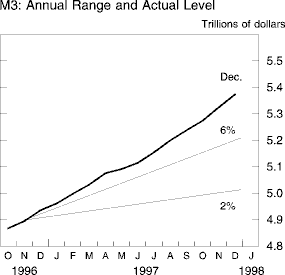
The Monetary Aggregates. Boosted in part
by the need to fund substantial growth in depository credit, M3
shot up last year, expanding 8-3/4 percent; this
growth was well above the 2 percent to 6 percent annual
range, which was intended to suggest the rate of growth over the long
run consistent with price stability. M3 was augmented by a shift
in sources of funding--mostly at U.S. branches and agencies of
foreign banks--from borrowings from related offices abroad, which are
not included in M3, to large time deposits issued in the United States,
which are. Also contributing to the strength in M3 was rapid growth in
institution-only money funds, which reflected gains by these funds in
the provision of corporate cash management services. Corporations
that manage their own cash often keep their funds in short-term assets
that are not included in
M3.
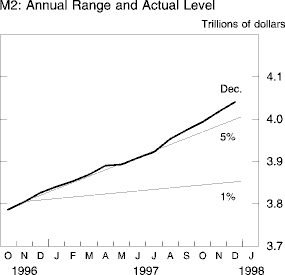
Although growth of M2 did not match that of M3, it increased at a
brisk 5-1/2 percent rate last year. As the Committee
had anticipated, the aggregate was somewhat above the upper bound of
its 1 percent to 5 percent annual range, which also had
been chosen to be consistent with expected M2 growth under conditions
of price stability. Because short-term interest rates responded only
slightly to System tightening in March, the opportunity cost of holding
M2--the interest earnings forgone by owning M2 assets rather than money
market instruments such as Treasury bills--was about unchanged over the
year. As M2 grew at about the same rate as nominal GDP, velocity
was also essentially unchanged. The ups and downs of M2 growth last
year mirrored those of the growth in nominal output. M2 expanded
much more slowly in the second quarter than in the first,
consistent with the cooling of nominal GDP growth and almost
unchanged opportunity costs. In the second half of the year, M2 growth
picked up, again pacing the growth of nominal GDP. In the fall, M2 may
also have been boosted a little by the volatility in equity markets,
which may have led some households to seek the relative safety of M2
assets.
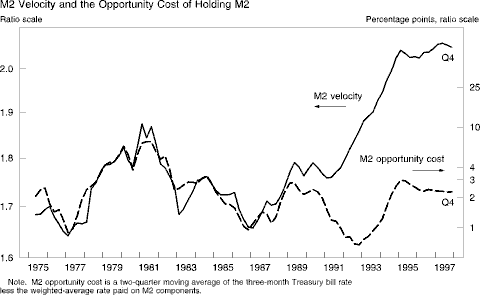
For several decades before 1990, M2 velocity responded positively to
changes in its opportunity costs and otherwise showed little net
movement over time. This pattern was disturbed in the early 1990s in
part by households' apparent decision to shift funds out of
lower-yielding M2 deposits into higher-yielding stock and bond mutual
funds, which raised M2 velocity even as opportunity costs were
declining. The movements in the velocity of M2 from 1994 into 1997
appear to have again been explained by changes in opportunity costs,
along with some residual upward drift. This drift suggests that some
households may still have been in the process of shifting their
portfolios toward non-M2 assets. There was no uptrend in velocity over
the second half of last year, perhaps because of the declining yields
on intermediate- and long-term debt and the greater volatility and
lower average returns posted by stock mutual funds. However, given the
aberrant behavior of velocity during the 1990s in general,
considerable uncertainty remains about the relationship
between the velocity and opportunity cost of M2 in the future.
M1 fell 1-1/4 percent last year. As has been true for the last four years, the growth of this aggregate was depressed by the adoption by banks of retail sweep programs, whereby balances in transactions accounts, which are subject to reserve requirements, are "swept" into savings accounts, which are not. Sweep programs benefit depositories by reducing their required reserves, which earn no interest. At the same time, they do not restrict depositors' access to their funds for transactions purposes, because the funds are swept back into transactions accounts when needed. The initiation of programs that sweep funds out of NOW accounts--until last year the most common form of retail sweep programs--appears to be slowing, but sweeps of household demand deposits have picked up, leaving the estimated total amount by which sweep account balances increased last year similar to that in 1996. Adjusted for the initial reduction in transactions accounts resulting from the introduction of new sweep programs, M1 expanded 6-1/4 percent, a little above its sweep-adjusted growth in 1996.
The drop in transactions accounts caused required reserves to fall 7-1/4 percent last year. Despite this decline, the monetary base grew 6 percent, boosted by a hefty advance in currency. Currency again benefited from foreign demand, as overseas shipments continued at the elevated levels seen in recent years. Moreover, domestic demand for currency expanded sharply in response to the strong domestic spending.
The Federal Reserve has been concerned that as the steady decline in required reserves of recent years is extended, the federal funds rate may become significantly more volatile. Required reserves are fairly predictable and must be maintained on only a two-week average basis. As a result, the unavoidable daily mismatches between reserves made available through open market operations and desired reserves typically have been fairly small, and their effect on the federal funds rate has been muted. However, banks also hold reserve balances at the Federal Reserve to avoid overdrafts after making payments for themselves and their customers. This component of the demand for reserves is difficult to predict, varies considerably from day to day, and must be fully satisfied each day. As required reserves have declined, the demand for balances at the Federal Reserve has become increasingly dominated by these more changeable daily payment-related needs. Nonetheless, federal funds volatility did not increase noticeably last year. In part this was because the Federal Reserve intervened more frequently than in the past with open market operations of overnight maturity in order to better match the supply of and demand for reserves each day. In addition, banks made greater use of the discount window, increasing the supply of reserves when the market was excessively tight. Significant further declines in reserve balances, however, do risk increased federal funds rate volatility, potentially complicating the money market operations of the Federal Reserve and of the private sector. One possible solution to this problem is to pay banks interest on their required reserve balances, reducing their incentive to avoid holding such balances.
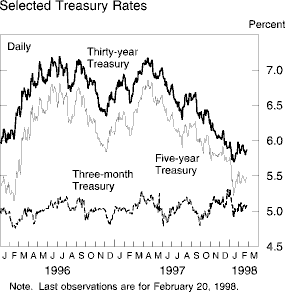
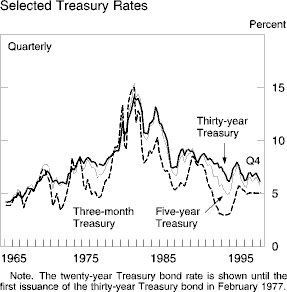
Interest Rates and Equity Prices. Interest
rates on intermediate- and long-term Treasury securities moved lower,
on balance, last year. Yields rose early in the year as market
participants became concerned that strength in demand would further
tighten resource utilization margins and increase inflation unless the
Federal Reserve took countervailing action. Over the late spring
and summer, however, as growth moderated some and inflation
remained subdued, these concerns abated significantly, and
longer-term interest rates declined. Further reductions came in the
latter part of the year as economic problems mounted in Asia. On
balance, between the end of 1996 and the end of 1997, the yields on
ten-year and thirty-year Treasury bonds fell about 70 basis
points. Early this year, with the economic troubles in Asia continuing, the
desire of investors for less risky assets, along with further
reductions in the perceived risk of strong growth and higher inflation,
pushed yields on intermediate- and long-term Treasury securities down
an additional 25 to 50 basis points, matching their levels
of the late 1960s and the early 1970s, when the buildup of inflation
expectations was in its early stages.
Survey measures of expectations for longer-horizon inflation generally did move lower last year, but by less than the drop in nominal yields. As a result, estimates of the real longer-term interest rate calculated by subtracting these measures of expected inflation from nominal yields indicate a slight decline in real rates over the year. In contrast, yields on the inflation-indexed ten-year Treasury note rose about a quarter percentage point between mid-March (when market participants seem to have become more comfortable with the new security) and the end of the year. The market for the indexed securities is sufficiently small that their yields can fluctuate temporarily as a result of moderate shifts in supply or demand. Indeed, much of the rise in the indexed yield came late in the year, when, in an uncertain global economic environment, investors' heightened desire for liquidity may have made nominal securities relatively more attractive.
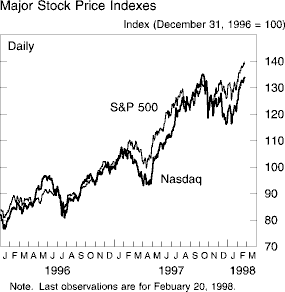
With real interest rates remaining low and corporate profits growing
strongly, equities had another good year in 1997, and major stock
indexes rose 20 percent to 30 percent. Although stocks
began the year well, they fell with the upturn in interest rates in
February. As interest rates subsequently declined and earnings reports
remained quite upbeat, the markets again advanced, with most broad
indexes of stock prices reaching new highs in the spring. Advances were
much more modest, on balance, over the second half of the year.
Valuations seemed already to have incorporated very robust earnings
growth, and in October, deepening difficulties in Asia evidently led
investors to lower their expectations for the earnings of some
U.S. firms, particularly high-technology firms and money center
banks. More rapid price advances have resumed of late,
as interest rates fell further and investors apparently came to
see the earnings consequences of Asian difficulties as limited.
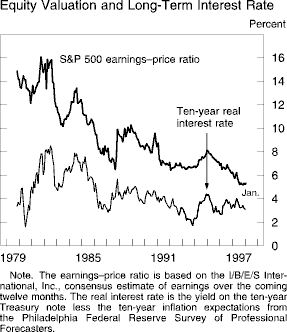
Despite the strong performance of earnings and the slower rise of stock
prices since last summer, valuations seem to reflect a combination of
expectations of quite rapid future earnings growth and a
historically small risk premium on equities. The gap between the
market's forward-looking earnings-price ratio and the real interest
rate, measured by the ten-year Treasury rate less a survey measure of
inflation expectations, was at the smallest sustained level last year
in the eighteen-year period for which these data are available.
Declines in this gap generally imply either that expected real earnings
growth has increased or that the risk premium over the real rate
investors use when valuing those earnings has fallen, or both. Survey
estimates of stock analysts' expectations of long-term nominal earnings
growth are, in fact, the highest observed in the fifteen years for
which these data are available. Because inflation has trended down over
the past fifteen years, the implicit forecast of the growth in real
earnings departs even further from past forecasts. However, even with
this forecast of real earnings growth, the current level of equity
valuation suggests that investors are also requiring a lower risk
premium on equities than has generally been the case in the past, a
hypothesis supported by the low risk premiums evident in corporate bond
yields last year.
International Developments
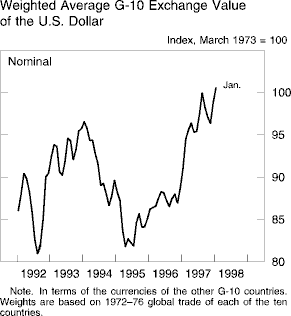
The foreign exchange value of the dollar rose during 1997 in
terms of the currencies of most of the United States' trading partners.
From the end of December 1996 through the end of December 1997, the
dollar on average gained 13 percent in nominal terms against the
currencies of the other G-10 countries when those currencies are
weighted by multilateral trade shares. In terms of a broader index of
currencies that includes those of most industrial countries and several
developing countries, the dollar on balance rose nearly 14
percent in real terms during 1997.2 The
trading desk of the New York Federal Reserve Bank did not
intervene in foreign exchange markets during
1997.
During the first half of 1997, the dollar appreciated in terms of the currencies of the other industrial countries, as the continuing strength of U.S. economic activity raised expectations of further tightening of U.S. monetary conditions. Concerns about the implications of the transition to European Monetary Union and perceptions that monetary policy was not likely to tighten significantly in prospective member countries also contributed to the tendency for the dollar to rise in terms of the mark and other continental European currencies. In response to varying indicators of the strength of the Japanese expansion, the dollar rose against the yen early in the year but then moved back down through midyear.
The crises in Asian financial markets dominated developments during the second half of the year and resulted in substantial appreciation of the dollar in terms of the currencies of Korea and several countries in Southeast Asia. The dollar also appreciated against the yen in response to evidence of financial sector fragility in Japan and faltering Japanese economic activity, which were likely to be exacerbated by the negative impact of the Asian situation on Japan. During the first weeks of 1998, the dollar has changed little, on average, in terms of the currencies of most other industrial countries, but it has moved down in terms of the yen.
Pronounced asset-price fluctuations in Southeast Asia began in early July when the Thai baht dropped sharply immediately following the decision by authorities to no longer defend the baht's peg. Downward pressure soon emerged on the currencies and equity prices of other southeast Asian countries, in particular Indonesia and Malaysia. Weakening balance sheet positions of nonfinancial firms and financial institutions, rising debt-service burdens, and financial market stresses that resulted in part from policies of pegging local currencies to the appreciating dollar prompted closer scrutiny of Asian economies. As foreign creditors came to realize the extent to which these Asian financial systems were undercapitalized and inadequately supervised, they became less willing to continue to lend, making it even more difficult for the Asian borrowers to meet their foreign currency obligations. Turbulence spread to Hong Kong in October. The depreciation of currencies elsewhere in Asia, in particular the decision by Taiwanese authorities to allow some downward adjustment of the Taiwan dollar, led market participants to question the commitment of Hong Kong authorities to the peg of the Hong Kong dollar to the U.S. dollar. In response, the Hong Kong Monetary Authority raised domestic interest rates substantially to defend the peg, driving down equity prices as a consequence. Near the end of the year, the crisis spread to Korea, whose economy and financial system were already vulnerable as a result of numerous bankruptcies of corporate conglomerates starting in January 1997; these bankruptcies of major nonfinancial firms further undermined Korean financial institutions and, combined with the depreciations in competitor countries, contributed to a loss of investor confidence. On balance, during 1997 the dollar appreciated significantly in terms of the Indonesian rupiah (139 percent), the Korean won (100 percent), and the Thai baht (82 percent), while it moved up somewhat less in terms of the Taiwan dollar (19 percent) and was unchanged in terms of the Hong Kong dollar, which remains pegged to the U.S. dollar. Since year-end, the dollar has appreciated significantly further, on balance, in terms of the Indonesian rupiah and is little changed in terms of the Korean won.
The emergence of the financial crisis is causing a marked slowdown in economic activity in these Asian economies. During the first half of last year, real output continued to expand in most of these countries at about the robust rates enjoyed in 1996. Since the onset of the crisis, domestic demand in these countries has been greatly weakened by disruption in financial markets, substantially higher domestic interest rates, sharply reduced credit availability, and heightened uncertainty. In addition, macroeconomic policy has been tightened somewhat in Thailand, the Philippines, Indonesia, and Korea in connection with international support packages from the International Monetary Fund and other international financial institutions, and in connection with bilateral aid from individual countries. Announcement of agreement with the IMF on the support packages temporarily buoyed asset markets in each country, but concerns about the willingness or ability of governments to undertake difficult reforms and to achieve the stated macroeconomic goals remained. Additional measures to tighten the Korean program were announced in mid-December and included improved reserve management by the Bank of Korea, removal of certain interest rate ceilings, and acceleration of capital account liberalization and financial sector restructuring. With the encouragement of the authorities of the G-7 and other countries, banks in industrial countries have generally rolled over the majority of their foreign-currency-denominated claims on Korean banks during early 1998, as a plan for financing the external obligations of Korean financial institutions was being formulated. After the announcement on January 28 of an agreement in principle for the exchange of existing claims on Korean banks for restructured loans carrying a guarantee from the Korean government, the won stabilized. In the case of Indonesia, the support package was renegotiated and reaffirmed with the IMF in mid-January, though important elements of the approach of the Indonesian authorities remain in question as this report is submitted.
Signs that adjustment is proceeding within these Asian economies are already evident. For example, Thailand and Korea have registered strong improvements in their trade balances in recent months. Equity prices have recovered in Thailand, Indonesia, and Korea as well. At the same time, signs of rising inflation are beginning to emerge. In particular, consumer prices have accelerated in recent months in these three countries.
Spillover of the financial crisis to the economies of China, Hong Kong, and Taiwan has been limited to date. Steps to maintain the peg in Hong Kong have resulted in elevated interest rates, sharply lower equity prices, and increased uncertainty. However, in Taiwan, equity prices on balance rose nearly 18 percent in 1997 and have risen somewhat further so far this year. Real output growth in these three economies remained robust early in 1997 but may have slowed somewhat in China and Hong Kong in recent months.
Financial markets in some Latin American countries also came under pressure in reaction to the intensification of the crises in Asia in late 1997. After remaining quite stable earlier in the year, the Mexican peso dropped about 8 percent in terms of the U.S. dollar in late October; since then, it has changed little, on balance. In Brazil, exchange market turbulence abroad lowered market confidence in the authorities' ability to maintain that country's managed exchange rate regime; in response, short-term interest rates were raised 20 percentage points. The Brazilian exchange rate regime and the peg of the Argentine peso to the dollar have held. Real output growth in Mexico and Argentina remained healthy during 1997. In Brazil, growth fluctuated sharply during the year, with the high domestic interest rates and tighter macroeconomic policy stance that were put in place late in the year weakening domestic demand. During 1997, consumer price inflation slowed significantly in Mexico and Brazil and remained very low in Argentina.
In Japan, the economic expansion faltered in the second quarter as the effects on domestic demand of the April increase in the consumption tax exceeded expectations; in addition, crises in many of Japan's Asian trading partners late in the year weakened external demand and heightened concerns about the fragility of Japan's financial sector. The dollar rose about 10 percent against the yen during the first four months of 1997 as economic activity in the United States strengthened relative to that in Japan and as interest rate developments, including the FOMC policy move in March, favored dollar assets. These gains were temporarily reversed in May and June as market attention focused on the growing Japanese external surplus and tentative indications of improving real activity. However, subsequent evidence of disappointing output growth, revelations of additional problems in the financial sector, and concerns about the implications of turmoil elsewhere in Asia for the Japanese economy contributed to a rise in the dollar in terms of the yen during the second half of the year. On net, the dollar appreciated nearly 13 percent against the yen during 1997; so far in 1998, it has moved back down slightly, on balance.
In Germany and France, output growth rose in 1997 from its modest 1996 pace, boosted in both countries by the strong performance of net exports. Nevertheless, the dollar rose in terms of the mark and other continental European currencies through midyear, responding not only to stronger U.S. economic activity but also to concerns about the timetable for launching European Monetary Union (EMU), the process of the transition to a single currency, and the policy resolve of the prospective members. Later in the year the dollar moved back down slightly and then fluctuated narrowly in terms of the mark, as investors concluded that the transition to EMU was likely to be smooth, with the euro introduced on time on January 1, 1999, and with a broad membership. On balance, the dollar rose about 17 percent against the mark during 1997 and has varied little since then.
In the United Kingdom and Canada, real output growth was vigorous in 1997. All the components of U.K. domestic demand continued to expand strongly. In Canada, more robust private consumption spending and less fiscal restraint boosted real GDP growth from its moderate 1996 pace. Central bank official lending rates were raised in both countries during the year to address the threat of rising inflation. The value of the pound eased slightly in terms of the dollar over the year, whereas the Canadian dollar fell more than 4 percent in terms of the U.S. dollar. Much of the movement in the Canadian dollar came during the fourth quarter, as the crisis in Asia contributed to a weakening of global commodity prices and thus a likely lessening of Canadian export earnings. The Canadian dollar depreciated further early in 1998, reaching historic lows against the U.S. dollar in January, but it has rebounded with the tightening by the Bank of Canada in late January.
Long-term interest rates have generally declined in the
other G-10 countries since the end of 1996. Japanese long-term
rates have dropped about 90 basis points, with most of the
decrease coming in the second half of last year as evidence of sluggish
economic activity became more apparent.
German long-term rates have also fallen about 80 basis points as
expectations of tightening by the Bundesbank diminished, especially
toward the end of the year. The turbulence in Asian asset markets
likely contributed to inflows into bond markets in several of the
industrial countries, including the United States. Long-term rates in
the United Kingdom have declined about 150 basis points. Legislation to
increase the independence of the Bank of England and repeated
tightening of monetary policy during the year reassured markets
that some slowing of the very rapid pace of economic growth was
likely and that the Bank would be aggressive in resisting inflation in
the future. Three-month market interest rates generally have risen in
the other G-10 countries, although there have been exceptions. Rates
have moved up the most in Canada (more than 180 basis points) and
the United Kingdom (120 basis points), in response to several
increases in official lending rates. German rates have risen about 40
basis points. Short-term rates in the countries that are expected to
adopt a single currency on January 1 of next year converged toward the
relatively low levels of German and French rates, with Italian rates
declining more than 100 basis points over the year.
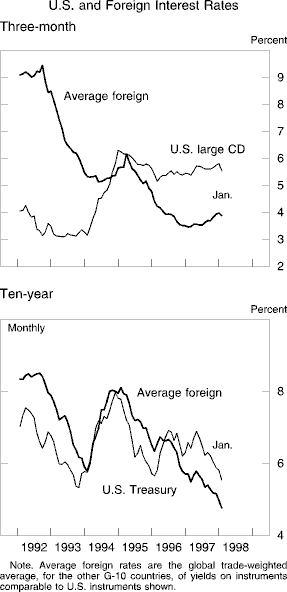
Equity prices in the foreign G-10 countries other than Japan moved up significantly in 1997. Despite some volatility in these markets, particularly in the fourth quarter following severe equity price declines in many Asian markets, increases in equity price indexes over 1997 ranged from 17 percent in the United Kingdom to almost 60 percent in Italy. In contrast, equity prices fell 20 percent in Japan. To date this year, equity prices in the industrial countries generally have risen.
The price of gold declined more than 20 percent in 1997 and fell further in early 1998, reaching lows not seen since the late 1970s. Open discussion and, in some cases, confirmation of central bank sales of gold contributed to the price decline. Downward adjustment of expectations of inflation in the industrial countries in general may have added to the selling pressure on gold. More recently, the price of gold has moved up slightly, on net.
1. Over the past three years, the Bureau of Labor Statistics has introduced a number of technical changes in its procedures for compiling the CPI, with the aim of obtaining a more accurate measure of price change. Typically, the changes have only a small effect on the results for any particular year, but their cumulative effects are somewhat larger and are tending to hold down the reported increases of recent years relative to what would have been reported with no changes in procedures. Apart from the procedural changes, the reported rate of rise from 1998 forward will also be affected by an updating of the CPI market basket, an action that the BLS undertakes approximately every ten years.
2. This index weights currencies in terms of the importance of each country in determining the global competitiveness of U.S. exports and adjusts nominal exchange rates for changes in relative consumer prices.
Home | News and events | Monetary policy | February 1998 report
Accessibility | Contact Us
Last update: February 24, 1998 10:00 AM