FRB: Humphrey-Hawkins Report, July 22, 1999
The Federal Reserve Board eagle logo links to home page
Monetary Policy Report submitted to the Congress on July 22, 1999, pursuant to the Full Employment and Balanced Growth Act of 1978


Section 2

ECONOMIC AND FINANCIAL DEVELOPMENTS IN 1999

The economy has continued to grow rapidly so far this year. Real gross domestic product rose more than 4 percent at an annual rate in the first quarter of 1999, and available data point to another significant gain in the second quarter. 1 The rise in activity has been brisk enough to produce further substantial growth of employment and a reduction in the unemployment rate to 4-1/4 percent. Growth in output has been driven by strong domestic demand, which in turn has been supported by further increases in equity prices, by the continuing salutary effects of government saving and inflows of foreign investment on the cost of capital, and by more smoothly functioning financial markets as the turbulence that marked the latter part of 1998 subsided. Against the background of the easing of monetary policy last fall and continuing robust economic activity, investors became more willing to advance funds to businesses; risk spreads have receded and corporate debt issuance has been brisk.

Chart of Change in real GDP

Inflation developments were mixed over the first half of the year. The consumer price index increased more rapidly owing to a sharp rebound in energy prices. Nevertheless, price inflation outside of the energy area generally remained subdued despite the slight further tightening of labor markets, as sizable gains in labor productivity and ample industrial capacity held down price increases.

The Household Sector

Consumer Spending

Real personal consumption expenditures surged 6-3/4 percent at an annual rate in the first quarter, and more recent data point to a sizable further advance in the second quarter. The underlying fundamentals for the household sector have remained extremely favorable. Real incomes have continued to rise briskly with strong growth of employment and real wages, and consumers have benefited from substantial gains in wealth. Not surprisingly, consumer confidence--as measured, for example, by the University of Michigan Survey Research Center (SRC) and Conference Board surveys--has remained quite upbeat in this environment.

Chart of Change in real income and consumption

Growth of consumer spending in the first quarter was strong in all expenditure categories. Outlays for durable goods rose sharply, reflecting sizable increases in spending on electronic equipment (especially computers) and on a wide range of other goods, including household furnishings. Purchases of cars and light trucks remained at a high level, supported by declining relative prices as well as by the fundamentals that have buoyed consumer spending more generally. Outlays for nondurable goods were also robust, reflecting in part a sharp increase in expenditures for apparel. Finally, spending on services climbed steeply as well early this year, paced by sizable increases in spending on recreation and brokerage services. In the second quarter, consumers apparently boosted their purchases of motor vehicles further. In all, real personal consumption expenditures rose at more than a 4 percent annual rate in April and May, an increase that is below the first-quarter pace but is still quite rapid by historical standards.

Real disposable income increased at an annual rate of 3-1/2 percent in the first quarter, with the strong labor market generating marked increases in wages and salaries. Even so, income grew less rapidly than expenditures, and the personal saving rate declined further; indeed, by May the saving rate had moved below negative 1 percent. Much of the decline in the saving rate in recent years can be explained by the sharp rise in household net worth relative to disposable income that is associated with the appreciation of households' stock market assets since 1995. This rise in wealth has given households the wherewithal to spend at levels beyond what current incomes would otherwise allow. As share values moved up further in the first half of this year, the wealth-to-income ratio continued to edge higher despite the absence of saving out of disposable income.

Chart of Wealth and savings

Residential Investment

Housing activity remained robust in the first half of this year. In the single-family sector, positive fundamentals and unseasonably good weather helped boost starts to a pace of 1.39 million units in the first quarter--the highest level of activity in twenty years. This extremely strong level of building activity strained the availability of labor and some materials; as a result, builders had trouble achieving the usual seasonal increase in the second quarter, and starts edged off to a still-high pace of 1.31 million units. Home sales moderated in the spring: Sales of both new and existing homes were off some in May from their earlier peaks, and consumers' perceptions of homebuying conditions as measured by the Michigan SRC survey have declined from the very high marks recorded in late 1998 and early this year. Nonetheless, demand has remained quite robust, even in the face of a backup in mortgage interest rates: Builders' evaluations of new home sales remained very high at mid-year, and mortgage applications for home purchases showed strength into July.
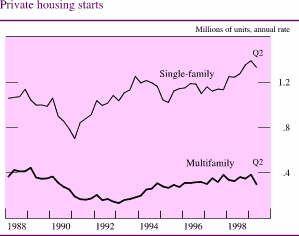
Chart of Private housing starts

With strong demand pushing up against limited capacity, home prices have risen substantially, although evidence is mixed as to whether the rate of increase is picking up. The quality-adjusted price of new homes rose 5 percent over the four quarters ended in 1999:Q1, up from 3-1/4 percent over the preceding four-quarter period. The repeat sales index of existing home prices also rose about 5 percent between 1998:Q1 and 1999:Q1, but this series posted even larger increases in the year-earlier period. On the cost side, tight supplies have led to rising prices for some building materials; prices of plywood, lumber, gypsum wallboard, and insulation have all moved up sharply over the past twelve months. In addition, hourly compensation costs have been rising relatively rapidly in the construction sector.

Starts of multifamily units surged to 384,000 at an annual rate in the first quarter and ran at a pace a bit under 300,000 units in the second quarter. As in the single-family sector, demand has been supported by strong fundamentals, builders have been faced with tight supplies of some materials, and prices have been rising briskly: Indeed, apartment property values have been increasing at around a 10 percent annual rate for three years now.

Household Finance

In addition to rising wealth and rapid income growth, the strong expenditures of households on housing and consumer goods over the first half of 1999 were encouraged by the decline in interest rates in the latter part of 1998. Households borrowed heavily to finance spending. Their debt expanded at a 9-1/2 percent annual rate in the first quarter, up from the 8-3/4 percent pace over 1998, and preliminary data for the second quarter indicate continued robust growth. Mortgage borrowing, fueled by the vigorous housing market and favorable mortgage interest rates, was particularly brisk in the first quarter, with mortgage debt rising at an annual rate of 10 percent. In the second quarter, mortgage rates moved up considerably, but preliminary data indicate that borrowing was still substantial.

Consumer credit growth accelerated in the first half of 1999. It expanded at about an 8 percent annual rate compared with 5-1/2 percent for all of 1998. The growth of nonrevolving credit picked up, reflecting brisk sales and attractive financing rates for automobiles and other consumer durable goods. The expansion of revolving credit, which includes credit card loans, slowed a bit from its pace in 1998.

Households apparently have not encountered added difficulties meeting the payments associated with their greater indebtedness, as measures of household financial stress improved a bit on balance in the first quarter. Personal bankruptcies dropped off considerably, although part of the decline may reflect the aftermath of a surge in filings in late 1998 that occurred in response to pending legislation that would limit the ability of certain debtors to obtain forgiveness of their obligations. Delinquency rates on several types of household loans edged lower. Delinquency and charge-off rates on credit card debt moved down from their 1997 peaks but remained at historically high rates. A number of banks continued to tighten credit card lending standards this year, as indicated by banks' responses to Federal Reserve surveys.
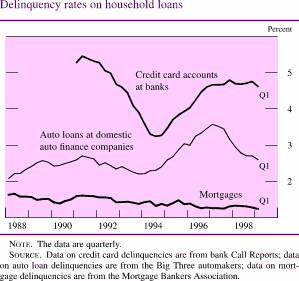
Chart of Delinquency rates on household loans

The Business Sector

Fixed Investment

Real business fixed investment appears to have posted another huge increase over the first half of 1999. Investment spending continued to be driven by buoyant expectations of sales prospects as well as by rapidly declining prices of computers and other high-tech equipment. In recent quarters, spending also may have been boosted by the desire to upgrade computer equipment in advance of the rollover to the year 2000. Real investment has been rising rapidly for several years now; indeed, the average increase of 10 percent annually over the past five years represents the most rapid sustained expansion of investment in more than thirty years. Although a growing portion of this investment has gone to cover depreciation on purchases of short-lived equipment, the investment boom has led to a notable upgrading and expansion of the capital stock and in many cases has embodied new technologies. These factors likely have been important in the nation's improved productivity performance over the past few years.
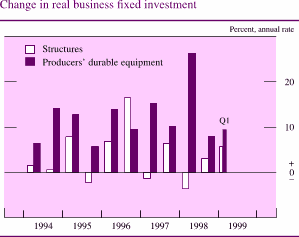
Chart of Change in real business fixed investment

Real outlays for producers' durable equipment increased at an annual rate of 9-1/2 percent in the first quarter of the year, after having surged nearly 17 percent last year, and may well have re-accelerated in the second quarter. Outlays on communications equipment were especially robust in the first quarter, driven by the ongoing effort by telecommunications companies to upgrade their networks to provide a full range of voice and data transmission services. Purchases of computers and other information processing equipment were also up notably in the first quarter, albeit below last year's phenomenal spending pace, and shipments of computers surged again in April and May. Shipments of aircraft to domestic carriers apparently soared in the second quarter, and business spending on motor vehicles, including medium and heavy trucks as well as light vehicles, has remained extremely strong as well.

Real business spending for nonresidential structures has been much less robust than for equipment, and spending trends have varied greatly across sectors of the market. Real spending on office buildings and lodging facilities has been increasing impressively, while spending on institutional and industrial structures has been declining--the last reflecting ample capacity in the manufacturing sector. In the first quarter of this year, overall spending on structures was reported in the national income and product accounts to have moved up at a solid 5-3/4 percent annual rate, reflecting a further sharp increase in spending on office buildings and lodging facilities. However, revised source data indicate a somewhat smaller first-quarter increase in nonresidential construction and also point to a slowing in activity in April and May from the first-quarter pace.

Inventory Investment

Inventory-sales ratios in many industries dropped considerably early this year, as the pace of stockbuilding by nonfarm businesses, which had slowed notably over 1998, remained well below the surge of consumer and business spending in the first quarter. Although production picked up some in the spring, final demand remained quite strong, and available monthly data suggest that businesses accumulated inventories in April and May at a rate not much different from the modest first-quarter pace.
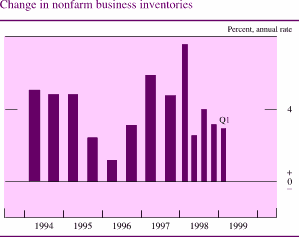
Chart of Change in real nonfarm business inventories

In the motor vehicle sector, makers geared up production in the latter part of 1998 to boost inventories from their low levels after last summer's strikes. Nevertheless, as with the business sector overall, motor vehicle inventories remained on the lean side by historical standards in the early part of this year as a result of surprisingly strong vehicle sales. As a consequence, manufacturers boosted the pace of assemblies in the second quarter to the highest level in twenty years. With no noticeable signs of a slowing in demand, producers have scheduled third-quarter output to remain at the lofty heights of the second quarter.

Corporate Profits and Business Finance

The economic profits of nonfinancial U.S. corporations rose considerably in the first quarter, even after allowing for the depressing effect in the fourth quarter of payments associated with the settlement between the tobacco companies and the states. Despite the growth of profits, capital expenditures by nonfinancial businesses continued to outstrip internal cash flow. Moreover, borrowing requirements were enlarged by the net reduction in equity outstanding, as the substantial volume of retirements from merger activity and share repurchase programs exceeded the considerable volume of gross issuance of both initial and seasoned public equities. As a result, businesses continued to borrow at a brisk pace: Aggregate debt of the nonfinancial business sector expanded at a 9-1/2 percent annual rate in the first quarter. As financial market conditions improved after the turmoil of the fall, businesses returned to the corporate bond and commercial paper markets for funding, and corporate bond issuance reached a record high in March. Some of the proceeds were used to pay off bank loans, which had soared in the fall, and these repayments curbed the expansion of business loans at banks. Partial data for the second quarter indicate that borrowing by nonfinancial businesses slowed somewhat.
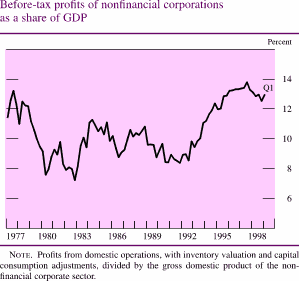
Chart of Before-tax profits of Nonfinancial corporations 
as a share of GDP

Chart of Gross corporate bond issuance

Risk spreads have receded on balance this year from their elevated levels in the latter part of 1998. From the end of December 1998 through mid-July, investment-grade corporate bond yields moved up from historically low levels, but by less than yields on comparable Treasury securities, and the spread between these yields narrowed to a level somewhat above that prevailing before the Russian crisis. The rise in investment-grade corporate bond yields was restrained by investors' apparently increased willingness to hold such debt, as growing optimism about the economy and favorable earnings reports gave investors more confidence about the prospective financial health of private borrowers. Yield spreads on below-investment-grade corporate debt over comparable Treasury securities, which had risen considerably in the latter part of 1998, also retreated. But in mid-July, these spreads were still well above the thin levels prevailing before the period of financial turmoil but in line with their historical averages.

Chart of Spreads of corporate bond yields over Treasury 
security yields

In contrast to securities market participants, banks' attitudes toward business lending apparently became somewhat more cautious over the first half of the year, according to Federal Reserve surveys. The average spread of bank lending rates over the FOMC's intended federal funds rate remained elevated. On net, banks continued to tighten lending terms and standards this year, although the percentage that reported tightening was much smaller than in the fall.

The overall financial condition of nonfinancial businesses was strong over the first half of the year, although a few indicators suggested a slight deterioration. In the first quarter, the ratio of net interest payments to corporate cash flow remained close to the modest levels of 1998, as low interest rates continued to hold down interest payments. Delinquency rates for commercial and industrial loans from banks ticked up, but they were still modest by historical standards. Similarly, over the first half of the year, business failures--measured as the ratio of liabilities of failed businesses to total liabilities--stepped up from the record low in 1998. The default rate on below-investment-grade bonds rose to its highest level in several years, an increase stemming in part from defaults by companies whose earnings were impaired by the drop in oil and other commodity prices last year. The total volume of business debt that was downgraded exceeded slightly the volume of debt that was upgraded.

The Government Sector

Federal Government

The incoming news on the federal budget continues to be quite favorable. Over the first eight months of fiscal year 1999--the period from October through May--the unified budget registered a surplus of about $41 billion, compared with $16 billion during the comparable period of fiscal 1998. If the latest projections from the Office of Management and Budget and the Congressional Budget Office are realized, the unified budget for fiscal 1999 as a whole will show a surplus of around $100 billion to $120 billion, or more than 1 percent of GDP--a striking turnaround from the outsized budget deficits of previous years, which approached 5 percent of GDP in the early 1990s.
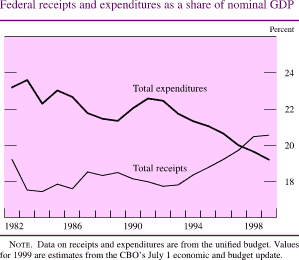
Chart of Federal receipts and expenditures as a share of nominal GDP

As a result of this turnaround, the federal government is now contributing positively to the pool of national saving. In fact, despite the recent drop in the personal saving rate, gross saving by households, businesses, and governments has remained above 17 percent of GDP in recent quarters--up from the 14 percent range that prevailed in the early 1990s. This well-maintained pool of national savings, together with the continued willingness of foreigners to finance our current account deficits, has helped hold down the cost of capital, thus contributing to our nation's investment boom.
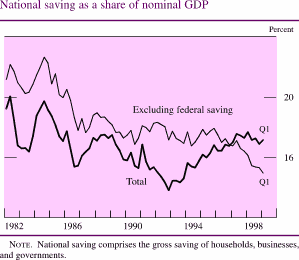
Chart of National saving as a share of nominal GDP

This year's increase in the federal surplus has reflected continued rapid growth of receipts in combination with a modest increase in outlays. Federal receipts were 5 percent higher in the first eight months of fiscal 1999 than in the year-earlier period. With profits leveling off from last year, receipts of corporate taxes have stagnated so far this fiscal year. However, individual income tax payments are up appreciably, reflecting the solid gains in household incomes and perhaps also a rise in capital gains realizations large enough to offset last year's reduction in capital gains tax rates. At the same time, federal outlays increased only 2-1/2 percent in nominal terms and barely at all in real terms during the first eight months of the fiscal year, relative to the comparable year-earlier period. Spending growth has been restrained in major portions of both the discretionary (notably, defense) and nondiscretionary (notably, net interest, social security, and Medicare) categories--although this year's emergency supplemental spending bill, at about $14 billion, was somewhat larger than similar bills in recent years.

As for the part of federal spending that is counted in GDP, real federal outlays for consumption and gross investment, which had changed little over the past few years, declined at a 2 percent annual rate in the first quarter of 1999. A drop in real defense outlays more than offset a rise in nondefense expenditures in the first quarter. And despite the military action in the Balkans and the recent emergency spending bill, defense spending appears to have declined in the second quarter as well.

The budget surpluses of the past two years have led to a notable decline in the stock of federal debt held by private investors as a share of GDP. Since its peak in March 1997, the total volume of Treasury debt held by private investors has fallen by nearly $130 billion. The Treasury has reduced its issuance of interest-bearing marketable debt in fiscal 1999. The decrease has been concentrated in nominal coupon issues; in 1998, by contrast, the Treasury retired both bill and coupon issues in roughly equal measure. Offerings of inflation-indexed securities have remained an important part of the Treasury's overall borrowing program: Since the beginning of fiscal 1999, the Treasury has sold nearly $31 billion of such securities.
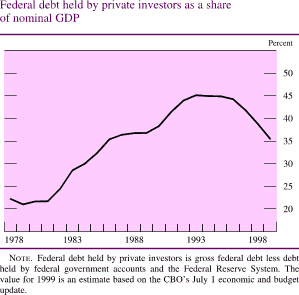
Chart of Net federal debt as a share of nominal GDP

State and Local Governments

The fiscal condition of state and local governments has remained quite positive as well. Revenues have been boosted by increases in tax collections due to strong growth of private-sector incomes and expenditures--increases that were enough to offset an ongoing trend of tax cuts. Meanwhile, outlays have continued to be restrained. In all, at the state level, fiscal 1999 looks to have been the seventh consecutive year of improving fiscal positions; of the forty-six states whose fiscal years ended on June 30, all appear to have run surpluses in their general funds.

Real expenditures for consumption and gross investment by states and localities, which had been rising only moderately through most of 1998, jumped at a 7-3/4 percent annual rate in the first quarter of this year. This increase was driven by a surge in construction expenditures that was helped along by unseasonably favorable weather, and spending data for April and May suggest that much of this rise in construction spending was offset in the second quarter. As for employment, state and local governments added jobs over the first half of the year at about the same pace as they did last year.

Debt of state and local governments expanded at a 5-1/2 percent rate in the first quarter. The low interest rate environment and strong economy encouraged the financing of new projects and the refunding of outstanding higher-rate debt. Borrowing slowed to a more modest pace in the second quarter, as yields on long-dated municipal bonds moved up, but by less than those on comparable Treasury securities. The credit quality of municipal securities improved further over the first half of the year, with more issues being upgraded than downgraded.
External Sector

Trade and the Current Account

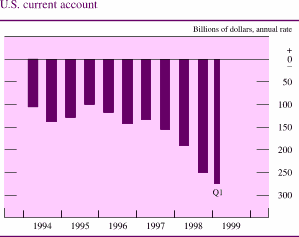
The current account deficit reached $274 billion at an annual rate in the first quarter of 1999, a bit more than 3 percent of GDP, compared with $221 billion and 2-1/2 percent of GDP for 1998. A widening of the deficit on trade in goods and services, to $215 billion at an annual rate in the first quarter from $173 billion in the fourth quarter of 1998, accounted for the deterioration in the current account balance. Data for April and May indicate that the trade deficit increased further in the second quarter.

Chart of U.S. current account

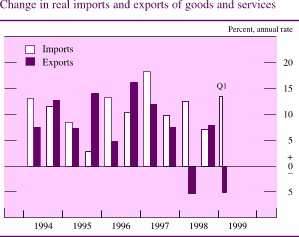
The quantity of imports of goods and services again grew vigorously in the first quarter. The annual rate of growth of imports, at 13-1/2 percent, continued the rapid pace seen over 1998 and reflected the strength of U.S. domestic demand and the effects of past dollar appreciation. Imports of consumer goods, automotive products, computers, and semiconductors were particularly robust. Preliminary data for April and May suggest that real import growth remained strong, as nominal imports rose steadily and non-oil import prices posted a moderate decline.

Chart of Change in real imports and exports of goods and services

The volume of exports of goods and services declined at an annual rate of 5 percent in the first quarter. The decline partially reversed the strong increase in the fourth quarter of last year. The weakness of economic activity in a number of U.S. trading partners and the strength of the dollar damped demand for U.S. exports. Declines were registered in aircraft, machinery, industrial supplies, and agricultural products. Exports to Asia generally turned down in the first quarter from the elevated levels recorded in the fourth quarter, when they were boosted by record deliveries of aircraft to the region. Preliminary data for April and May suggest that real exports advanced slightly.

Capital Account

Foreign direct investment in the United States and U.S. direct investment abroad remained robust in the first quarter, reflecting brisk cross-border merger and acquisition activity. On balance, net capital flows through direct investment registered a modest outflow in the first quarter compared with a huge net inflow in the fourth quarter. Fourth-quarter inflows were swollen by several large mergers. Net foreign purchases of U.S. securities also continued to be quite sizable but again were well below the extraordinary pace of the fourth quarter. Most of the slowdown in the first quarter is attributable to a reduced demand for Treasury securities on the part of private investors abroad. But capital inflows from foreign official sources also slowed in the first quarter. U.S. residents on net sold foreign securities in the first quarter, but at a slower rate than in the previous quarter.

The Labor Market

Employment and Labor Supply

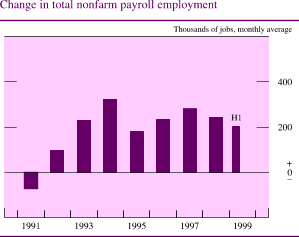
Labor demand remained very strong during the first half of 1999. Payroll employment increased about 200,000 per month on average, which, although less rapid than the 244,000 pace registered over 1998, is faster than the growth of the working-age population. With the labor force participation rate remaining about flat at just over 67 percent, the unemployment rate edged down further from an average of 4-1/2 percent in 1998 to 4-1/4 percent in the first half of this year--the lowest unemployment rate seen in the United States in almost thirty years. Furthermore, the pool of potential workers, including not just the unemployed but also individuals who are out of the labor force but report that they want a job, declined late last year to the lowest share of the labor force since collection of these data began in 1970--and it has remained near that low this year. Not surprisingly, businesses in many parts of the country have perceived workers to be in very short supply, as evidenced by high levels of help-wanted advertising and surveys showing substantial difficulties in filling job openings.

Chart of Net change in total nonfarm payroll employment

Chart of Measures of labor utilization

Employment gains in the private service-producing sector remained sizable in the first six months of the year and more than accounted for the rise in nonfarm payrolls over this period. Payrolls continued to rise briskly in the services industry, with firms providing business services (such as help supply services and computer services) adding jobs especially rapidly. Job gains were quite sizable in retail trade as well. Within the service-producing sector, only the finance, insurance, and real estate industry has slowed the pace of net hiring from last year's rate, reflecting, in part, a slower rate of job gains in the mortgage banking industry as the refinancing wave has ebbed.

Within the goods-producing sector, the boom in construction activity pushed payrolls in that industry higher in the first six months of this year. But in manufacturing, where employment began declining more than a year ago in the wake of a drop in export demand, payrolls continued to fall in the first half of 1999; in all, nearly half a million factory jobs have been shed since March 1998. Despite these job losses, manufacturing output continued to rise in the first half of this year, reflecting large gains in labor productivity.

Labor Costs and Productivity

Growth in hourly compensation, which had been on an upward trend since 1995, appears to have leveled off and, by some measures, has slowed in the past year. According to the employment cost index (ECI), hourly compensation costs increased 3 percent over the twelve months ended in March, down from 3-1/2 percent over the preceding twelve-month period. Part of both the earlier acceleration and more recent deceleration in the ECI apparently reflected swings in commissions, bonuses, and other types of ``variable'' compensation, especially in the finance, insurance, and real estate industry. But in addition, part of the recent deceleration probably reflects the influence of restrained price inflation in tempering nominal wage increases. Although down from earlier increases, the 3 percent rise in the ECI over the twelve months ended in March was well above the rise in prices over this period and therefore was enough to generate solid gains in workers' real pay.

The deceleration in the ECI through March has been most pronounced in the wages and salaries component, whose twelve-month change slowed 3/4 percentage point from a year earlier. More recently, data on average hourly earnings of production or nonsupervisory workers may point to a leveling off, but no further slowing, of wage growth: This series was up at about a 4 percent annual rate over the first six months of this year, about the same as the increase over 1998. Growth in the benefits component of the ECI slowed somewhat as well in the year ended in March, to a 2-1/4 percent increase. However, employers' costs for health insurance are one component of benefits that has been rising more rapidly of late. After showing essentially no change from 1994 through 1996, the ECI for health insurance accelerated to a 3-3/4 percent pace over the twelve months ended in March.

Chart of Measures of change in hourly compensation

A second measure of hourly compensation--the Bureau of Labor Statistics' measure of compensation per hour in the nonfarm business sector, which is derived from compensation information from the national accounts--has been rising more rapidly than the ECI in the past few years and has also decelerated less so far this year. Nonfarm compensation per hour increased 4 percent over the four quarters ended in the first quarter of 1999, 1 percentage point more than the rise in the ECI over this period. One reason these two compensation measures may diverge is that the ECI does not capture certain forms of compensation, such as stock options and hiring, retention, and referral bonuses, whereas nonfarm compensation per hour does measure these payments. 2 Although the two compensation measures differ in numerous other respects as well, the series' divergence may lend support to anecdotal evidence that these alternative forms of compensation have been increasing especially rapidly in recent years. However, because nonfarm compensation per hour can be revised substantially, one must be cautious in putting much weight on the most recent quarterly figures from this series.

Rapid productivity growth has made it possible to sustain these increases in workers' compensation without placing great pressure on businesses' costs. Labor productivity in the nonfarm business sector posted another sizable gain in the first quarter of 1999, and the increase over the four quarters ended in the first quarter of 1999 was 2-1/2 percent. Indeed, productivity has increased at a 2 percent pace since 1995--well above the trend of roughly 1 percent per year that had prevailed over the preceding two decades. 3 This recent productivity performance is all the more impressive given that businesses are reported to have had to divert considerable resources toward avoiding computer problems associated with the century date change, and given as well that businesses may have had to hire less-skilled workers than were available earlier in the expansion when the pool of potential workers was not so shallow. Part of the strength in productivity growth over the past few years may have been a cyclical response to the rapid growth of output over this period. But productivity may also be reaping a more persistent payoff from the boom in business investment and the accompanying introduction of newer technologies that have occurred over the past several years.

Chart of Change in output per hour

Even these impressive gains in labor productivity may not have kept up fully with increases in firms' real compensation costs of late. Over the past two years, real compensation, measured by the ECI relative to the price of nonfarm business output, has increased the same hefty 2-1/2 percent per year as labor productivity; however, measured instead using nonfarm compensation per hour, real compensation has increased somewhat more than productivity over this period, implying a rising share of compensation in total national income. A persistent period of real compensation increases in excess of productivity growth would reduce firms' capacity to absorb further wage gains without putting upward pressure on prices.

Prices

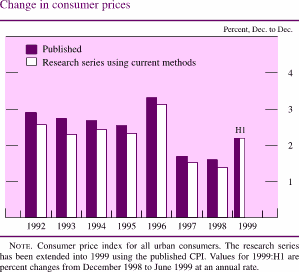
Price inflation moved up in early 1999 from a level in 1998 that was depressed by a transitory drop in energy and other commodity prices. After increasing only about 1-1/2 percent over 1998, the consumer price index rose at a 2-1/4 percent annual rate over the first six months of this year, driven by a sharp turnaround in prices of gasoline and heating oil. However, the so-called ``core'' CPI, which excludes food and energy items, rose at an annual rate of only 1.6 percent over this period--a somewhat smaller increase than that registered over 1998 once adjustment is made for the effects of changes in CPI methodology: According to a new research series from the Bureau of Labor Statistics (BLS), the core CPI would have increased 2.2 percent over 1998 had 1999 methods been in place in that year. 4

Chart of Change in consumer prices

Chart of Change in consumer prices excluding food and energy

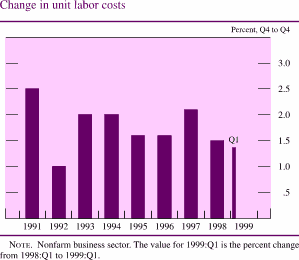
The moderation of the core CPI in recent years has reflected a variety of factors that have helped hold inflation in check despite what has been by all accounts a very tight labor market. Price increases have been damped by substantial growth in manufacturing capacity, which has held plant utilization rates in most industries at moderate (and in some cases subpar) levels, thereby reinforcing competitive pressures in product markets. Furthermore, rapid productivity growth helped hold increases in unit labor costs to low levels even as compensation growth was picking up last year. The rise in compensation itself has been constrained by moderate expectations of inflation, which have been relatively stable. According to the Michigan SRC survey, the median of one-year-ahead inflation expectations, which was about 2-1/2 percent late last year, averaged 2-3/4 percent in the first half of this year.

Chart of Change in unit labor costs

The quiescence of inflation expectations, at least through the early part of this year, in turn may have come in part from the downward movement in overall inflation last year resulting from declines in prices of imports and of oil and other commodities. These price declines have not been repeated more recently. This year's rise in energy prices is the clearest example, but commodity prices more generally have been turning up of late. The Journal of Commerce industrial price index has moved up about 6 percent so far this year after having declined about 10 percent last year, with especially large increases posted for prices of lumber, plywood, and steel. These price movements are starting to be seen at later stages of processing as well: The producer price index for intermediate materials excluding food and energy, which gradually declined about 2 percent over the fifteen months through February 1999, retraced about half of that decrease by June. Furthermore, non-oil import prices, although continuing to fall this year, have moved down at a slower rate than that of the past couple of years when the dollar was rising sharply in foreign exchange markets. Non-oil import prices declined at a 1-1/4 percent annual rate over the first half of 1999, after having fallen at a 3 percent rate, on average, over 1997 and 1998.

Some other broad measures of prices also showed evidence of acceleration early this year. The chain-type price index for GDP--which covers prices of all goods and services produced in the United States--rose at about a 1-1/2 percent annual rate in the first quarter, up from an increase of about 1 percent last year. A portion of this acceleration reflected movements in the chain-type price index for personal consumption expenditures (PCE) that differed from movements in the CPI.

3. Alternative measures of price change
Percent, annual rate  
Chart of table rule

Price measure


1996:Q4
to
1997:Q4
1997:Q4
to
1998:Q4
1998:Q4
to
1999:Q1
Fixed weight
     
Consumer price index
1.9 1.5 1.5
    Excluding food and energy
2.2 2.4 1.6
       
Chain type
     
Gross domestic product
1.7 0.9 1.6
Gross domestic purchases
1.3 0.4 1.2
Personal consumption expenditures 1.5 0.7 1.2
    Excluding food and energy
1.6 1.2 1.3
Chart of table rule

             Note.  A fixed-weight index uses quantity weights from the base year
to aggregate prices from each distinct item category. A chain-type index is the
geometric average of two fixed-weight indexes and allows the weights to
change each year. Changes are based on quarterly averages.
 

Although the components of the CPI are key inputs into the PCE price index, the two price measures differ in a variety of respects: They use different aggregation formulas; the weights are derived from different sources; the PCE measure does not utilize all components of the CPI; and the PCE measure is broader in scope, including not just the out-of-pocket expenditures by households that are captured by the CPI, but also the portion of expenditures on items such as medical care and education that are paid by insurers or governments, consumption of items such as banks' checking services that are provided without explicit charge, and expenditures made by nonprofit institutions. Although PCE prices typically rise a bit less rapidly than the CPI, the PCE price measure was unusually restrained relative to the CPI in the few years through 1998, reflecting a combination of the above factors.

Last year's sharp drop in retail energy prices and the subsequent rebound this spring reflected movements in the price of crude oil. The spot price of West Texas intermediate (WTI) crude oil, which had stood at about $20 per barrel through most of 1997, dropped sharply over 1998 and reached $11 per barrel by the end of the year, reflecting in part a weakening in demand for oil from the distressed Asian nations and increases in supply from Iraq and other countries. But oil prices jumped this year as the OPEC nations agreed on production restraints aimed at firming prices, and the WTI spot price reached $18 per barrel in April and has moved still higher more recently. As a result, gasoline prices, which dropped 15 percent over 1998, reversed almost all of that decline over the first six months of this year. Prices of heating fuel also rebounded after dropping in 1998. In all, the CPI for energy rose at a 10 percent annual rate over the December-to-June period.

Consumer food prices increased moderately over the first six months of the year, rising at a 1-3/4 percent annual rate. Despite the upturn in commodity prices generally, farm prices have remained quite low and have helped to hold down food price increases. Spot prices of wheat, soybeans, and sugar have moved down further this year from already depressed levels at the end of 1998, and prices of corn and coffee have remained low as well.

The CPI for goods other than food and energy declined at about a 1/2 percent annual rate over the first six months of 1999, after having risen 1-1/4 percent over 1998. The 1998 increase reflected a sharp rise in tobacco prices in December associated with the settlement of litigation between the tobacco companies and the states; excluding tobacco, the CPI for core goods was about flat last year. The decline in the first half of this year was concentrated in durable goods, where prices softened for a wide range of items, including motor vehicles. The CPI for non-energy services increased about 2-1/2 percent at an annual rate in the first half, down a little from the increase over 1998. Increases in the CPI for rent of shelter have slowed thus far in 1999, rising at a 2-1/2 percent annual rate versus a 3-1/4 percent rise last year. However, airfares and prices of medical services both have been rising more rapidly so far this year.

Debt and the Monetary Aggregates

Debt and Depository Intermediation

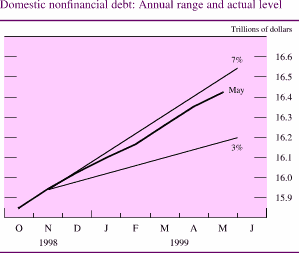
The total debt of the U.S. household, government, and nonfinancial business sectors increased at about a 6 percent annual rate from the fourth quarter of 1998 through May, a little above the midpoint of its growth range of 3 percent to 7 percent. Nonfederal debt expanded briskly at about a 9 percent annual pace, in association with continued strong private domestic spending on consumer durable goods, housing, and business investment. By contrast, federal debt contracted at a 3 percent annual rate, as budget surpluses reined in federal government financing needs.

Chart of Domestic nonfinancial debt: Annual range and actual level

Credit extended by depository institutions slumped over the first half of 1999, after having expanded quite briskly in 1998. A fair-sized portion of the expansion in 1998 came in the fourth quarter and stemmed from the turmoil in financial markets. In that turbulent environment, depository institutions postponed securitization of mortgages, and businesses shifted their funding demand from securities markets to depository institutions, where borrowing costs in some cases were governed by pre-existing lending commitments. Depository institutions also acquired mortgage-backed securities and other private debt instruments in volume, as their yields evidently rose relative to depository funding costs. As financial stresses unwound, securitization resumed, business borrowers returned to securities markets, and net purchases of securities slowed. From the fourth quarter of 1998 through June, bank credit rose at a 3 percent annualized pace, after adjusting for the estimated effects of mark-to-market accounting rules.

Monetary Aggregates

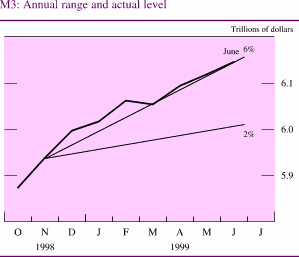
The growth of M3, the broadest monetary aggregate, slowed appreciably over the first half of 1999. M3 expanded at a 6 percent annual pace from the fourth quarter of 1998 through June of this year, placing this aggregate at the top of the 2 percent to 6 percent price-stability growth range set by the FOMC at its February meeting. With depository credit growing modestly, depository institutions trimmed the managed liabilities included in M3, such as large time deposits. Growth of institutional money market mutual funds also moderated from its rapid pace in 1998. Rates on money market funds tend to lag the movements in market rates because the average rate of return on the portfolio of securities held by the fund changes more slowly than market rates. In the fall, rates on institutional money market funds did not decline as fast as market rates after the Federal Reserve eased monetary policy, and the growth of these funds soared. As rates on these funds moved back into alignment with market rates this year, growth of these funds ebbed.

Chart of M3: Annual range and actual level

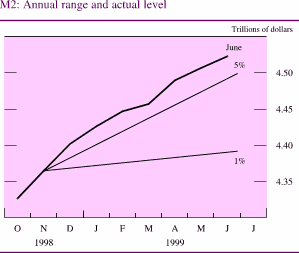
Chart of M2: Annual range and actual level

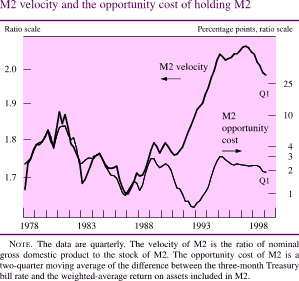
M2 advanced at a 6-1/4 percent annual rate from the fourth quarter of 1998 through June. M2 growth had been elevated in late 1998 by unsettled financial conditions, which raised the demand for liquid money balances, and by the easing of monetary policy, which reduced the opportunity costs of holding the assets included in the monetary aggregates. M2 growth moderated over the first half of 1999, as the heightened demand for money waned; in June this aggregate was above its 1 percent to 5 percent price-stability growth range. The growth in M2 over the first half of the year again outpaced that of nominal income, although the decline in M2 velocity--the ratio of nominal income to M2--was at a slower rate than in 1998. The decline this year reflected in part a continuing lagged response to the policy easing in the fall; however, the drop in M2 velocity was again larger than predicted on the basis of the historical relationship between the velocity of M2 and the opportunity costs of holding M2--measured as the difference between the rate on three-month Treasury bills and the average return on M2 assets. The reasons for the decline of M2 velocity this year are not clear; the drop extends a trend in velocity evident since mid-1997 and may in part owe to households' efforts to allocate some wealth to the assets included in M2, such as deposits and money market mutual fund shares, after several years of substantial gains in equity prices that greatly raised the share of wealth held in equities.

Chart of M2 velocity and the opportunity cost of holding M2

M1 increased at a 2 percent annualized pace from the fourth quarter of 1998 through June, in line with its advance in 1998. The currency component of M1 expanded quite rapidly. The strength appeared to stem from domestic, rather than foreign, demand, perhaps reflecting vigorous consumer spending, although currency growth was more robust than might be expected for the rise in spending. The deposits in M1--demand deposits and other checkable deposits--contracted further, as retail sweep programs continued to be introduced. These programs, which first began in 1994, shift funds from a depositor's checking account, which is subject to reserve requirements, to a special-purpose money market deposit account, which is not. Funds are then shifted back to the checking account when the depositor's account balance falls below a given level. The depository institution benefits from a retail sweep program because the program cuts its reserve requirement and thus the amount of non-interest-bearing reserve balances that it must hold at its Federal Reserve Bank. New sweep programs depressed the growth of M1 by about 5-1/4 percentage points over the first half of 1999, somewhat less than in previous years because most of the depository institutions that would benefit from such programs had already implemented them.

4. Growth of money and debt
Percent  
Chart of table rule
Period
M1
M2
M3
Domestic
nonfinancial
debt
Annual 1     
  1989   0.6   5.2   4.1   7.5
      
  1990   4.2   4.2   1.9   6.7
  1991   8.0   3.1   1.2   4.5
  1992 14.3   1.8   0.6   4.5
  1993 10.6   1.3   1.0   4.9
  1994   2.5   0.6   1.7   4.9
      
  1995-1.6   3.9   6.1   5.4
  1996 -4.5   4.6   6.8  5.1
  1997 -1.2   5.8   8.8   4.8
  1998   1.8   8.5 10.9   6.1
      
Quarterly
(annual rate)
 2
    
  1999    Q1   2.8   7.2   7.3   5.9
              Q2   3.4   5.7   5.0   
      
Year-to-date
(annual rate)
 3
    
  1999       2.0   6.2   6.0   6.1
Chart of table rule

          Note.  M1 consists of currency, travelers checks,
demand deposits, and other checkable deposits. M2 consists
of M1 plus savings deposits (including money market deposit
accounts), small-denomination time deposits, and balances
in retail money market funds. M3 consists of M2 plus
large-denomination time deposits, balances in institutional
money market funds, RP liabilities (overnight and term),
and Eurodollars (overnight and term). Debt consists of the
outstanding credit market debt of the U.S. government,
state and local governments, households and nonprofit
organizations, nonfinancial businesses, and farms.
          1.  From average for fourth quarter of preceding
year to average for fourth quarter of year indicated.
          2.  From average for preceding quarter to average
for quarter indicated.
          3.  From average for fourth quarter of 1998 to average
for June (May in the case of domestic nonfinancial debt).


As a consequence of retail sweep programs, the balances that depository institutions are required to hold at the Federal Reserve have fallen about 60 percent since 1994. This development has the potential to complicate reserve management by the Federal Reserve and depository institutions and thus raise the volatility of the federal funds rate. It would do so by making the demand for balances at the Federal Reserve more variable and less predictable. Before the introduction of sweeps, the demand for balances was high and stable because reserve balance requirements were large, and the requirements were satisfied by the average of daily balances held over a maintenance period. With sweep programs reducing required balances to low levels, depository institutions have found that they target balances in excess of their required balances in order to gain sufficient protection against unanticipated debits that could leave their accounts overdrawn at the end of the day. This payment-related demand for balances varies more from day to day than the requirement-related demand. Thus far, the greater variation in the demand for balances has not made the federal funds rate appreciably more volatile, in part reflecting the successful efforts of depository institutions and the Federal Reserve to adapt to lower balances. For its part, the Federal Reserve has conducted more open market operations that mature the next business day to better align daily supply with demand. Nonetheless, required balances at the Federal Reserve could drop to levels at which the volatility of the funds rate becomes pronounced. One way to address the problem of declining required balances would be to permit the Federal Reserve to pay interest on the reserve balances that depository institutions hold. Paying interest on reserve balances would reduce considerably the incentives of depository institutions to develop reserve-avoidance practices that may complicate the implementation of monetary policy.

U.S. Financial Markets

Yields on Treasury securities have risen this year in response to the ebbing of the financial market strains of late 1998, surprisingly strong economic activity, concerns about the potential for increasing inflation, and the consequent anticipation of tighter monetary policy. In January, yields on Treasury securities moved in a narrow range, as lingering safe-haven demands for dollar-denominated assets, owing in part to the devaluation and subsequent floating of the Brazilian real, about offset the effect on yields of stronger-than-expected economic data. Over subsequent months, however, yields on Treasury securities, especially at intermediate and long maturities, moved up substantially. The demand for the safest and most liquid assets, which had pulled down Treasury yields in the fall, abated as the strength in economic activity and favorable earnings reports engendered optimism about the financial condition of private borrowers and encouraged investors to buy private securities. In addition, rising commodity prices, tight labor markets, and robust economic activity led market participants to conclude that monetary policy would need to be tightened, perhaps in a series of steps. This view, accentuated by the FOMC's announcement after its May meeting that it had adopted a directive tilted toward tightening policy, also boosted yields. Between the end of 1998 and mid-July, Treasury yields added about 80 basis points to 110 basis points, on balance, with the larger increases in the intermediate maturities. The rise in Treasury bill rates, anchored by the modest upward move in the FOMC's target federal funds rate, was much less, about 10 basis points to 40 basis points.

The recovery in fixed-income markets over the first half of the year was evident in a number of indicators of market conditions. Market liquidity was generally better, and volatility was lower. The relative demand for the most liquid Treasury securities--the most recently auctioned security at each maturity--was not so acute, and yields on these securities were in somewhat closer alignment with yields on issues that had been outstanding longer. Dealers were more willing to put capital at risk to make markets, and bid-asked spreads in Treasury securities narrowed somewhat, though, in June they were still a bit wider than had been typical. Market expectations of asset price volatility, as reflected in prices on Treasury bond options contracts, receded on balance. The implied volatility of bond prices dropped off until April and then turned back up, as uncertainty about the timing and extent of a possible tightening of monetary policy increased.

Chart of Implied volatilities

Yields on inflation-indexed Treasury securities have only edged up this year, and the spreads between yields on nominal Treasury securities and those on comparable inflation-indexed securities have widened considerably. Yields on inflation-indexed securities did not decline in late 1998 like those of their nominal counterparts, in part because these securities were not perceived as being as liquid as nominal Treasury securities. Thus, as the safe-haven demand for nominal Treasury securities unwound and nominal yields rose, yields on inflation-indexed securities did not move up concomitantly. Moreover, these yields were held down by some improvement in the liquidity of the market for inflation-indexed securities, as suggested by reports of narrower bid-asked spreads, which provided additional impetus for investors to acquire these securities. Because of such considerations, the value of the yield spread between nominal and inflation-indexed Treasury securities as an indicator of inflation expectations is limited. Nonetheless, the widening of the spread this year may have reflected some rise in inflation expectations.

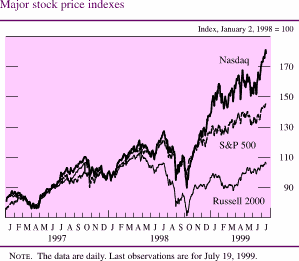
Equity prices have climbed this year. Major equity price indexes posted gains of 10 percent to 31 percent, on balance, between the end of 1998 and July 16, when most of them established record highs. The lift to prices from stronger-than-anticipated economic activity and corporate profits apparently has offset the damping effect of rising bond yields. Prices of technology issues, especially Internet stocks, have risen considerably on net, despite some wide swings in sentiment. Share prices of firms producing primary commodities, which tumbled in the fall, rebounded to post large price gains, perhaps because of the firming of commodity prices amid perceptions that Asian economies were improving. Consensus estimates of earnings over the coming twelve months have strengthened, but in June the ratio of these estimates to prices, as measured by the S&P 500 index, was near the record low established in May. Meanwhile, real interest rates, measured as the difference between the yield on the nominal ten-year Treasury note and a survey-based measure of inflation expectations, moved up. Consequently, the risk premium for holding equities remained quite small by historical standards.

Chart of Major stock price indexes

Chart of Equity valuation and long-term interest rate

Year 2000 Preparedness

The Federal Reserve and the banking system have largely completed preparing technical systems to ensure that they will function at the century date change and are taking steps to deal with potential contingencies. The Federal Reserve successfully completed testing all of its mission-critical computer systems for year 2000 compliance, including its securities and funds transfer systems. As a precaution to assure the public that sufficient cash will be available in the event that demand for U.S. currency rises in advance of the century date change, the Federal Reserve will increase considerably its inventory of currency by late 1999. In addition, the Federal Reserve established a Century Date Change Special Liquidity Facility to supply collateralized credit freely to depository institutions at a modest penalty to market interest rates in the months surrounding the rollover. This funding should help financially sound depository institutions commit more confidently to supplying loans to other financial institutions and businesses in the closing months of 1999 and early months of 2000.

All depository institutions have been subject to special year 2000 examinations by their banking supervisors to ensure their readiness. Banks, in turn, have worked with their customers to encourage year 2000 preparedness by including a review of a customer's year 2000 preparedness in their underwriting or loan-review standards and documentation. According to the Federal Reserve's May 1999 Senior Loan Officer Opinion Survey, a substantial majority of the respondent banks have largely completed year 2000 preparedness reviews of their material customers. Most banks reported that only a small portion of their customers have not made satisfactory progress.

Banks in the Federal Reserve's survey reported little demand from their clients for special contingency lines of credit related to the century date change, although many expect demand for such lines to increase somewhat as the year progresses. Almost all domestic respondents reported that they are willing to extend such credit lines, although in some cases with tighter standards or terms.

International Developments

Global economic prospects look considerably brighter than they did only a few months ago. To an important degree, this improvement owes to the rebound in the Brazilian economy from the turmoil experienced in January and February and to the fact that the fallout from Brazil on other countries was much less than it might have been. The fear was that the collapse of the Brazilian real last January would unleash a spiral of inflation and further devaluation and lead to a default on government domestic debt, destabilizing financial markets and triggering an intensified flight of capital from Brazil. In light of events following the Russian debt moratorium and collapse of the ruble last year, concern existed that a collapse of the real could also have negative repercussions in Latin America more broadly, and possibly even in global financial markets.

Developments in Brazil turned out better than expected over the weeks after the floating of the real in January. Between mid-January and early March, the real lost 45 percent of its value against the dollar, reaching a low of 2.2 per dollar, but then started to recover after the Brazilian central bank raised the overnight interest rate from 39 percent to 45 percent and made clear that it gave a high priority to fighting inflation. By mid-May, the real had strengthened to 1.65 per dollar, even while the overnight rate had been cut, in steps, from its March high. The overnight rate was reduced further, to 21 percent by the end of June, but the real fell back only modestly and stood at about 1.80 per dollar in mid-July. Brazil's stock market also rose sharply and was up by about 65 percent in the year to date.

Chart of Brazilian financial indicators

Several favorable developments have worked to support the real and equity prices over the past few months. Inflation has been lower than expected, with consumer price inflation at an annual rate of around 8 percent for the first half of the year. Greater-than-expected real GDP growth in the first quarter, though attributable in part to temporary factors, provided some evidence of a bottoming out, and possible recovery, in economic activity over the first part of this year. And in the fiscal arena, the government posted a primary surplus of more than 4 percent of GDP in the first quarter--well above the goal in the International Monetary Fund program. The positive turn of events has facilitated a return of the Brazilian government and private-sector borrowers to international bond markets, albeit on more restrictive terms than those of a year ago.

Since the middle of May, however, the road to recovery in Brazil has become bumpier. The central government posted a fiscal deficit in May that was bigger than had been expected. In addition, court challenges have called into question fiscal reforms enacted earlier this year that were expected to improve the government's fiscal balance by about 1 percent of GDP. In May, the rise in U.S. interest rates associated with the anticipated tightening in the stance of U.S. monetary policy helped push Brady bond yield spreads up more than 200 basis points. Although they narrowed some in June they widened recently on concerns about Argentina's economic situation.

The Brazilian crisis did trigger renewed financial stress throughout Latin America, as domestic interest rates and Brady bond yield spreads increased sharply in January from levels that had already been elevated by the Russian crisis. Nonetheless, these increases were generally smaller than those that had followed the Russian crisis, and as developments in Brazil proved more positive than expected, financial conditions in the rest of the region stabilized rapidly. Even so, the combination of elevated risk premiums and diminished access to international credit markets, as well as sharp declines in the prices of commodity exports, had significant consequences for GDP growth, which began to slow or turn negative throughout the region in late 1998 and early 1999.

Mexico appears to have experienced the least diminution in economic growth, likely because of its strong trade links with the United States, where growth has been robust. A flattening in Mexican GDP in the final quarter of 1998 has given way to renewed, but moderate, growth more recently, and the Mexican peso has appreciated by about 5-1/2 percent relative to the dollar since the start of the year. By contrast, economic activity in Argentina declined sharply in the first quarter, in part because of the devaluation and relatively weak economic activity in Brazil, Argentina's major trading partner. More recently the earlier recovery in Argentina's financial markets appears to have backtracked as concern has increased about the medium- to long-run viability of the currency peg to the dollar. Several countries in the region, including Venezuela, Chile, and Colombia, also experienced sharp declines in output in the first quarter, stemming in part from earlier declines in oil and other commodity prices.

In emerging Asia, signs of recovery in financial markets and in real activity are visible in most of the countries that experienced financial crises in late 1997. However, the pace and extent of recovery is uneven across countries. The strongest recovery has been in Korea. In 1998, the Korean won reversed nearly half of its sharp depreciation of late 1997. It has been little changed on balance this year, as Korean monetary authorities have intervened to moderate its further appreciation. Korean stock prices have also staged an impressive recovery--moving up about 75 percent so far in 1999. In the wake of its financial crisis, output in Korea fell sharply, with industrial production down about 15 percent by the middle of last year. Since then, however, production has bounced back. With the pace of the recovery accelerating this year, all of the post-crisis drop in production has been reversed. This turnaround reflects both the improvement in Korea's external position, as the trade balance has swung into substantial surplus, and the government's progress in addressing the structural problems in the financial and corporate sectors that contributed to the crisis.

Chart of Stock prices in developing Asian countries

Financial markets in the Southeast Asian countries that experienced crises in 1997 (Thailand, Singapore, Malaysia, Indonesia, and the Philippines) apparently were little affected by spillover from Brazil's troubles earlier this year and have recovered on balance over the past year, with exchange rates stabilizing and stock prices moving higher. Financial conditions have been weakest in Indonesia, in large part a result of political uncertainty; but even so, domestic interest rates have dropped sharply, and the stock market has staged an impressive rebound since April. The recovery of economic activity in these countries has been slower and less robust than in Korea, possibly reflecting slower progress in addressing structural weaknesses in the financial and corporate sectors. However, activity appears to have bottomed out and has recently shown signs of starting to move up in these countries.

Financial markets in China and Hong Kong experienced some turbulence at the start of the year when Chinese authorities put the Guangdong International Trust and Investment Corporation (GITIC) into bankruptcy, leading to rating downgrades for some Chinese financial institutions, including the major state commercial banks. The GITIC bankruptcy also raised concerns about Hong Kong financial institutions, which are heavy creditors to Chinese entities. These concerns contributed to a substantial increase in yield spreads between Hong Kong government debt and U.S. Treasury securities and to a fall in the Hong Kong stock market of about 15 percent. Spreads have narrowed since, falling from about 330 basis points on one-year debt in late January to about 80 basis points by mid-May, and have remained relatively stable since then. Equity prices also rebounded sharply, rising nearly 50 percent between mid-February and early May. Despite sizable volatility in May and June, they are now roughly unchanged from early May levels.

In Japan, a few indicators suggest that recovery from a prolonged recession may be occurring. Principally, first-quarter GDP growth at an annual rate of 7.9 percent was recorded--the first positive growth in six quarters. This improvement reflects in part a shift toward more stimulative fiscal and monetary policies. On the fiscal front, the government announced a set of measures at the end of last year that were slated for implementation during 1999 and included permanent cuts in personal and corporate income taxes, various investment incentives, and increases in public expenditures. The large-scale fiscal expansion and concern about increases in the supply of government bonds caused bond yields to more than double late last year and early this year, to a level of about 2 percent on the ten-year bond.

In mid-February, primarily because of concern about the prolonged weakness in economic activity and pronounced deflationary pressures but also in response to the rising bond yields, the Bank of Japan announced a reduction in the target for the overnight call-money rate and subsequently guided the rate to its present level of 3 basis points by early March. This easing of monetary policy had a stimulative effect on Japanese financial markets, with the yield on the ten-year government bond falling more than 75 basis points, to 1.25 percent by mid-May. More recently, the yield has risen to about 1.8 percent, partially in response to the release of unexpectedly strong first-quarter GDP growth. Supportive monetary conditions, coupled with restructuring announcements from a number of large Japanese firms and growing optimism about the economic outlook, have fueled a rise in the Nikkei from around 14,400 over the first two months of the year to over 18,500 in mid-July.

The improved economic performance in Japan also reflects some progress on addressing persistent problems in the financial sector. In March the authorities injected 7-1/2 trillion yen of public funds into large financial institutions and began to require increased provisioning against bad loans as well as improved financial disclosure. Although much remains to be done, these actions appear to have stabilized conditions, at least temporarily, in the banking system, and the premium on borrowing rates paid by leading Japanese banks declined to zero by March.

The yen strengthened in early January, supported by the runup in long-term Japanese interest rates, reaching about 110 per dollar--its highest level in more than two years. However, amid apparent intervention by the Japanese authorities, the yen retreated to a level above 116 per dollar, and it remained near that level until the mid-February easing of monetary policy and the subsequent decline of interest rates when it depreciated to about 120 per dollar. In mid-June, the Japanese authorities intervened in the foreign exchange market in an effort to limit appreciation of the yen after the surprisingly strong first-quarter GDP release increased market enthusiasm for that currency. The authorities noted that a premature strengthening of the yen was undesirable and would weigh adversely on economic recovery.

In the other major industrial countries, the pace of economic growth this year has been mixed. Economic developments in Canada have been quite favorable. GDP rose 4-1/4 percent at an annual rate in the first quarter after a fourth-quarter gain of 4-3/4 percent, with production fueled by strong demand for Canadian products from the United States. Core inflation remains low, near the lower end of the Bank of Canada's target range of 1 percent to 3 percent, although overall inflation rose some in April and May. Oil prices and other commodity prices have risen, and the current account deficit has narrowed considerably. These factors have helped the Canadian dollar appreciate relative to the U.S. dollar by about 4 percent this year and have facilitated a cut in short-term interest rates of 50 basis points by the Bank of Canada. Along with rising long-term interest rates elsewhere, long rates have increased in Canada by about 30 basis points over the course of this year. Even so, equity prices have risen about 12 percent since the start of the year, although the rise in long-term rates has undercut some of the momentum in the stock market.

In the United Kingdom, output was flat in the first quarter, coming off a year in which GDP growth had already slowed markedly. However, the effects of aggressive interest rate reductions undertaken by the Bank of England in late 1998 and earlier this year appear to have emerged in the second quarter, with gains in industrial production, retail sales volume, and business confidence. Inflationary pressures have been well contained, benefiting in part from the continued strength in sterling; the Bank of England cut interest rates, most recently in June, to reduce the likelihood of inflation undershooting its target of 2-1/2 percent. Consistent with expectations of an upturn in growth, equity prices have risen more than 15 percent, and long-term bond yields have climbed nearly 80 basis points since the end of last year.

First-quarter growth in the European countries that have adopted a common currency (euro area) regained some momentum from its slow pace in late 1998 but was nevertheless below potential, as production continued to react to the decline in export orders registered over the course of 1998 and in early 1999. Still, the drag on overall production from weak export demand from Asia and eastern Europe appears to have lifted a bit in the past few months, although the signs of a pickup in growth were both tentative and uneven across the euro area. In Germany, industrial production was higher in April and May than in the preceding two months, and export orders were markedly higher in those months than they had been at any time since the spring of 1998. But in France, which had been the strongest of the three largest euro-area economies in 1998, GDP growth was a meager 1-1/4 percent at an annual rate in the first quarter, and industrial production slipped in April.

On average in the euro area, inflation has remained quite tame, even as rising oil prices, a declining euro, and, at least in Germany, an acceleration in wage rates have raised inflationary pressures this year. The low average rate of inflation as well as the still sluggish pace of real activity in some of the euro-area countries led the European Central Bank to lower the overnight policy rate by 50 basis points in April, on top of cuts in short-term policy rates made by the national central banks late last year that, on average, were worth about 60 basis points.

Notwithstanding the easing of the policy stance, long-term government bond yields have risen substantially from their January lows in the largest economies of the euro area. Ten-year rates spiked in early March along with U.S. rates, fell back some through mid-May, and then resumed an upward course around the time the FOMC adopted a tightening bias in mid-May. Since the middle of June, a relatively sharp increase in yields has pushed them to about 100 basis points above their values at the start of the year and has narrowed what had been a growing interest rate differential between U.S. and European bonds. In addition to the pressure provided by the increase in U.S. rates, the runup in European yields likely reflects the belief that short-term rates have troughed, as the incipient recovery in Asia not only reduces the drag on European exports but also attenuates deflationary pressures on European import prices. Concern about the fall in the exchange value of the euro may also have contributed to an assessment that the next move in short-term rates would be up. Gains in equity prices so far this year--averaging about 12-1/2 percent--are also suggestive of the belief that economic activity may be picking up, although the range in share price movements is fairly broad, even considering only the largest economies: French equity prices have risen about 20 percent, German prices are up 13 percent, and Italian prices are up only 5 percent.

The new European currency, the euro, came into operation at the start of the year, marking the beginning of Stage Three of European Economic and Monetary Union. The rates of exchange between the euro and the currencies of the eleven countries adopting the euro were set on December 31; based on these rates, the value of the euro at the moment of its creation was $1.16675. Trading in the euro opened on January 4, and after jumping on the first trading day, its value has declined relative to the dollar almost steadily and is now about 13 percent below its initial value. The course of the euro-dollar exchange rate likely has reflected in part the growing divergence in both the cyclical positions and, until recently, long-term bond yields of the euro-area economies and the United States. Concerns about fiscal discipline in Italy--the government raised its 1999 deficit-to-GDP target from 2.0 percent to 2.4 percent--and about progress on structural reforms in Germany and France have also been cited as contributing to weakness in the euro, with the European Central Bank recently characterizing national governments' fiscal policy plans as ``unambitious.''

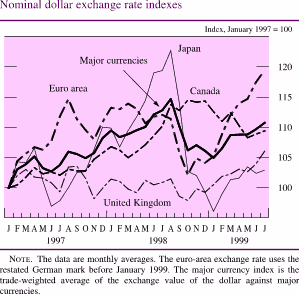
On balance the dollar has appreciated more than 4-1/2 percent against an index of the major currencies since the end of last year, owing mainly to its strengthening relative to the euro. Nevertheless, it remains below its recent peak in August of last year when the Russian debt moratorium and subsequent financial market turmoil sent the dollar on a two-month downward slide.

Chart of Nominal dollar exchange rate indexes


Footnotes

1.   All figures from the national income and product accounts cited here are subject to change in the quinquennial benchmark revisions slated for this fall. Return to text

2.   However, nonfarm compensation per hour captures the gains from the actual exercise of stock options, whereas for analyzing compensation trends, one might prefer to measure the value of the options at the time they are granted. Return to text

3.   About 1/4 percentage point of the improvement in productivity growth since 1995 can be attributed to changes in price measurement. The measure of real output underlying the productivity figures since 1995 is deflated using CPI components that have been constructed using a geometric-means formula; these components tend to rise less rapidly than the CPI components that had been used in the output and productivity data before 1995. These smaller CPI increases translate into more rapid growth of output and productivity in the later period. Return to text

4.   The most important change this year was the introduction of the geometric-means formula to aggregate price quotes within most of the detailed item categories. (The Laspeyres formula continues to be used in constructing higher-level aggregates.) Although these geometric-means CPIs were introduced into the official CPI only in January of this year, the BLS generated the series on an experimental basis going back several years, allowing them to be built into the national income and product accounts back to 1995. Return to text

Section 1


Home | News and events | Monetary policy | July 1999 report
Accessibility | Contact Us
Last update: July 22, 1999, 11:00 AM