FEDS Notes
July 19, 2018
Effects of fixed nominal thresholds for enhanced supervision
David Hou (Federal Reserve Bank of New York) and Missaka Warusawitharana
Following the financial crisis, the passage of the Dodd-Frank Wall Street Reform and Consumer Protection Act (Dodd-Frank Act) and the implementation of Basel III significantly changed the regulatory landscape in the U.S. The Federal Reserve participated in a number of rulemakings to implement these changes, many of which rely on fixed nominal thresholds to define their scope. This note discusses how the use of such fixed nominal thresholds impacts the extent of enhanced prudential supervision.1 Section 1 presents the various thresholds that are in place as of May 15, 2018.2 Section 2 analyzes the effect of these thresholds on the number and total assets of the affected banks, and examines whether the thresholds have caused any bunching of banks. Section 3 discusses possible changes that may help address some of these effects.
Nominal thresholds in banking regulation
The current regulatory framework relies on four major overlapping classifications: Advanced Approaches (AA) banks, Global Systemically Important banks (G-SIBs), Large Institution Supervision Coordinating Committee (LISCC) banks, and large and complex banks. These classifications rely mainly on total consolidated assets, but also take into account other factors such as non-bank assets and foreign exposures. Classifications may also reference one another; for example, G-SIBs are a subset of advanced approaches banks. In addition, we identify 20 major regulations that are material from a compliance standpoint. The scope of these regulations also tends to rely on various fixed nominal thresholds outside the discretion of the Federal Reserve.3 Figure 1 provides a detailed listing of these classifications and regulations alongside the thresholds upon which they are based, as of May 15, 2018. Three of the classifications and ten of the regulations identified in Figure 1 are explicitly tied to a firm's total consolidated assets (TCA). Total consolidated assets are calculated as a 4-quarter average to dampen sensitivity to business volatility.4
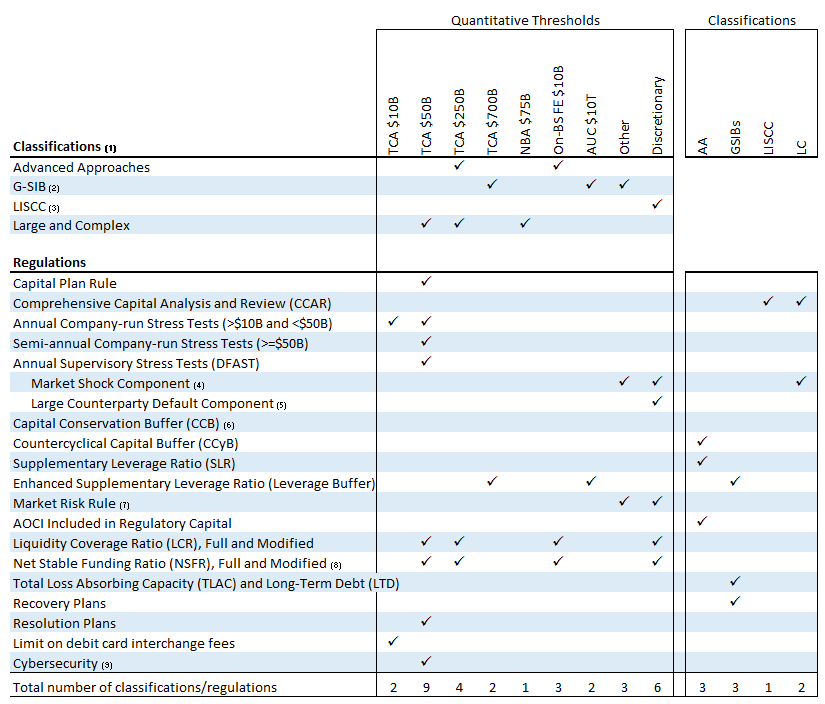
Note: Above rules do not reflect the totality of financial regulations applicable to financial institutions supervised by the Federal Reserve Board. Instead, these regulations represent a sample of those passed or modified in the post-crisis period that are material from a compliance standpoint. TCA refers to total consolidated assets. NBA refers to nonbank assets. On-BS FE refers to on-balance sheet foreign exposures. AUC refers to assets under custody. AA refers to firms subject to the advanced approaches RWA framework. LISCC refers to the Large Institution Supervision Coordinating Committee. LC refers to Large and Complex firms per SR 15-18.
(1) Foreign banking organizations with total consolidated assets and U.S. non-branch assets of at least $50B are subject to the intermediate holding company requirement. Some classifications include IHCs. Some regulations likewise apply to IHCs.
(2) G-SIB designation by the Basel Committee on Banking Supervision is based on a set of twelve systemic indicators. The U.S. separately calculates its own Method 2 score by substituting reliance on short-term wholesale funding for substitutability.
(3) Firms in the LISCC portfolio are "financial institutions that may pose elevated risks to U.S. financial stability and are supervised by the Federal Reserve."
(4) The market shock by law applies to "large banking organizations with significant trading activities." These firms are currently defined as those subject to the supervisory stress tests that are not large and noncomplex and hold trading assets and liabilities in excess of $50B or 10% of total consolidated assets.
(5) The large counterparty default component applies to companies with substantial trading or processing and custodian operations, which currently consist of the eight domestic G-SIBs.
(6) The Capital Conservation Buffer applies to all Board-regulated institutions. Proposed rulemaking replaces the Capital Conservation Buffer with a Stress Capital Buffer. See Board of Governors of the Federal Reserve System (2018).
(7) The market risk rule applies to institutions with aggregate trading assets and trading liabilities equal to or in excess of 10% of total assets, or $1B. The Board also retains the authority to apply this requirement to any Board-regulated institution if deemed necessary or appropriate.
(8) Notice of proposed rulemaking, not finalized.
(9) Advance notice of proposed rulemaking, not finalized.
Most requirements take effect once an institution reaches $50 billion, though $250 billion and $700 billion thresholds also apply. The annual company-run stress tests required by the Dodd-Frank Act and the limit on debit card interchange fees are the only requirements listed in Figure 1 whose applicability is tied to the $10 billion threshold.5,6
Foreign exposures have also been used to identify institutions whose global activities may pose notable risks to the U.S. financial system. In particular, covered institutions under the Liquidity Coverage Ratio and the proposed Net Stable Funding Ratio include not only those with assets equal to or above $250 billion, but also those with on-balance sheet foreign exposures of at least $10 billion. The advanced approaches risk-weighted assets framework also applies to the same thresholds.
The critical role that derivatives and off-balance sheet exposures played in the crisis directed supervisory focus toward the need to incorporate off-balance sheet items. Rather than adding non-asset thresholds to tailor the scope of application, financial regulation has at times applied safeguards against the targeted exposures themselves.7 For example, the supplementary leverage ratio requires advanced approaches banks to hold Tier 1 capital equal to at least 3 percent of leverage exposures, which include derivatives, repo transactions, and other off-balance sheet items.
Multiple complementary size thresholds constitute one approach for building resiliency against regulatory arbitrage. The market risk rule, for example, measures trading exposures using two different thresholds.8 Not only does the rule apply to institutions with aggregate trading assets and trading liabilities of at least $1 billion, but it also applies to those where this aggregate exceeds 10% of total assets. Of the 30 firms subject to the market risk rule as of 2017Q4, none breached the percentage threshold without also exceeding the nominal $1 billion level, reflecting the economics of trading in financial markets (see Kohler, 2015).
Effects of nominal thresholds on bank activity
The U.S. banking system is quite dispersed, consisting of a large number of small banks, some midsized banks and a smaller number of large banks (see Janicki and Prescott, 2006). When considered in fixed nominal terms, the size distribution of banks shifts slowly to the right over time, as economic growth and inflation increase the size of existing banks. This slow-moving rightward shift in the size distribution of banks can lead to increases in the scope of enhanced prudential supervision when fixed nominal thresholds are used to determine which banks are subject to such supervision. That said, this shift in the scope of supervision may not occur if banks respond to the enhanced supervision by curtailing their growth.
One simple measure of the scope of enhanced supervision is the number of banks subject to it. As firm size plays an important role in determining the extent of supervision in the US, Figure 2 illustrates the number of banks within certain size thresholds at three different time periods.9 The asset size bins are comprised of the following: $10 to $50 billion; $50 to $250 billion and $250 billion and above. The results for each size bin are shown for 2009Q4, 2013Q4 and 2017Q4.
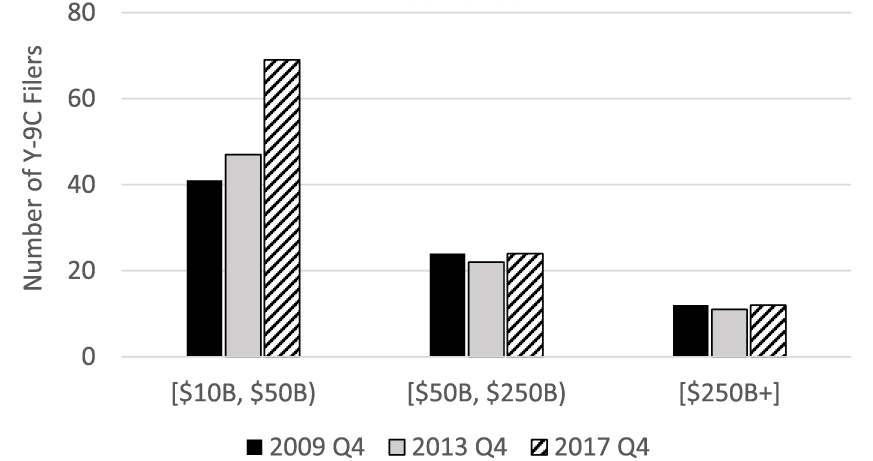
Note: Graph shows the number of Y-9C filers with total assets (BHCK2170) between nominal thresholds.
Source: FR Y-9C.
The results for the $10 to $50 billion size range indicate that the number of banks within this category has increased substantially from 2009Q4 to the present, with the bulk of the increase coming in later years. This increase indicates that, all else equal, fixed nominal thresholds for enhanced supervision lead to increased scope of such supervision over time, as increasing economic activity and price levels push up the size distribution of banks along a balanced growth path. By contrast, we find no evidence of such an increase in the number of banks that fall into the two larger bins. This may be because the above channel does not operate for larger firms, or it may reflect the reluctance of banks to grow into these size thresholds, either by organic growth or through mergers and acquisitions, given the associated increase in regulatory burdens. In addition, the lack of increase in the number of banks in the larger bins may reflect supervisory scrutiny of large bank merger applications. For example, Dodd-Frank Act § 604(d) requires the Federal Reserve to take into consideration the extent to which the stability of the U.S. banking or financial system would be impacted by a proposed merger. Furthermore, § 163(b) requires banks with $50 billion or more in total assets to provide written notice to the Federal Reserve prior to acquiring a nonbank financial institution of $10 billion or more in assets.
Another gauge of the scope of enhanced prudential supervision is the total assets of banks subject to it. Figure 3 presents the corresponding bar chart for total assets of banks within size thresholds over time. We normalize by nominal GDP to enable comparison over time, as one may expect banking sector assets to grow in line with nominal GDP.10 The asset size bins and time periods are unchanged from Figure 2.
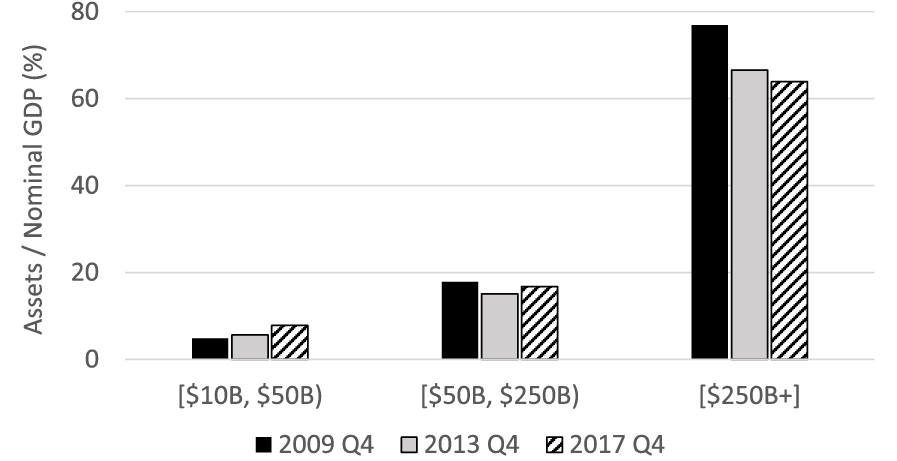
Note: Graph shows the total assets (BHCK2170) of Y-9C filers with assets between nominal thresholds, expressed as a percent of nominal GDP.
Source: FR Y-9C, FRED.
The figure indicates that the assets of banks within the $10 to $50 billion size range, relative to nominal GDP, have increased over time, commensurate with the rise in the number of banks within this category. As the annual company-run stress tests required by the Dodd-Frank Act is the main enhanced supervisory requirement these banks face, this indicates that the scope of this requirement has increased over time. In comparison, we find that the assets of banks in the $50 to $250 billion range have grown along with nominal GDP over time. While there is no growth in the number of banks in this size category, these banks are continuing to exhibit balanced growth. The most striking finding we obtain from Figure 3 is the sharp decline in total assets held by banks above $250 billion, relative to GDP. While this evidence is not causal, it does suggest that the supervisory framework put in place following the financial crisis has managed to curb the growth of the largest banks. As the largest banks exhibit the biggest systemic footprint, the relative decline in the size of these banks can be viewed as a positive development from a financial stability perspective (see Laeven, Ratnovski and Tong, 2016). Indeed, one may argue that the reduction of the relative size of the largest banks indicates that the post-crisis reforms have helped ameliorate the "Too big to fail" problem (see Stern and Feldman, 2004).
Banks face a discontinuous increase in regulatory burdens as they cross these fixed nominal asset thresholds. As such, they may act to curtail their normal growth if that growth would put them just above a threshold. Indeed, we see some indication of this behavior in that the number of banks in the larger bins have not increased over time. Instead, banks that are nearing a threshold may look for opportunities to grow rapidly through a merger or an acquisition (see Ballew, Iselin and Nicoletti, 2017). Such behavior would imply that one would find relatively fewer banks just above a given threshold than would be seen just below. We examine this by focusing on the ratio of the number of banks that have assets within a 20% band below a nominal threshold to the number of banks within a symmetric band above the threshold.
Table 1
| $10B Threshold | $50B Threshold | |||||
|---|---|---|---|---|---|---|
| Avg # of filers between [8, 10] |
Avg # of filers between [10, 12] |
Avg ratio of # below to # above | Avg # of filers between [40, 50] |
Avg # of filers between [50, 60] |
Avg ratio of # below to # above | |
| 2003 Q2 - 2006 Q1 | 10.5 | 8.8 | 1.2 | 6.5 | 4.5 | 1.6 |
| 2015 Q1 - 2017 Q4 | 22.6 | 8.1 | 3.3 | 3.4 | 1.8 | 2.4 |
Note: We calculate in each quarter the ratio of the number of Y-9C filers whose total consolidated assets (BHCK2170) are 20% below the $10B and $50B size thresholds to the number of Y-9C filers 20% above. We average these ratios across a three-year period before the crisis and the most recent three-year period to summarize changes in the number of Y-9C filers around these thresholds. Note that average ratios do not necessarily equal the ratio of the averages.
Source: FR Y-9C
Table 1 presents the findings from this analysis. We compare the average of the above ratio for three years prior to the financial crisis to the same ratio over the past three years.11 The first panel shows results within a 20% range around $10 billion, while the second panel shows the results within a 20% range around the $50 billion threshold. As the table reports, over the pre-crisis periods, we see fairly similar numbers of banks below and above each threshold. The average of the ratios of the number of banks below the two thresholds to the number above equals 1.2 and 1.6, respectively. However, when we look across the threshold over the past three years, we see a striking concentration of banks below each threshold. In particular, we see a pronounced bunching of firms just under $10 billion of total assets, and the average ratio of such banks to those just above has now increased to 3.3. When we look around the $50 billion threshold, the average ratio of the number of banks below the threshold to those just above shows a smaller increase to 2.4. We ran placebo tests to ensure that post-crisis asymmetries in the numbers of banks around asset thresholds were confined to meaningful regulatory cutoffs. For example, the average ratio of the number of banks just below the $25 billion threshold to those just above remained unchanged at 1.4 before and after the crisis. These results provide clear evidence that fixed nominal thresholds for enhanced supervision are constraining the natural growth of banks when they approach these thresholds.12
Possible modifications to the regulatory framework
The above results indicate that fixed nominal thresholds are an important feature of the U.S. regulatory landscape, and that these thresholds have demonstrable effects. This section discusses some potential modest modifications to the regulatory framework that are intended to address a few of the drawbacks of these nominal thresholds, while maintaining the efficacy of the regulatory framework.
One option would involve financial regulators periodically evaluating and adjusting the appropriateness of these thresholds. These periodic evaluations may be built into the rule as a commitment mechanism for regulators or carried out on an ad hoc basis. For example, the Federal Reserve recently raised the threshold for enhanced prudential supervision to $100 billion following the passage of the EGRRCPA. Furthermore, the Federal Reserve, in coordination with other federal financial regulatory agencies, recently carried out such an adjustment that reduced the scope of loans subject to the Shared National Credit program.13 Another threshold that could benefit from such a re-examination is the $1 billion dollars of trading assets and liabilities threshold that is used to determine which banks are subject to the market risk rule. This threshold has been unchanged since its inception in 1996.
Another possible enhancement would be to offset price impacts by incorporating automatic inflation adjustment into the text of the rulemaking. This approach has been instituted in various parts of administrative law. The Federal Civil Penalties Inflation Adjustment Act of 1990 and subsequent amendments require federal agencies to annually inflation-adjust civil money penalties.14 IRS inflation adjustment of tax brackets is another prominent example of this practice.15 Similar provisions could be built into regulations currently based on fixed nominal thresholds. One potential drawback of this approach is that there may be administrative costs associated with carrying out annual inflation adjustments.
A more complex approach would be to replace fixed nominal thresholds with a method that considers a number of different factors. For instance, the determination of the G-SIB capital surcharge considers size, interconnectedness, cross-jurisdictional activity, substitutability (or short-term wholesale funding), and complexity.16 One drawback of an approach that relies on multiple factors is that it adds complexity to the regulatory framework, thus potentially reducing its robustness and transparency. Another related approach would be to put in place a more graduated framework where the regulatory requirement scales with a particular measure. One such example is the scaling of maximum payouts for G-SIBs based on their capital buffers.
References
Ballew, Hailey, Michael Iselin and Allison Nicoletti, 2017. "Regulatory asset thresholds and acquisition activity in the banking industry", Working paper.
Janicki, Hubert P., and Edward S. Prescott, 2006. "Changes in the size distribution of U.S. banks: 1960-2005", Federal Reserve Bank of Richmond Economic Quarterly, 92(4), 291-316.
Kay, Benjamin S., Mark D. Manuszak and Cindy M. Vojtech, 2018. "Competition and complementarities in retail banking: Evidence from debit card interchange regulation", forthcoming, Journal of Financial Intermediation.
Köhler, Matthias, 2015. "Which banks are more risky? The impact of business models on bank stability", Journal of Financial Stability, 16, 195-212.
Laeven, Luc, Lev Ratnovski and Hui Tong, 2016. "Bank size, capital, and systemic risk: Some international evidence", Journal of Banking & Finance, 69, S25-S34.
Stern, Gary H. and Ron J. Feldman, 2004, Too Big to Fail, Brookings Institution Press, Washington, D.C.
Board of Governors of the Federal Reserve System, 2018, "Federal Reserve Board seeks comment on proposal to simplify its capital rules for large banks while preserving strong capital levels that would maintain their ability to lend under stressful conditions".
1. Enhanced prudential supervision is governed by the Federal Reserve's Regulation YY as codified in 12 CFR 252. Return to text
2. The Economic Growth, Regulatory Relief, and Consumer Protection Act (EGRRCPA) signed into law on May 24, 2018 revised a number of these nominal thresholds. Return to text
3. For example, the Dodd-Frank Act explicitly refers to $10 billion and $50 billion asset thresholds. Return to text
4. In the absence of data in the four most recent consecutive quarters, measurement is based on the average of the most recent quarter or consecutive quarters. See, for example, 12 CFR 252.42(c). Return to text
5. Also known as the Durbin Amendment. Return to text
6. Banks with assets in excess of $10 billion are also subject to oversight by the Consumer Financial Protection Bureau, though we choose not to include this element in Table 1. Return to text
7. One counterexample is the $10 trillion assets under custody threshold in certain G-SIB regulations. Return to text
8. The market risk rule also demonstrates that regulatory triggers are not limited to fixed quantitative thresholds. 12 CFR 217.201 states that the Board may apply this subpart to any Board-regulated institution deemed "necessary or appropriate" because of that institution's level of market risk. Return to text
9. We count the number of banks that file the FR Y-9C. Changes in Y-9C reporting requirements over time, including filings by savings and loan holding companies and intermediate holding companies that were not previously required by law, do not materially impact the patterns shown in Figure 2. Return to text
10. We obtain similar results when we normalize by total assets of private depository institutions. Return to text
11. We test the robustness of these results using various sample periods. In addition to the means reported above, we obtain similar results using sample medians. Return to text
12. Kay, Manuszak and Vojtech (2018) documents an alternative scenario where firms pass on the costs of debit card interchange fee regulation onto consumers via higher fees on complementary deposit products. The authors find that banks subject to the Durbin Amendment did not strategically avoid the $10 billion asset threshold. Return to text
13. See https://www.federalreserve.gov/newsevents/pressreleases/bcreg20171221c.htm. Return to text
14. See https://www.federalreserve.gov/newsevents/pressreleases/bcreg20180112a.htm for an example of Federal Reserve rulemaking that implements this statutory requirement. Return to text
15. The indexing of tax brackets was instituted by the Economic Recovery Tax Act of 1981. Return to text
16. Although the inputs to the calculation of the G-SIB surcharge are themselves nominal figures, normalizing by sample totals builds in a form of indexing. Return to text
Hou, David, and Missaka Warusawitharana (2018). "Effects of fixed nominal thresholds for enhanced supervision," FEDS Notes. Washington: Board of Governors of the Federal Reserve System, July 19, 2018, https://doi.org/10.17016/2380-7172.2183.
Disclaimer: FEDS Notes are articles in which Board staff offer their own views and present analysis on a range of topics in economics and finance. These articles are shorter and less technically oriented than FEDS Working Papers and IFDP papers.