FEDS Notes
November 16, 2018
The Effects of the Ability-to-Repay / Qualified Mortgage Rule on Mortgage Lending
Aurel Hizmo and Shane Sherlund
Summary
The Ability-to-Repay (ATR) / Qualified Mortgage (QM) rule, which is part of the post-crisis mortgage reforms created by the Dodd-Frank Wall Street Reform and Consumer Protection Act (Dodd-Frank Act), requires lenders to consider a borrower's ability to repay the mortgage loan before extending credit. In particular, the ATR rule requires lenders to make a "reasonable and good faith determination" of a borrower's ability to repay when underwriting a new mortgage, including documenting and verifying income and assets, as well as other factors. A lender can comply with the ATR requirement in several ways, including by making a QM loan--which the Dodd-Frank Act deems to be a less risky loan for a consumer. The QM definition places limits on points and fees, prohibits or restricts certain mortgage features, and generally imposes a 43-percent maximum on a borrower's total debt-to-income (DTI) ratio. Loans eligible for purchase or guarantee by Fannie Mae or Freddie Mac are temporarily exempt from the DTI criterion.1 Loans eligible for insurance or guarantee from the Federal Housing Administration (FHA), U.S. Department of Veterans Affairs (VA), U.S. Department of Agriculture (USDA), and Rural Housing Service (RHS), as well as portfolio loans held by small creditors are exempt permanently from the DTI criterion.2 The ATR/QM rule applies to mortgage applications submitted on or after January 10, 2014.
A key challenge in implementing the ATR/QM rule has been balancing the goal of protecting mortgage borrowers from predatory lending practices with the goal of maintaining broad access to mortgage credit. For example, some market participants expressed concern that the ATR/QM rule could affect the availability and cost of mortgage credit (GAO, 2015). Using different data sources and methodologies, the literature examining the effects of the ATR/QM rule on mortgage lending has thus far produced mixed results. Bhutta, Popper, and Ringo (2015) argue that the ATR/QM rule had essentially no effect on overall lending volumes or average DTI ratios from 2013 to 2014. Gissler, Oldfather, and Ruffino (2016), however, hypothesize that uncertainty around the ATR/QM rule affected the availability of mortgage credit until the rules were finalized. Finally, DeFusco, Johnson, and Mondragon (2017) argue that the ATR/QM rule resulted in small but statistically significant increases in mortgage pricing but large decreases in the volume of mortgages originated.
In this note, we use a unique set of mortgage applications and locks data from January 2013 through September 2018 to examine the effects of the ATR/QM rule on mortgage lending and mortgage pricing. As our data spans the January 2014 implementation date of the rule, we estimate a simple difference-in-difference model in which we compare nonconforming loans, which were subject to the ATR/QM rule, to conforming loans, which were not. More specifically, for each sector we compare high-DTI mortgages with low-DTI mortgages. Our results suggest that the incidence of high-DTI lending decreased markedly in the nonconforming market, and that the cost of credit in this sector increased significantly with the onset of the ATR/QM rule.
Data
The main data used in our analysis comes from a large proprietary database of mortgage applications and locks from Optimal Blue. These data cover more than one fourth of home purchase applications in the United States from January 2013 through September 2018. The data include mortgage and borrower characteristics, such as credit scores, loan-to-value (LTV) ratios, debt-to-income ratios, loan amounts, mortgage rates and points and fees paid, state and metro area of residence, property and occupancy type, loan purpose, underwriting type, amortization type and period, and the date and approval status of each loan application (up to the date of rate lock). Observing all of these characteristics at the mortgage application level allow us to control for many factors other than the ATR/QM rule that might influence differences in the availability and cost of mortgage credit across borrowers.
In our final sample, we exclude mortgage applications that were denied prior to rate lock. Note that even after rate lock, roughly 20 percent of mortgage applications do not close. We also restrict our sample to 30-year fixed-rate mortgages, and exclude refinance mortgages as well as FHA/VA loans. Table 1 shows descriptive statistics for some of the variables used in our analysis, split by conforming versus nonconforming status.3 As shown, mortgage rates averaged around 4.3 percent over this period, with only small differences between conforming and nonconforming mortgages, while the average points and fees paid by borrowers of conforming loans were higher than the points paid by borrowers of nonconforming loans. Moreover, nonconforming mortgage applications tended to have lower LTV ratios, higher FICO scores, lower DTI ratios, and larger loan sizes.
Table 1: Descriptive Statistics
| Conforming | Nonconforming | |||||
|---|---|---|---|---|---|---|
| Mean | Median | Std. Dev. | Mean | Median | Std. Dev. | |
| Mtg. rate | 4.35 | 4.38 | 0.46 | 4.27 | 4.25 | 0.56 |
| Points and fees | 10.20 | 0.00 | 105.50 | 3.20 | 0.00 | 85.70 |
| LTV ratio | 84.30 | 88.80 | 12.80 | 77.60 | 80.00 | 8.90 |
| FICO | 739.50 | 746.00 | 42.70 | 761.70 | 770.00 | 30.50 |
| DTI ratio | 34.80 | 36.00 | 9.40 | 31.30 | 32.40 | 9.00 |
| Loan size | 254,788 | 235,200 | 122,389 | 734,270 | 663,000 | 301,783 |
| No. observations | 1,744,825 | 79,411 | ||||
Note: Mortgage rates measured in percentage points, points and fees paid in basis points, LTV and DTI ratios in percent.
Source: Authors' calculations from Optimal Blue locks data.
One cautionary aspect of our data is that, while we observe some large lenders, most lenders in our sample are quite small. As shown in Table 2, the average lender in our sample had 515-752 conforming mortgage applications proceed to rate lock per year. Similarly, the average lender had only 31-54 nonconforming mortgages applications proceed to rate lock per year. Not shown in the table, the median lender in our sample had only 140-184 conforming mortgage applications (4-10 nonconforming mortgage applications) proceed to rate lock per year. Thus, our analysis covers mostly small lenders, and our results might or might not extend to larger mortgage lenders and the broader mortgage market. That said, our sample covers a sizable fraction of home purchase applications during 2013-2018.
Table 2: Purchase-Loan Activity for 30-Year Fixed-Rate Mortgages
| Conforming | Nonconforming | |||
|---|---|---|---|---|
| Total Locks | Locks per lender | Total Locks | Locks per lender | |
| 2013 | 146,116 | 570.80 | 4,389 | 31.60 |
| 2014 | 180,930 | 533.70 | 8,095 | 38.90 |
| 2015 | 237,414 | 515.00 | 11,890 | 42.90 |
| 2016 | 337,609 | 637.00 | 14,147 | 44.20 |
| 2017 | 433,194 | 752.10 | 19,791 | 51.50 |
| 2018 | 409,562 | 713.50 | 21,099 | 54.20 |
| All years | 1,744,825 | 637.70 | 79,411 | 46.20 |
Source: Authors' calculations from Optimal Blue locks data.
Analysis
We first explore effects of the ATR/QM rule on the incidence of high-DTI lending. As shown in Figure 1, the high-DTI share of conforming applications that proceeded to rate lock did not change significantly from 2013 to 2014-2016, likely reflecting the exemption of GSE-eligible mortgages from the DTI criterion. Note that the rise in high-DTI lending observed during 2017 likely reflects Fannie Mae's underwriting change that relaxed the standards for DTI ratios between 45 and 50 percent. However, the high-DTI share of nonconforming applications that proceeded to rate lock declined significantly from 2013 to 2014 and remained low through mid-2017. We attribute this decline to the implementation of the ATR/QM rule.
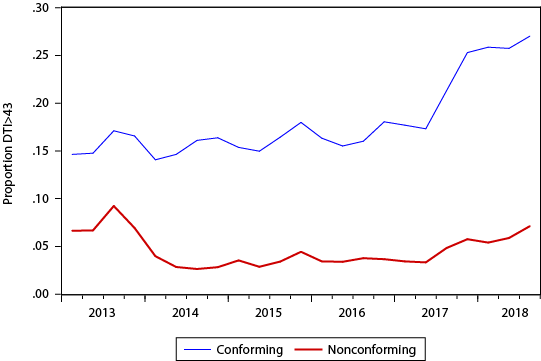
Source: Authors' calculations from Optimal Blue locks data.
We next explore the effects of the ATR/QM rule on the mortgage rates paid by borrowers. In particular, we calculate the spread of the mortgage rate to the average prime offer rate (APOR) for each mortgage application in our sample.4 We then relate this spread to an indicator variable for the DTI ratio being above 43 percent, 1{DTI>43}; regressions are estimated separately by year and by conforming versus nonconforming mortgage status. We also include loan size, points paid, and fixed effects for lender, metro area, lock period, and FICO-LTV bins in our regressions. The results are shown in Tables 3 and 4.
Table 3: Conforming Loans
| Post-Policy | By Year | ||||||
|---|---|---|---|---|---|---|---|
| Years Pooled | 2013 | 2014 | 2015 | 2016 | 2017 | 2018 | |
| 1{DTI>43} |
.015*** (.002) |
.007** (.001) |
.009*** (.001) |
.008** (.002) |
.008** (.002) |
.014** (.003) |
.010** (.001) |
| n | 1,598,646 | 146,056 | 180,872 | 237,336 | 337,562 | 433,144 | 409,522 |
| R-squared | 0.525 | 0.474 | 0.573 | 0.53 | 0.56 | 0.566 | 0.562 |
Note: Dependent variable is the mortgage rate to APOR spread (percentage points). Coefficient estimates for loan size, points paid, and fixed effects for lender, MSA, lock period, and FICO x LTV bins not shown.
Source: Authors' calculations from Optimal Blue locks data.
Table 4: Nonconforming Loans
| Post-Policy | By Year | ||||||
|---|---|---|---|---|---|---|---|
| Years Pooled | 2013 | 2014 | 2015 | 2016 | 2017 | 2018 | |
| 1{DTI>43} |
.276*** (.036) |
.100*** (.014) |
.068** (.017) |
.115* (.040) |
.351** (.091) |
.380*** (.048) |
.239** (.035) |
| n | 74,910 | 4,290 | 8,011 | 11,780 | 14,041 | 19,675 | 20,974 |
| R-squared | 0.508 | 0.775 | 0.57 | 0.554 | 0.524 | 0.544 | 0.602 |
Note: Dependent variable is the mortgage rate to APOR spread (percentage points). Coefficient estimates for loan size, points paid, and fixed effects for lender, MSA, lock period, and FICO x LTV bins not shown.
Source: Authors' calculations from Optimal Blue locks data.
As shown in Table 3, our control group of borrowers with conforming loans obtained essentially the same mortgage rates on either side of the 43-percent DTI threshold. That is, accepted applications for conforming loans with DTI ratios exceeding 43 percent tended to have mortgage rates only 1 to 2 basis points higher than those with DTI ratios less than or equal to 43 percent. Moreover, this difference did not change materially after the ATR/QM rule went into effect in early 2014. This finding again likely reflects the fact that GSE-eligible mortgages were exempt from the 43-percent DTI criterion. As shown in Table 4, however, our treatment group of borrowers with nonconforming loans received substantially higher mortgage rates when exceeding the DTI criterion. That is, accepted nonconforming applications with DTI ratios exceeding 43 percent tended to have mortgage rates as much as 30-40 basis points higher than those with DTI ratios less than or equal to 43 percent. Our results indicate that high-DTI nonconforming borrowers paid slightly higher rates even prior to the implementation of the ATR/QM rule, but that the premium increased in 2016 and 2017, before decreasing somewhat in 2018. This suggests that the ATR/QM rule might have had a significant effect on the mortgage rates paid by borrowers with DTI>43, though our sample extends only 4.75 years after the implementation date.
The implementation of the policy did not seem to have immediate effects on prices – interest rates paid by high-DTI non-conforming borrowers in 2014 and 2015 were similar to those in 2013. The high-DTI share of non-conforming applications that proceeded to rate lock, however, dropped by about 60 percent in the year of the policy implementation. This suggests that initially lenders responded to the policy by rationing credit to non-QM borrowers. Over time, as the market learned about the costs and risks related to the ATR/QM rule, the interest rate premium paid by high-DTI non-conforming borrowers increased substantially, and so did the high-DTI share of non-conforming applications that proceeded to rate lock.
To ensure that the discontinuity in pricing occurs exactly at a DTI ratio of 43 percent, we estimate a version of the regressions in Tables 3 and 4 with separate coefficients for different DTI groups. Figure 2 plots the DTI coefficients and 90-percent confidence intervals for the post-implementation period of 2014-2018. The omitted group is borrowers with DTI ratios of less than 20 percent. For conforming loans, the coefficients slightly increase with DTI, and there is no apparent discontinuity at DTI>43. For nonconforming loans, the coefficients also slightly increase with DTI for DTI≤43. However, there is a sharp discontinuity for DTI ratios greater than 43 percent. Borrowers with DTI ratios between 44 and 49 percent pay 27 basis points more in interest rates than borrowers with DTI ratios between 40 and 43 percent. The premium is similar for borrowers with DTI ratios of 50 percent or higher.
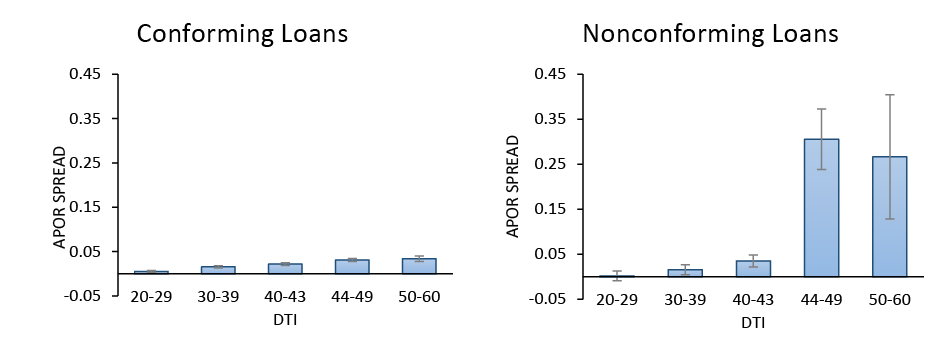
Source: Authors' calculations from Optimal Blue locks data.
Finally, we consider an alternative data source--mortgage rates actually offered by lenders--as a robustness check on our results.5 This robustness check rules out the possibility that demand-side factors, such as differences in borrower characteristics, might be driving our results. We consider hypothetical borrowers applying for 30-year fixed-rate mortgages in Los Angeles, California, with 80-percent LTV ratios, FICO scores of 720, and fully documented incomes and assets. One set of borrowers has DTI ratios of 43 percent, while the other set of borrowers has DTI ratios of 44 percent--just above the 43-percent DTI criterion. Within the two sets of borrowers, some borrowers have loan amounts below the conforming loan limit and some borrowers have loan amounts above the conforming loan limit (jumbo loans). We then look at lender rate sheets to explore what mortgage rates were available to these four sets of borrowers.
Table 5 displays the daily median no-point offer rates averaged over a two week period starting in October 15th, 2018. During this time, conforming borrowers with DTI ratios of 43 percent could obtain a no-point median rate of 5.197 percent. The same no-point rate was also available to conforming borrowers with DTI ratios of 44 percent, likely reflecting the temporary exemption of GSE-eligible mortgages from the DTI criterion. Over the same period, jumbo borrowers with DTI ratios of 43 percent could obtain a median no-point rate of 5.043 percent. But the median mortgage rate available to jumbo borrowers with DTI ratios of 44 percent was 5.759 percent, nearly 70 basis points more than jumbo borrowers with DTI ratios of 43 percent. This estimated gap in offer rates is larger than the 30-40 basis point gap that we estimated using the rate lock data. This could be because non-QM, jumbo borrowers were more likely to shop around and select lenders that were offering rates below the median no-point offer rate. This robustness check is consistent with the main findings we presented in Tables 3-4.
Table 5: Time Series Averages of Daily Median Offer Rates
| DTI=43 | DTI=44 | |
|---|---|---|
| Conforming | 5.197 | 5.197 |
| Jumbo | 5.043 | 5.759 |
Source: Optimal Blue pricing data (between 10/15/2018-10/26/2018).
Conclusions
This note investigates the effect of the ATR/QM rule on mortgage lending and mortgage rate spreads. We use proprietary mortgage application and locks data to estimate these effects. Our focus is on borrowers with nonconforming loans, which currently constitute a relatively small portion of U.S. mortgage borrowers. Relying on the timing of the ATR/QM rule implementation date, we find that the rule reduced the incidence of high-DTI lending among nonconforming mortgage applications, and significantly increased the cost of credit. We did not find similar effects for conforming mortgage applications.
Looking at how our estimates vary over time, the policy had a larger initial impact on the share of high-DTI lending than on mortgage pricing, suggesting that lenders may have initially reacted to the policy primarily by rationing credit, as also argued by DeFusco, Johnson and Mondragon (2017). Over time, the share of high-DTI mortgages has increased to near pre-policy implementation levels, but high-DTI non-QM mortgages have become significantly more expensive than high-DTI QM mortgages. A potential explanation for this trend is that as lenders have become more comfortable with the costs and risks related to the ATR/QM rule, they have increased lending activity in this segment of the market but passed some of these costs on to borrowers.
While research has already considered some of the effects of the ATR/QM rule on mortgage lending, several avenues of research remain unexplored. Some studies have looked at changes in the costs of credit for borrowers, but little analysis has explored other costs, such as increased origination timelines, increased underwriting costs, or the potential pass-through of increased underwriting costs from lenders to borrowers. Similarly, little analysis has examined the potential benefits of the ATR/QM rule, such as decreased delinquency rates, decreased foreclosure activity, and potentially lower expected losses among lenders.
Finally, given the temporary nature of the exemption of GSE-eligible mortgages from the 43-percent DTI criterion (the so-called "GSE patch"), further analysis is needed to examine the interaction of (the lack of) housing finance reform and the potential expiration of the GSE patch on January 10, 2021. In particular, if housing finance reform is not completed by the expiration date, what is the plan for the GSE patch? Should it be extended? What effects would one expect if the patch was not extended?
References
Bhutta, Neil, Jack Popper, and Daniel R. Ringo (2015). "The 2014 Home Mortgage Disclosure Act Data," Federal Reserve Bulletin, 101(4), 1-43.
DeFusco, Anthony, Stephanie Johnson, and John Mondragon (2017). "Regulating Household Leverage," working paper.
Gissler, Stefan, Jeremy Oldfather, and Doriana Ruffino (2016). "Lending on Hold: Regulatory Uncertainty and Bank Lending Standards," Journal of Monetary Economics, 81, 89-101.
Government Accountability Office (2015). "Mortgage Reforms: Actions Needed to Help Assess Effects of New Regulations," GAO-15-185.
1. This temporary definition of QM expires no later than January 10, 2021. Return to text
2. The Economic Growth, Regulatory Relief and Consumer Protection Act, enacted on May 24, 2018, created another definition of QM for mid-sized creditors (those with less than $10 billion in consolidated assets) that make portfolio-held loans. Similar to the current QM definition for small creditors (those with less than $2 billion in consolidated assets), this new QM definition does not have any quantitative DTI criterion. Return to text
3. A conforming loan is a mortgage loan that meets the underwriting guidelines set by the FHFA and is eligible for purchase by the GSEs. The most well-known guideline is the loan size limit; other guidelines also include borrower's loan-to-value ratio, debt-to-income ratio, credit history, documentation requirements, etc. Return to text
4. The average prime offer rate is from Freddie Mac's weekly Primary Mortgage Market Survey. Return to text
5. These data also come from Optimal Blue, but contain information from lenders' mortgage rate offer sheets rather than individual mortgage applications. Return to text
Hizmo, Aurel, and Shane Sherlund (2018). "The Effects of the Ability-to-Repay / Qualified Mortgage Rule on Mortgage Lending," FEDS Notes. Washington: Board of Governors of the Federal Reserve System, November 16, 2018, https://doi.org/10.17016/2380-7172.2296.
Disclaimer: FEDS Notes are articles in which Board staff offer their own views and present analysis on a range of topics in economics and finance. These articles are shorter and less technically oriented than FEDS Working Papers and IFDP papers.