FEDS Notes
October 18, 2019
Interest on Excess Reserves and U.S. Commercial Bank Lending
Marcelo Rezende, Judit Temesvary, and Rebecca Zarutskie1
Over the past decade, the interest on excess reserves (IOER) rate has become a key administered rate used by the Federal Reserve to control short-term interest rates.2 IOER is likely to remain an important rate used in monetary policy implementation in light of the FOMC's recent announcement that it intends to continue to implement monetary policy in an environment of ample reserves (FOMC, 2019).
Although IOER has been an effective tool in the Federal Reserve's control of short-term interest rates, some have argued that paying banks IOER may reduce banks' incentives to lend to businesses and households. To be sure, the IOER rate does affect loan volumes because the IOER rate raises other short-term interest rates, which dampens credit growth through the regular channels of monetary policy transmission.3 However, some have argued that changes in the IOER rate, and changes in the spreads between the IOER rate and other short-term interest rates, could provide an additional incentive, unrelated to the stance of monetary policy, for banks to hold reserves rather than other assets, including loans. Banks may prefer to hold more reserves and earn the IOER rate rather than to lend to borrowers and earn the rate of return associated with such lending.4
In this note, we empirically assess whether changes in the IOER rate and changes in the spread between the IOER rate and the effective federal funds rate (EFFR) have affected banks' reserve holdings and lending, controlling for changes in the stance of monetary policy and other macroeconomic conditions. We find some evidence that the IOER rate affects reserve holdings at the bank level. However, we do not find any evidence that changes in the IOER rate has a discernable effect on bank lending.
How might large levels of reserves in the banking system and payment of IOER affect commercial bank lending?
In the absence of IOER payments, banks have low incentives to hold excess reserves–even though the total amount of reserves in the system is determined by the Federal Reserve–and prefer other assets, such as loans, which yield higher returns. If the IOER rate is zero or too low relative to lending rates, bank credit could rapidly expand and the economy could overheat as banks seek to lend out their reserves to earn a positive return.5 If the IOER rate is higher than the cost of obtaining additional funds, banks may have an incentive to raise funds and hold them as reserves, earning the spread between the IOER rate and the cost of the additional funds held as reserves. Such a positive spread between the IOER rate and the funding costs could lead banks with lower costs to hold more reserves. However, it is not necessarily the case that these banks would lend less than they otherwise would. Such banks may still also find it profitable to raise funds to grant loans if the risk-adjusted returns to doing so are positive.
Measuring the relationship between IOER and bank reserve holdings and lending
A key challenge in estimating the relationship between changes in the IOER rate and bank reserves holdings and lending is that time-varying factors correlated with the IOER rate may also affect bank reserves and lending. These factors include, for example, the Federal Reserve's supply of reserves, which affects banks' reserve holdings, and the strength of the economy and credit demand, which affects bank lending. Similarly, time-invariant bank-specific factors, such as business models, may also influence banks' choice of reserves and loan holdings. Failure to account for these factors may bias estimates of the effects of IOER. To overcome this challenge, we include time and bank fixed effects in our regression equations. In addition, we control for variation over time and across banks by bank capitalization. Better-capitalized banks face lower funding costs, which may increase their demand for reserves and their credit supply. In addition, better-capitalized banks are less likely to be constrained by capital requirements and thus are more likely to borrow short-term wholesale funds and hold them as reserves at the Federal Reserve.
Our regression specifications take the following general form:
$$$ \Delta {Res}_{j,t} = \lambda {CAP}_{j,t-1} \times \Delta {IOER}_t +\delta{CAP}_{j,t-1} \times \Delta {Spread}_t + \zeta X_{j,t-1} + \eta_j + \varphi_t + \varepsilon_{j,t} \ \ \ \ \ \ \ (1) $$$
and
$$$ \Delta {Loans}_{j,t} = \pi {CAP}_{j,t-1} \times \Delta {IOER}_t + \gamma {CAP}_{j,t-1} \times \Delta {Spread}_t + \theta X_{j,t-1} + \psi_j + \sigma_t + \mu_{j,t} \ \ \ (2) $$$
We consider two different versions of the dependent variables in equations (1) and (2). In one version, $$\Delta {Res}_{j,t}$$ in equation (1) is the quarterly change in bank j’s reserves to total assets ratio, and $$\Delta {Loans}_{j,t}$$ in equation (2) is the quarterly change in bank j’s loans to total assets ratio. In the other version, $$\Delta {Res}_{j,t}$$ is the quarterly growth rate of bank j’s reserve holdings, and $$\Delta {Loans}_{j,t}$$ is the quarterly growth in bank j’s loan amounts. We also repeat the estimation of equations (1) and (2) using data with weekly frequency.
$$\Delta {IOER}_t$$ and $$\Delta {Spread}_t$$ are the quarterly changes in the IOER rate and in the difference between the IOER rate and the EFFR. We interact $$\Delta {IOER}_t$$ and $$\Delta {Spread}_t$$ with $${CAP}_{j,t-1}$$, a bank’s leverage ratio, in all specifications. The regressions also include the vector $$X_{j,t-1}$$ of bank balance sheet characteristics–total assets, leverage ratio, return on equity (ROE), and net interest margin (NIM). $$\eta_j$$ and $$\psi_j$$ are bank fixed effects and $$\varphi_t$$ and $$\sigma_t$$ are time (quarter-year) fixed effects. In quarterly specifications without time fixed effects, we add $$\Delta {IOER}_t$$ and $$\Delta {Spread}_t$$ (not interacted with banks’ leverage ratios) and macro controls–consumer price index inflation, gross domestic product growth, and a time trend–to the regression. If increases in the IOER rate and spread relative to EFFR increase banks' reserve holdings, $$\lambda$$ and $$\delta$$ should be positive. If increases in the IOER rate and spread relative to EFFR decrease banks' loan holdings, then $$\pi$$ and $$\gamma$$ should be negative.
Data Sample
In the first part of our analysis, we use quarterly data from the first quarter of 2015–the beginning of the year when the Federal Reserve started raising the target federal funds rate–to the fourth quarter of 2018. Our sample starts after the Federal Reserve ended its third round of quantitative easing in 2014, and therefore covers a period when the level of reserves in the banking system was no longer growing as a result of quantitative easing. After years of near-zero interest rates following the financial crisis, the IOER rate rose from 0.25 percent to 2.40 percent over the period from 2015 to 2018 (Figure 1). This increase in the IOER rate helps us identify the effects of the IOER rate on bank reserves and lending.
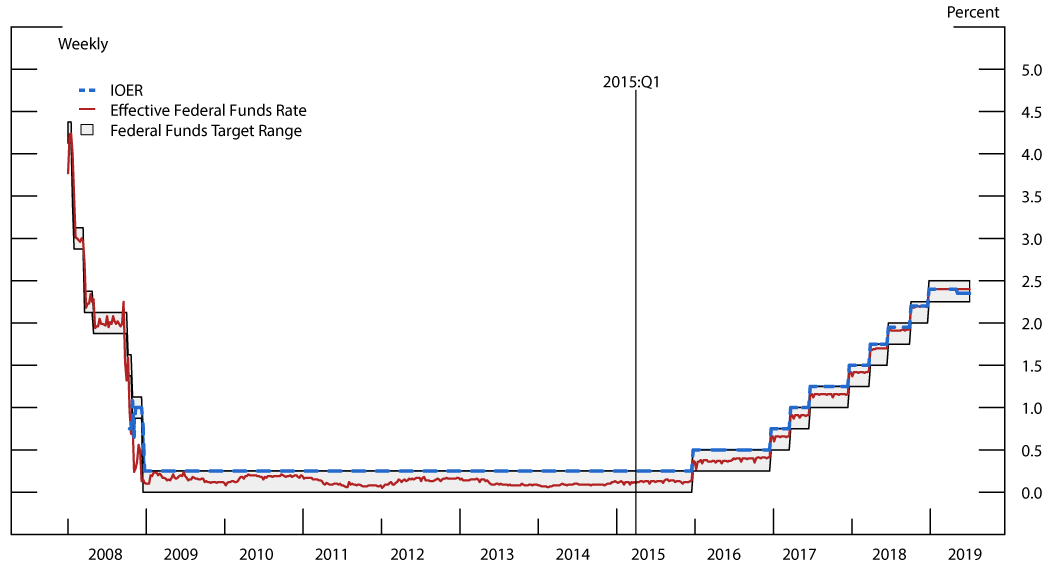
Source: Federal Reserve Board Staff calculations; Federal Reserve Board Release on Selected Interest Rates (H.15); “Interest on Required Reserve Balances and Excess Balances” release.
We use data on domestically chartered commercial banks from the Consolidated Report of Condition and Income (Call Reports). These data include balance sheet and income information–total assets, leverage ratio, ROE, and NIM. Reserves data are collected from the Federal Reserve accounting records. We limit the sample to observations from banks with at least $1 billion of total assets to ensure that our results reflect the behavior of banks that hold large amounts of excess reserves.6 Banks in our sample held about 60 percent of total reserves as of December 2018. On average, the ratio of bank reserves to total assets is 4 percent. Also, total loans make up near two-thirds of our sample banks' total assets, and loans held by our sample banks constitute a material fraction of total loans extended by commercial banks (Figure 2).
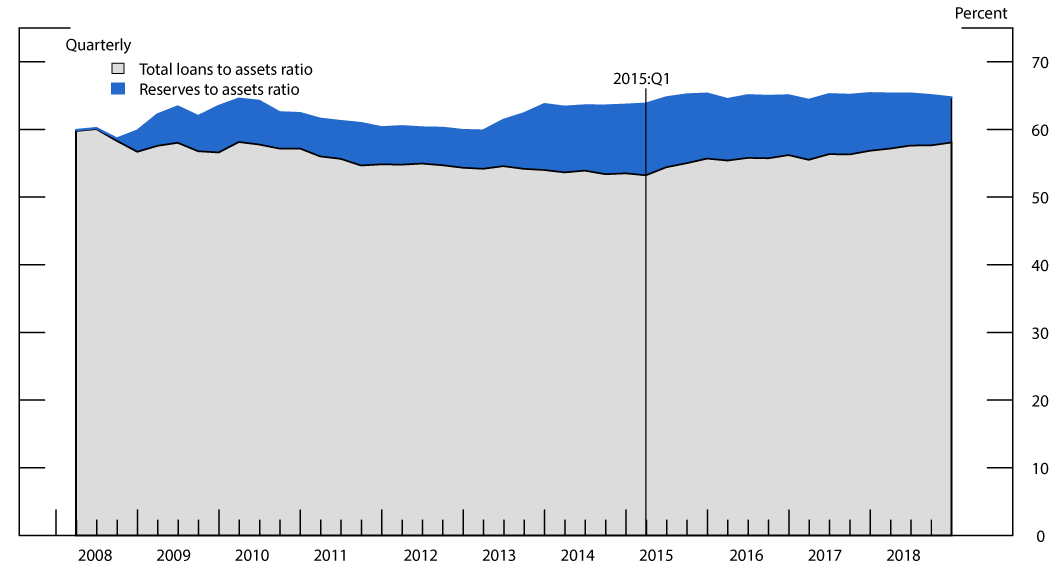
Note: The reserves and loans to assets ratios are aggregate reserves or loans of all U.S. commercial banks with assets over $1 billion divided by aggregate assets.
Source: Federal Reserve Board Staff calculations; Consolidated Reports of Condition and Income, FFIEC 031/041; Reserve balances are based on Federal Reserve accounting records.
We also use weekly data to study the relationship between IOER, bank reserves, and bank lending over the weeks following the four FOMC meetings in 2018 in which the Committee raised interest rates. We restrict our weekly analysis to observations from 2018 because this analysis relies on technical adjustments to the IOER rate, which the Federal Reserve made for the first time in that year. We use weekly domestic bank data on total assets and total loans from FR 2644 data, the "Weekly Report of Selected Assets and Liabilities of Domestically Chartered Commercial Banks and U.S. Branches and Agencies of Foreign Banks." Weekly reserves data are also collected from the Federal Reserve accounting records.
Estimation results
Evidence from quarterly panel regressions
Tables 1 and 2 present the quarterly regressions results. We find no evidence that banks’ reserves or lending respond to changes in the IOER rate or the spread to the EFFR, or that such rate changes would affect low and better-capitalized banks differently, as evidenced by the statistically insignificant coefficients on $$\Delta{IOER}_t$$ and $$\Delta{Spread}_t$$ across all specifications. Bank capitalization is significantly and positively related to banks’ reserve holdings, as measured by the positive and significant coefficient on $${CAP}_{j,t-1}$$ in columns 1 and 3 of Tables 1 and 2, consistent with higher leverage ratios allowing banks to borrow funds more cheaply and hold them as reserves at the Federal Reserve, earning the IOER.7
Table 1: Changes in U.S. commercial banks' reserves and total loans shares: 2015 Q1 - 2018 Q4
| Model: | [1] | [2] | [3] | [4] |
|---|---|---|---|---|
| Dependent variable: | Quarterly Change in Reserves to Assets Ratio | Quarterly Change in Total Loans to Assets Ratio | Quarterly Change in Reserves to Assets Ratio | Quarterly Change in Total Loans to Assets Ratio |
| Δ IOER | -0.78 | -0.05 | ||
| [0.93] | [1.37] | |||
| Cap * Δ IOER | -0.07 | 0.06 | -0.07 | 0.08 |
| [0.09] | [0.13] | [0.09] | [0.13] | |
| Δ Spread | 8.22 | 7.69 | ||
| [6.37] | [9.41] | |||
| Cap * Δ Spread | -0.27 | -0.78 | -0.34 | -0.66 |
| [0.63] | [0.93] | [0.63] | [0.94] | |
| Cap | 0.12*** | -0.14 | 0.11*** | -0.14 |
| [0.03] | [0.04] | [0.03] | [0.04] | |
| Bank Balance Sheet Controls | Yes | Yes | Yes | Yes |
| Bank Fixed Effexts | Yes | Yes | Yes | Yes |
| Time Fixed Effects | No | No | Yes | Yes |
| Macro Controls and Time Trend Included | Yes | Yes | n/p | n/p |
| Observations | 8,446 | 8,446 | 8,446 | 8,446 |
| Number of banks | 563 | 580 | 563 | 580 |
| R-squared | 0.05 | 0.09 | 0.05 | 0.10 |
Note: Bank controls are the natural logarithm of total assets, the leverage ratio, return on equity, and net interest margin. Standard errors clustered at the bank level are in parentheses; *** p<0.01, ** p<0.05, * p<0.1. Regressions are estimated using “seemingly unrelated” regression (SUR) methods to account for the potential correlation of the error terms in the reserves and loans specifications. Standard errors are shown in brackets. "n/p" indicates that the set of fixed effects cannot be included.
Source: Federal Reserve Board Staff calculations; Consolidated Reports of Condition and Income, FFIEC 031/041; Federal Reserve Board Release on Selected Interest Rates (H.15); “Interest on Required Reserve Balances and Excess Balances” release; Reserve balances are based on Federal Reserve accounting records; Organization for Economic Cooperation and Development.
Table 2: Changes in U.S. commercial banks' reserves and total loans growth: 2015 Q1 - 2018 Q4
| Model: | [1] | [2] | [3] | [4] |
|---|---|---|---|---|
| Dependent variable: | Quarterly Growth of Reserves | Quarterly Growth of Total Loans | Quarterly Growth of Reserves | Quarterly Growth of Total Loans |
| Δ IOER | -29.41 | -2.44 | ||
| [25.14] | [2.37] | |||
| Cap * Δ IOER | -1.50 | 0.18 | -1.79 | 0.17 |
| [2.27] | [0.24] | [2.28] | [0.24] | |
| Δ Spread | 241.40 | 15.85 | ||
| [157.80] | [13.48] | |||
| Cap * Δ Spread | -6.28 | -0.38 | -7.96 | -0.33 |
| [14.83] | [1.33] | [14.87] | [1.32] | |
| Cap | 2.78*** | 0.16 | 2.56*** | 0.15 |
| [0.72] | [0.11] | [0.70] | [0.11] | |
| Bank Balance Sheet Controls | Yes | Yes | Yes | Yes |
| Bank Fixed Effexts | Yes | Yes | Yes | Yes |
| Time Fixed Effects | No | No | Yes | Yes |
| Macro Controls and Time Trend Included | Yes | Yes | n/p | n/p |
| Observations | 8,437 | 8,437 | 8,437 | 8,437 |
| Number of banks | 563 | 578 | 563 | 578 |
| R-squared | 0.04 | 0.25 | 0.05 | 0.25 |
Note: Bank controls are the natural logarithm of total assets, the leverage ratio, return on equity, and net interest margin. Standard errors clustered at the bank level are in parentheses; *** p<0.01, ** p<0.05, * p<0.1. Regressions are estimated using “seemingly unrelated” regression (SUR) methods to account for the potential correlation of the error terms in the reserves and loans specifications. Standard errors are shown in brackets. "n/p" indicates that the set of fixed effects cannot be included.
Source: Federal Reserve Board Staff calculations; Consolidated Reports of Condition and Income, FFIEC 031/041; Federal Reserve Board Release on Selected Interest Rates (H.15); “Interest on Required Reserve Balances and Excess Balances” release; Reserve balances are based on Federal Reserve accounting records; Organization for Economic Cooperation and Development.
Evidence from technical adjustments to the IOER rate
We next examine the period in which the FOMC made technical adjustments to the IOER rates in 2018. During that year, the FOMC increased the IOER rate and the target range of the federal funds rate in four meetings. In two of these meetings–the March and the September meetings–the IOER rate and the target range of the federal funds rate increased 25 basis points, the same magnitude as all rate increases since the start of the most recent tightening cycle in December 2015. However, in the other two meetings–the June and the December meetings–the FOMC added 20 basis points to the IOER rate and 25 basis points to the target range of the federal funds rate. These lower increases, or technical adjustments to the IOER rate, were intended to keep the EFFR, which remained close to the IOER rate during 2018, below the upper limit of the federal funds rate. Importantly, the changes in IOER in the technical adjustment periods were smaller than the changes in the target federal funds rate compared to periods in which there were no technical adjustments to the IOER rate. As such, changes in IOER over the period of interest are not driven purely by changes in the stance of monetary policy.
Figure 3 shows these changes in the IOER rate, the EFFR, and the target range of the federal funds rate over 2018. The IOER rate is higher and the spread between the IOER rate and the EFFR is lower, on average, in 2018 compared with the data from 2015 to 2018, shown in Figure 1. Figure 3 also shows that the technical adjustments in June and in December shifted the IOER rate down relative to the target range of the federal funds rate. Meanwhile, the EFFR moved closer to the IOER rate throughout the year.
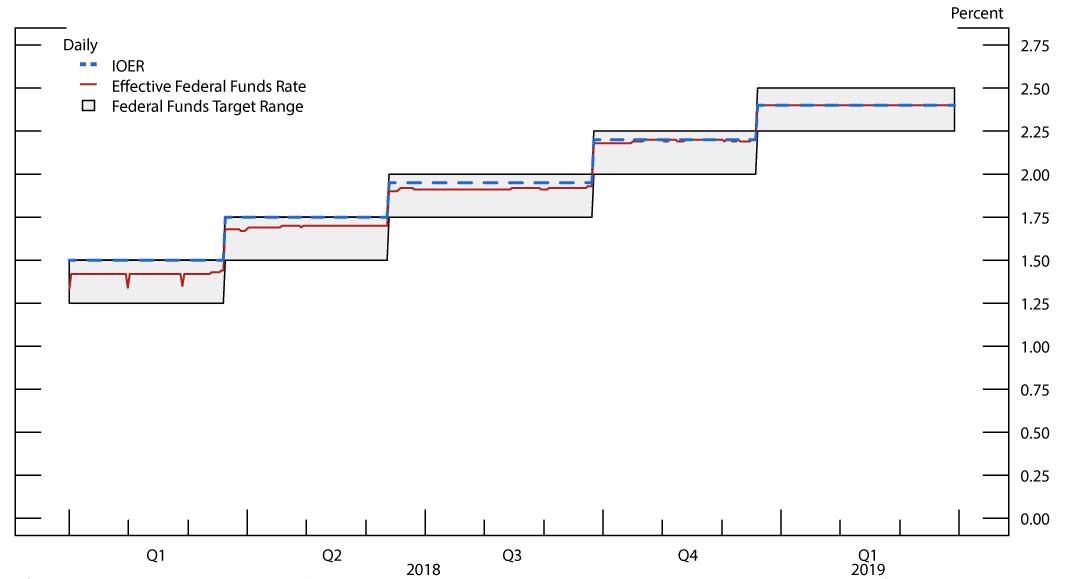
Source: Federal Reserve Board Staff calculations; Federal Reserve Board Release on Selected Interest Rates (H.15); “Interest on Required Reserve Balances and Excess Balances” release.
The technical adjustments allow us to distinguish the effects of the IOER rate from the effects of the federal funds rate because they impose different changes to those rates. We also restrict the sample to short periods before and after rate changes. This restriction reduces the likelihood that confounding bank-specific shocks to reserve demand and loan supply affect our results. We now use weekly data and measure changes in our variables over one-week periods. We measure these changes using Wednesday as the reference date because Wednesday is almost always the last day of FOMC meetings, when changes in the IOER rate and the federal funds rate are announced. Also, to ensure that the periods that we analyze have similar characteristics, we restrict the sample to one-week periods starting on the Wednesdays of the weeks of 2018 with an FOMC meeting in which the Committee increased the target range of the federal funds rate. Thus, we restrict the sample to the one-week periods starting on the Wednesday of the week of the March, June, September, and December 2018 FOMC meetings.
Specifically, we estimate equations (1) and (2) measuring time in weeks, implying that $$\Delta {Res}_{j,t}$$ , $$\Delta {Loans}_{j,t}$$, $$\Delta {Spread}_t$$, and $$\Delta {IOER}_t$$ now represent changes in reserves, loans, and the spread between the IOER rate and the EFFR, and the IOER rate over a week. In addition, we include in these equations the same bank characteristics that we use as independent variables in Tables 1 and 2. For the sake of brevity, we only present results of specifications with time fixed effects.8
Table 3 presents the estimation results of equations (1) and (2) using the weekly change in the ratios of reserves to assets and of loans to assets (columns 1 and 2) and the weekly growth rates of reserves and loans (columns 3 and 4) as dependent variables. In column 1, the coefficient of the interaction term between the change in the IOER rate and the leverage ratio is positive and statistically significant, indicating that better-capitalized banks raise their demand for reserves more than other banks in response to IOER rate increases. This result is consistent with the hypothesis that banks with higher capital ratios are less likely to be constrained by capital requirements, face lower funding costs, and are thus better able to profit from a positive IOER-EFFR spread. Therefore, their demand for reserves should respond more strongly to changes in the IOER rate compared to banks with lower capital ratios. Meanwhile, the coefficient of the interaction term between the change in the spread between the IOER rate and the EFFR and the leverage ratio is positive but not statistically significant.
Column 2 shows coefficient estimates of equation (2), which uses the weekly change in the ratio of loans to assets as the dependent variable. The coefficient estimates of the interaction terms are not statistically significant, indicating that–accounting for unobservable differences over time and across banks–the IOER rate and its spread over the EFFR do not affect banks' supply of loans. This results suggests that, although the IOER rate may affect bank credit by raising market interest rates, an effect that would be absorbed by time fixed effects, this rate–or its spread over the EFFR–does not independently affect banks' lending.
Table 3: Changes in U.S. Commercial Banks' Reserves and Total Loans: 2018 Rate Rises
| Model: | [1] | [2] | [3] | [4] |
|---|---|---|---|---|
| Dependent variable: | Weekly Change in Reserves to Assets Ratio | Weekly Change in Total Loans to Assets Ratio | Weekly Growth of Reserves | Weekly Growth of Total Loans |
| Cap * Δ IOER | 2.75*** | 0.16 | 17.98** | -27.06 |
| [0.65] | [0.21] | [7.84] | [30.96] | |
| Cap * Δ Spread | 14.22 | -0.63 | 139.82 | 92.39 |
| [8.66] | [1.99] | [97.20] | [90.39] | |
| Cap | 0.22 | -0.27 | 5.54 | 6.46 |
| [0.74] | [0.21] | [8.31] | [6.52] | |
| Bank Balance Sheet Controls | Yes | Yes | Yes | Yes |
| Bank Fixed Effexts | Yes | Yes | Yes | Yes |
| Time Fixed Effects | No | No | Yes | Yes |
| Observations | 1,306 | 1,362 | 1,252 | 1,357 |
| Number of banks | 341 | 356 | 330 | 354 |
| R-squared | 0.02 | 0.10 | 0.01 | 0.02 |
Note: Changes in columns 1 and 2 and growth rates in columns 3 and 4 are measured by comparing observations on the Wednesday of the weeks of the four FOMC meetings with federal funds rate changes in 2018 and the following Wednesday. Bank controls are the natural logarithm of total assets, the leverage ratio, return on equity, and net interest margin. Standard errors clustered at the bank level are in parentheses; *** p<0.01, ** p<0.05, * p<0.1. Standard errors are shown in brackets.
Source: Federal Reserve Board Staff calculations; Federal Reserve Board, Form FR 2644, Weekly Report of Selected Assets and Liabilities of Domestically Chartered Commercial Banks and U.S. Branches and Agencies of Foreign Banks; Consolidated Reports of Condition and Income, FFIEC 031/041; Federal Reserve Board Release on Selected Interest Rates (H.15); “Interest on Required Reserve Balances and Excess Balances” release.
In column 3, the coefficient estimate of the interaction term between the leverage ratio and the spread between the IOER rate and the EFFR is positive and statistically significant when we use the growth rate of reserves as the dependent variable. This result provides further support for the hypothesis that the IOER rate strengthens demand for reserves. Meanwhile, none of the coefficient estimates is statistically significant when we use the growth rate of loans as the dependent variable, also indicating that IOER does not affect banks' supply of loans. On balance, Table 3 provides evidence that the IOER rate strengthens demand for reserves and little indication that the IOER rate reduces banks' willingness to lend.9
Summary
In this note, we examined the relationship between changes in the IOER rate and banks' reserve holdings and lending. We find no evidence that a higher IOER rate or a higher spread between the IOER and EFFR rates affected banks' reserve holdings or lending over the 2015-2018 period. Second, for clearer identification we used weekly data over 2018 to estimate the impact of the technical adjustments to the IOER rate relative to the target federal funds rate on banks' reserves holdings and lending. While such changes in the IOER rate affected banks' reserve holdings, there is no evidence of an effect on bank lending.
References:
Bernanke, Ben and Mark Gertler (1995). "Inside the Black Box: The Credit Channel of Monetary Policy Transmission", Journal of Economic Perspectives, 9(4), pp. 27-48.
Bernanke, Ben and Donald Kohn (2016). "The Fed's Interest Payments to Banks," Brookings Institute post, February 16, 2016.
Campello, Murillo (2002). "International Capital Markets in Financial Conglomerates: Evidence from Small Bank Responses to Monetary Policy," The Journal of Finance 57(6), pp. 2773-2805.
Cetorelli, Nicola and Linda S. Goldberg (2012). "Banking Globalization and Monetary Transmission," The Journal of Finance 67(5), pp. 1811-43.
Ennis, Huberto M. (2018). "A Simple General Equilibrium Model of Large Excess Reserves", Journal of Monetary Economics (98), pp. 50-65.
Federal Open Market Committee (2014). "Policy Normalization Principles and Plans," September 16, available at https://www.federalreserve.gov/monetarypolicy/files/FOMC_PolicyNormalization.pdf.
Hogan, Thomas L. (2018). "Bank Lending and Interest on Excess Reserves," Rice University Baker Institute for Public Policy Working Paper.
Kashyap, Anil K., and Jeremy C. Stein (2000). "What Do a Million Observations on Banks Say about the Transmission of Monetary Policy?" American Economic Review 90(3), pp. 407-428.
Ihrig, Jane E., Ellen E. Meade, and Gretchen C. Weinbach (2015). "Rewriting Monetary Policy 101: What's the Fed's Preferred Post-Crisis Approach to Raising Interest Rates?," Journal of Economic Perspectives, 29(4), pp.177-98.
Kim, Raymond (2019). "Better than Risk-Free: Do Reserve Premiums Crowd Out Bank Lending?," working paper.
Lipscomb, Laura, Antoine Martin, and Heather Wiggins (2017). "Why Pay Interest on Excess Reserve Balances?," Federal Reserve Bank of New York Liberty Street Economics (blog), September 27, http://libertystreeteconomics.newyorkfed.org/2017/09/why-pay-interest-on-excess-reserve-balances.html.
Martin, Antoine, James McAndrews and David Skeie (2016). "Bank Lending in Times of Large Bank Reserves," International Journal of Central Banking 12(4), pp. 193-222.
Stiglitz, Joseph E., and Hamid Rashid (2016). "What's Holding Back the World Economy?," Project Syndicate (blog), February 8, https://www.project-syndicate.org/commentary/whats-holding-back-the-global-economy-by-joseph-e--stiglitz-and-hamid-rashid-2016-02?barrier=accesspaylog#u00qCz6Ab4qohYfT.99.
Williamson, Stephen D. (2019). "Interest on Reserves, Interbank Lending, and Monetary Policy," Journal of Monetary Economics 101, pp. 14-30.
1. We thank Jim Clouse and Rochelle Edge for comments and Max Gross for research assistance. The analysis and conclusions are those of the authors and do not necessarily reflect the views of the Federal Reserve System, its Board of Governors, or its staff. Return to text
2. The Federal Reserve began to pay interest on reserves in October 2008 to implement monetary policy, while its balance sheet expanded as a result of tools used in responding to the financial crisis and the ensuing recession. In September 2014, the Federal Open Market Committee (FOMC) announced that the Federal Reserve intended to control the federal funds rate and other short-term rates primarily by adjusting the IOER rate (FOMC, 2014). See Ihrig, Meade and Weinbach (2015) for a description of how the IOER rate is used in monetary policy implementation. Return to text
3. Before the introduction of IOER, through the Federal Reserve's setting of short-term interest rates, the rate on short-term risk free assets like repo or Treasury bills would rise to levels consistent with the FOMC's target rate. The rates on these assets would be the "risk free" alternative rate that banks would take into consideration in extending loans or purchasing securities. In periods in which IOER was not paid to banks, the negative relationship between short-term interest rates and bank lending was documented in Bernanke and Gertler (1995), Kashyap and Stein (2000), Campello (2002), and Cetorelli and Goldberg (2012). See, also, the note "Monetary Policy: What Are Its Goals? How Does It Work?" at https://www.federalreserve.gov/monetarypolicy/monetary-policy-what-are-its-goals-how-does-it-work.htm. Return to text
4. See, for example, Stiglitz and Rashid (2016), Hogan (2018), and Kim (2019). Return to text
5. Martin, McAndrews, and Skeie (2016), Ennis (2018), and Williamson (2019) develop models that quantify these effects. Bernanke and Kohn (2016) and Lipscomb, Martin, and Wiggins (2017) also argue that IOER prevents banks from engaging in costly activities to minimize their excess reserves. Return to text
6. Domestic banks with less than $1 billion of total assets held only about 2 percent of total reserves as of December 2018. This percentage is calculated using the Consolidated Report of Condition and Income and the Federal Reserve accounting records. Return to text
7. The bank fixed effects enter the regressions with highly significant coefficients, suggesting that time-invariant bank-specific characteristics (such as business model) may be important drivers of banks' portfolio reallocation choices. The time fixed effects, however, generally have insignificant coefficient estimates. Return to text
8. Coefficient estimates of specifications without time fixed effects are very similar to those of specifications with time fixed effects. These finding are consistent with the hypothesis that observations of one-week differences should be little affected by changes in unobservable time-varying factors affecting all banks. Return to text
9. Of note, the results in this table are similar when we use wider intervals of time to calculate the changes in ratios and the growth rates. In particular, the coefficient estimates of $$\lambda$$ in columns 1 and 3 decrease as we widen the interval but remain statistically significant. Return to text
Rezende, Marcelo, Judit Temesvary, and Rebecca Zarutskie (2019). "Interest on Excess Reserves and U.S. Commercial Bank Lending," FEDS Notes. Washington: Board of Governors of the Federal Reserve System, October 18, 2019, https://doi.org/10.17016/2380-7172.2453.
Disclaimer: FEDS Notes are articles in which Board staff offer their own views and present analysis on a range of topics in economics and finance. These articles are shorter and less technically oriented than FEDS Working Papers and IFDP papers.