FEDS Notes
July 05, 2022
Unemployment Insurance in Survey and Administrative Data
Jeff Larrimore, Jacob Mortenson, and David Splinter1
Introduction
Unemployment insurance was a centerpiece of the economic policy response to the Covid‑19 recession. Measuring the degree to which poverty was mitigated is necessary for evaluating the policy's success. However, the official source of income data for poverty statistics in the United States, the Census Bureau's Current Population Survey (CPS), fails to accurately capture these benefits. Researchers rely on the CPS to evaluate the effects of unemployment insurance (UI) benefits and the Census Bureau uses it to estimate official poverty rates (Shrider et al., 2021). Therefore, underreporting of benefits has major implications for public policy research.
In this paper, we compare UI benefit receipt in the CPS to that observed in IRS tax data. We extend previous research comparing national aggregates for UI receipt in the CPS to administrative totals (Gabe and Whittaker, 2012; Meyer et al., 2015; Rothbaum, 2015) by providing detailed information on the distribution of UI benefits. We then consider the implications of UI benefits underreporting on income statistics during the Covid-19 recession and show that after correcting for underreporting, poverty reached a record low in 2020.
Data
This paper uses two data sources. The first is a 5 percent random sample of all individuals in IRS tax data between 1999 and 2020. It includes annual tax returns (Form 1040) and information returns (Form 1099‑G) that report UI benefits.2 The information returns are provided by state governments to assist recipients with tax return preparation. Several states, however, did not include all UI payments on the available 1099-G forms, as discussed in Larrimore et al. (2022). To address these cases, when a taxpayer self-reports UI benefits on their tax return, we treat this reporting as accurate if it exceeds the amount reported on available forms. This adjustment increases 2020 UI payments by approximately 10 percent. Total estimated payments in IRS data are between BEA and Treasury department estimates and within 5 percent of both.3 We compare UI benefits from administrative IRS tax data with survey-reported benefits in the next-year March CPS (i.e., CPS-ASEC).4
Prevalence and distribution of UI benefits
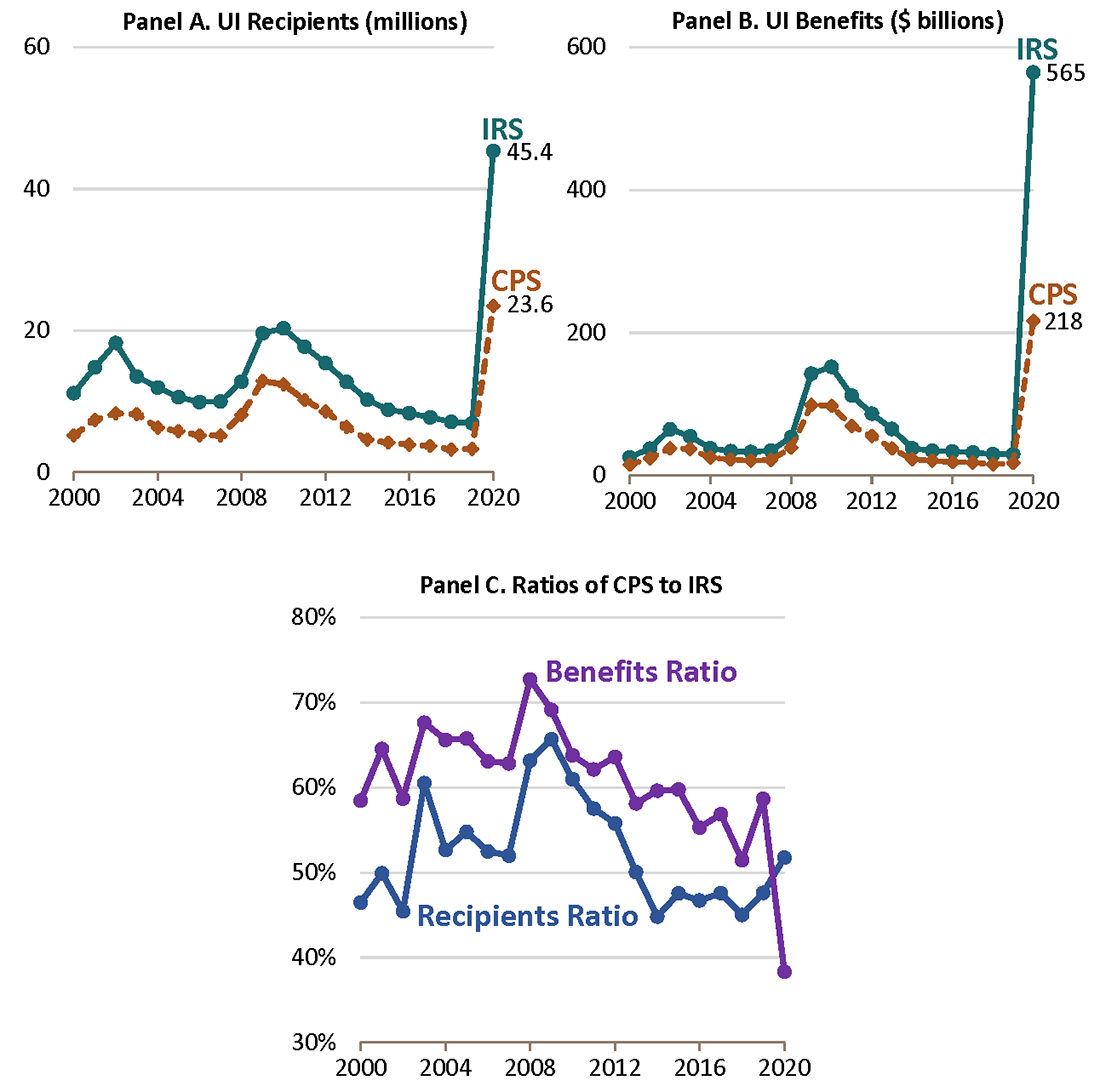
Relative to administrative data, the CPS dramatically understates the number of UI recipients and the level of UI benefits. In 2020, IRS data showed that 45.4 million people received UI benefits. The CPS has approximately half as many recipients: 23.6 million. The understatement in aggregate UI benefits was even larger. In 2020, IRS data include $565 billion of UI benefits and the CPS only $218 billion, undercounting by 60 percent.
The understatement of UI benefits in the CPS is a recurring problem in the CPS, though 2020 is particularly severe. Figure 1 displays the number of UI recipients (Panel A) and total UI benefits (Panel B) in the two datasets since 2000. Over this period, the CPS captured an average of 61 percent of UI benefits and 52 percent of recipients, relative to IRS data (Panel C). In addition, there has been a recent downward trend in the share of benefits captured in the CPS.

Source: Authors' calculations using CPS and IRS data.
There are two channels through which the CPS data can misstate benefits, and the source of the error can guide correction techniques. The first is on the extensive margin—misstating the number of recipients. The second is on the intensive margin—misstating the distribution of benefits among recipients. Figure 1 demonstrated that the CPS understates extensive margin recipiency rates. We now consider the distribution of benefits among recipients.
Figure 2 compares the cumulative share of UI benefits in the IRS and CPS data for two recent years. If undercounting in the CPS was only from extensive margin issues—recipients failing to report UI benefits in a manner uncorrelated with benefit amount—the two distributions will closely resemble one another. This was the case in 2019.

Notes: CDF of unemployment insurance (UI) benefits per individual recipient.
Source: Authors' calculations using CPS and IRS data.
The distributions in 2020, however, were different. In the CPS, the median UI payment was $7,000—well below the approximately $11,400 median payment in IRS data. The distribution for the IRS data lies to right of the analogous CPS distribution, implying that the CPS understated 2020 benefits among recipients.
Distribution of UI by income
A major implication of UI benefit underreporting in the CPS is an overstatement of poverty rates. This is a particular concern in 2020, when UI benefits were more prevalent and more generous. Parker (2012) finds that the understatement of SNAP benefits in the CPS results in an overstatement of the Supplemental Poverty Measure, and similar effects are expected if other benefits are underreported.5 Poverty rates, however, will only be affected to the extent that the missing benefits are among low-income populations otherwise below the poverty threshold.
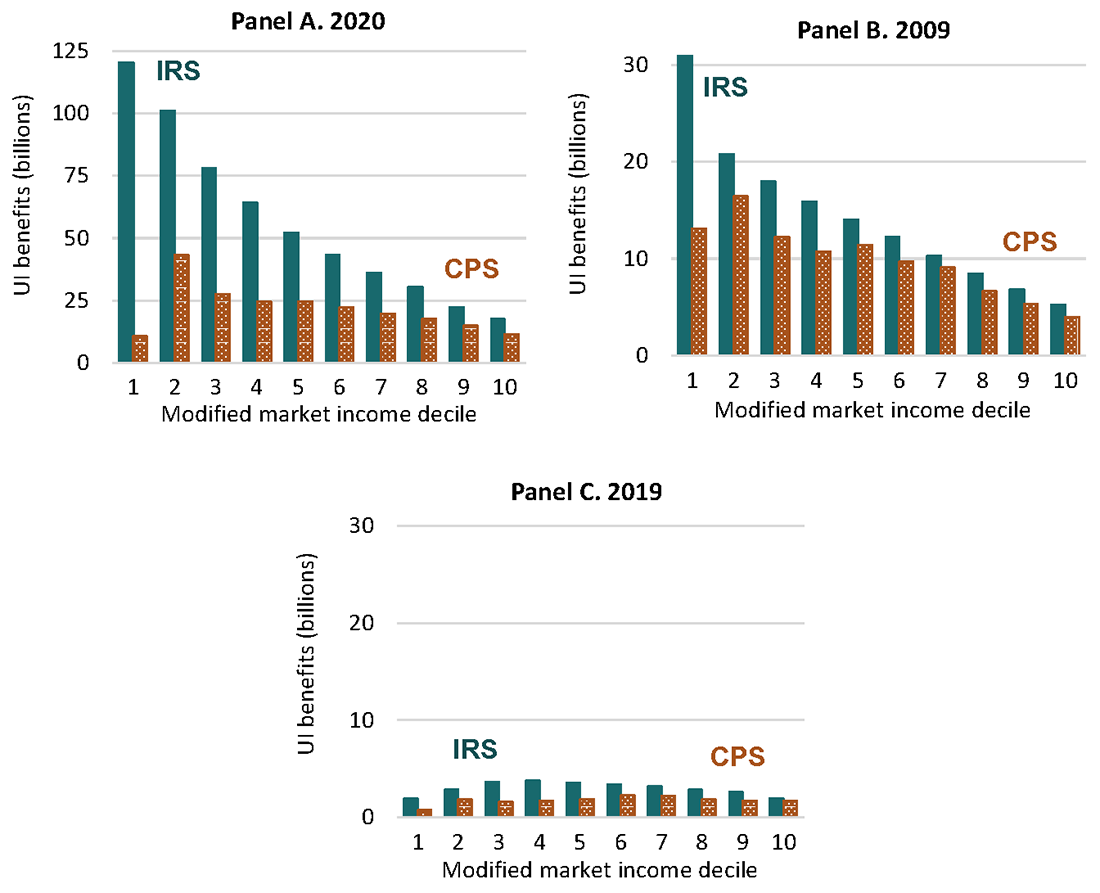
Figure 3 shows the distribution of UI benefits by income decile in two recessionary years, 2020 (Panel A) and 2009 (Panel B), and one expansionary year, 2019 (Panel C). In both the CPS and IRS data, income deciles are based on modified market income—market income, alimony, and Social Security benefits—reflecting income that appears in both datasets but excluding UI. Incomes are aggregated at the tax-unit level for ages 16 and older and then split equally between spouses, following Larrimore et al. (forthcoming).

Notes: Income is market income, alimony, and Social Security benefits of tax units, split equally for married couples.
Source: Authors' calculations using CPS and IRS data.
In 2020, the CPS underreported UI benefits in the bottom two deciles by $168 billion. For context, this exceeds the $118 billion of total modified market income in the bottom two deciles in the CPS. Near the top of the income distribution, the CPS and IRS results were closer.
During the 2009 recession year, a similar pattern of underestimating benefits for low-income groups occurred—although UI benefit levels were smaller (note the vertical axis change). In contrast, during the 2019 expansion UI benefits were proportionally underreported over nearly the entire income distribution.
To facilitate correcting for UI underreporting in CPS data, in the online data we provide detailed estimates using tax data. For 1999 to 2020, we estimate the share of individuals receiving any UI, average UI benefits, and the standard deviation of benefits for 100 income percentiles. Using these data, we estimate 2020 poverty rates in the CPS with corrected UI benefits. We assign UI benefits to CPS respondents who do not report receiving them, such that the recipiency rate and average benefit matches the IRS data for each income centile.6
Because the underreporting of UI benefits is most severe among low-incomes populations during recessions, this underreporting exacerbated poverty rate estimates in 2020. Using the imputation approach above to fully incorporate UI benefits in the CPS, the poverty rate in 2020 would have fallen from the previous record low (10.5 percent as originally reported) in 2019 to approximately 9.6 percent, rather than the increase to 11.4 percent reported by the Census Bureau.7 This would have been the first time that the official poverty rate fell below 10 percent over the more than six decades that the Census computes the measure.8
UI exclusion tax expenditure
Tax data are well-suited to evaluate a policy that provided additional relief to most UI recipients: the 2020 exclusion of UI benefits from income taxes. The reduction in taxes from this exclusion is called a tax expenditure because it is equivalent to spending through the tax system. We estimate this tax expenditure by multiplying the maximum allowed exclusion (i.e., assuming full take up) by recipients' marginal tax rates, adjusted for bracket changes. This tax expenditure's estimated $21 billion is similar to the amount of UI benefits received in recent expansionary years.
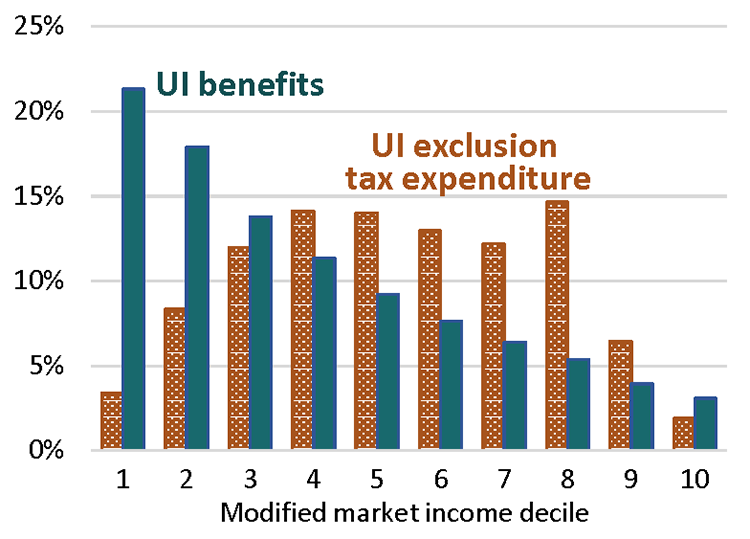
Because the exclusion of UI benefits from taxation was more valuable for those with higher marginal tax rates, this benefit's distribution differs from that of UI benefits. Figure 4 shows that the bottom decile received 21 percent of UI benefits but only 3 percent of UI exclusion tax expenditures. The top half of the income distribution received only one-quarter of UI benefits but half of exclusion tax expenditures.9 Therefore, relative to UI benefits, the UI exclusion was less targeted at the bottom of the income distribution.

Notes: Income is market income, alimony, and Social Security benefits of tax units, split equally for married couples.
Source: Authors' calculations using IRS data.
Conclusion
Unemployment insurance benefits made up a large share of fiscal relief during the Covid‑19 recession. Yet, over half of UI benefits were missed in major survey data with severe understatement among low-income workers. UI was therefore more important during the Covid‑19 recession than is apparent in survey data and official poverty statistics. However, compared to UI benefits, the exclusion of UI benefits from taxation was less targeted at low incomes. Finally, we provide data to ameliorate UI underreporting in surveys.
References
Gabe, T., Whittaker, J.M. 2012. Antipovety effects of unemployment insurance (PDF). Congressional Research Service report R41777.
Flood, S., King, M., Rodgers, R., Ruggles, S., Warren, J.R., Westberry, M. 2022. Integrated Public Use Microdata Series, Current Population Survey: Version 9.0 [dataset]. Minneapolis, MN: IPUMS, 2021. https://doi.org/10.18128/D030.V9.0
Larrimore, J., Mortenson, J., Splinter, D. 2022. Earnings shocks and stabilization during COVID-19, https://www.sciencedirect.com/science/article/pii/S0047272721002334. Journal of Public Economics 206: 104597.
Larrimore, J., Mortenson, J., Splinter, D. Forthcoming. Income declines during COVID-19, http://www.davidsplinter.com/LMS-2022-Covid-Income-Changes.pdf. AEA Papers & Proceedings.
Meyer, B.D., Mok, W.K.C., Sullivan, J.X. 2015. The under‐reporting of transfers in household surveys: Its nature and consequences (PDF). Harris School of Public Policy Studies, University of Chicago working paper.
Parker, J. 2012. SNAP misreporting on the CPS: Does it affect poverty estimates? (PDF) U.S. Census Bureau, SEHSD working paper 2012-01.
Rothbaum, J.L. 2015. Comparing income aggregates: How do the CPS and ACS Match the National Income and Product Accounts, 2007–2012 (PDF). U.S. Census Bureau, SEHSD working paper 2015-01.
Rothbaum, J.L., Bee, A. 2021. Coronavirus infects surveys too: Survey nonresponse bias and the Coronavirus pandemic. U.S. Census Bureau SEHSD working paper 2020-10.
Shrider, E.A., Kollar, M., Chen, F., Semega, J. 2021. Income and poverty in the United States: 2020. U.S. Census Bureau Report P60-273.
1. Larrimore is with the Board of Governors of the Federal Reserve System, although the views expressed in this article are the authors' alone and do not indicate concurrence by other members of the Federal Reserve System staff or the Board of Governors. Mortenson and Splinter are with the Joint Committee on Taxation and this paper embodies work undertaken for the Committee, but as members of both parties and both houses of Congress comprise the Joint Committee on Taxation, this work should not be construed to represent the position of any member of the Committee. The authors would like to thank Meredith Decker, Marina Gindelsky, and Brooks Pierce for helpful comments on the paper. Online data is available at www.davidsplinter.com. Return to text
2. The IRS forms refer to this income as unemployment compensation, although we use the term UI to be consistent with other researchers. In both the IRS and CPS data, this includes supplemental unemployment benefits. Return to text
3. See NIPA table 3.12 and Daily Treasury Statements at https://fsapps.fiscal.treasury.gov/dts/issues/collapsed. Return to text
4. CPS statistics are from IPUMS-CPS data (Flood et al. 2022) and include standard Census nonresponse imputations. We use revised 2019–2021 weights to account for non-random nonresponse during the pandemic identified by Rothbaum and Bee (2021). Return to text
5. Because the official poverty measure excludes in-kind benefits, SNAP benefits will not affect official poverty rates. However, since UI is a cash program, underreporting affects both poverty measures. Return to text
6. Imputed values are also assumed to have a standard deviation matching IRS data. Since incomes are similar within each percentile, estimates of aggregate poverty rates (as opposed to subgroup analyses) are not sensitive to which individuals are randomly assigned to receive UI benefits. Return to text
7. The 9.6 percent poverty rate incorporates the revised Rothbaum and Bee (2021) weights as well as the reduction from the imputation of UI. Using original CPS weights, poverty would have been 9.3 percent after our UI imputation. Return to text
8. In 2020, the bottom decile had $110 billion of underreported UI benefits, over $4,000 per adult, and correct bottom-decile UI replaced about three times lost annual earnings (Larrimore et al., 2022). The 2019 poverty rate declines only about 0.1 percentage point from correcting UI. Return to text
9. The tax exclusion declines for the top decile because the benefit is limited to taxpayers with a modified AGI of less than $150,000. See www.irs.gov/newsroom/2020-unemployment-compensation-exclusion-faqs-topic-a-eligibility. Return to text
Larrimore, Jeff, Jacob Mortenson, and David Splinter (2022). "Unemployment Insurance in Survey and Administrative Data," FEDS Notes. Washington: Board of Governors of the Federal Reserve System, July 5, 2022, https://doi.org/10.17016/2380-7172.3135.
Disclaimer: FEDS Notes are articles in which Board staff offer their own views and present analysis on a range of topics in economics and finance. These articles are shorter and less technically oriented than FEDS Working Papers and IFDP papers.