IFDP Notes
September 28, 2017
China's Footprints on the Global Economy: Remarks delivered at the Second IMF and Federal Reserve Bank of Atlanta Research Workshop on the Chinese Economy
Thank you for your very kind introduction. And thank you for inviting me to this conference on China's economy and giving me the opportunity to present these lunchtime remarks. Usually, I am writing speeches for others, so I was very happy for this opportunity to write one for myself. With all of the excellent papers we heard yesterday and this morning and Maury Obstfeld's insightful dinner remarks last evening, I carry the risk that perhaps you are now getting an overdose of China. But my impression actually is that even as Chinese tangible trade has slowed, the global appetite for the trading of ideas about China remains infinite. My remarks here represent my own views and should not be interpreted as those of others in the Federal Reserve System.
China's economy has made huge strides over the past several decades. These strides have had profound implications for its citizens and have left large footprints on the global economy. In my remarks today, I will explore some key aspects of China's economic rise, the spillovers to the rest of the world that this rise has created, and the potential implications of these spillovers for the global economy going forward. I will argue that China is now at a crossroads, facing some medium-term risks and longer-term challenges, and how China navigates these crossroads will have important implications around the world. In particular, were the Chinese economy to slow sharply, this outcome has the potential to roil the global economy. But there are things that Chinese authorities can do as further preventive measures to reduce the country's vulnerabilities.
China's Rise and Spillovers
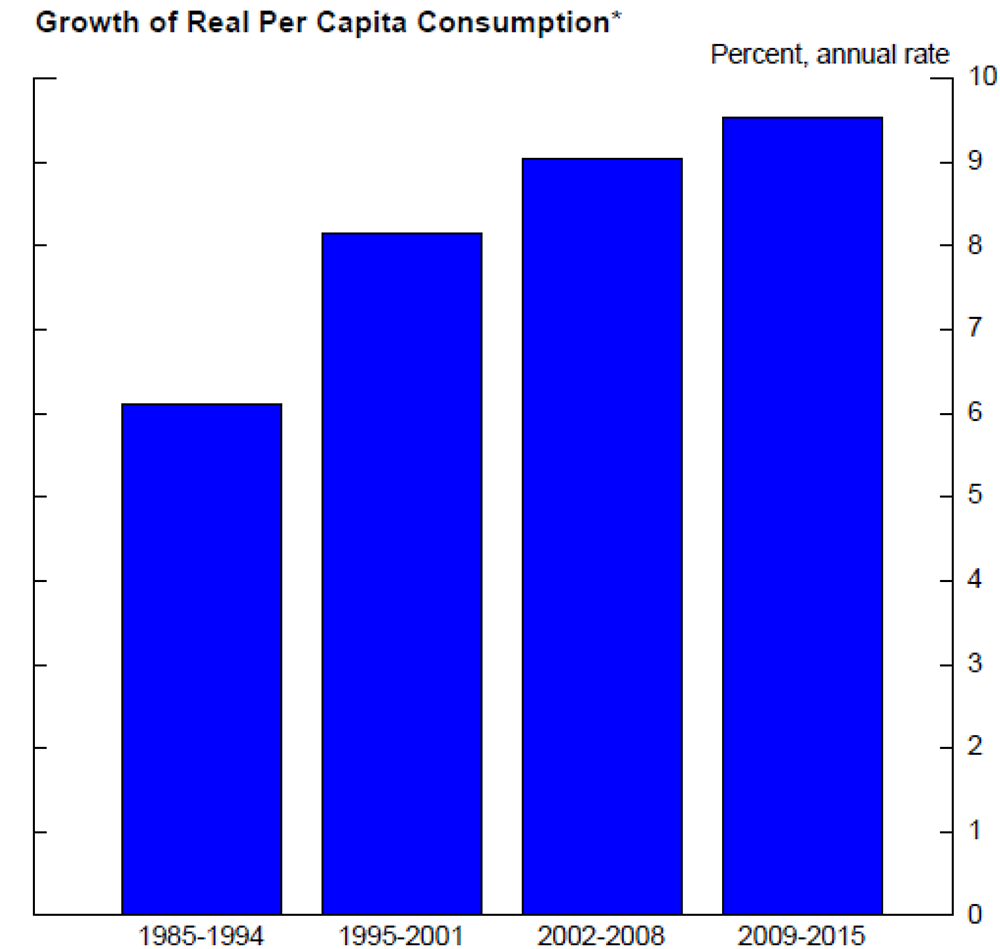
China's economic performance has been remarkable. For about 30 years before the start of the current decade, Chinese real gross domestic product (GDP) growth averaged 10 percent (slide 1). Lately, growth has slowed significantly but is still quite high relative to most economies. The strong performance over several decades led to a substantial acceleration of per capita consumption and helped vastly improve standards of living and take many millions of Chinese people out of poverty (slide 2).
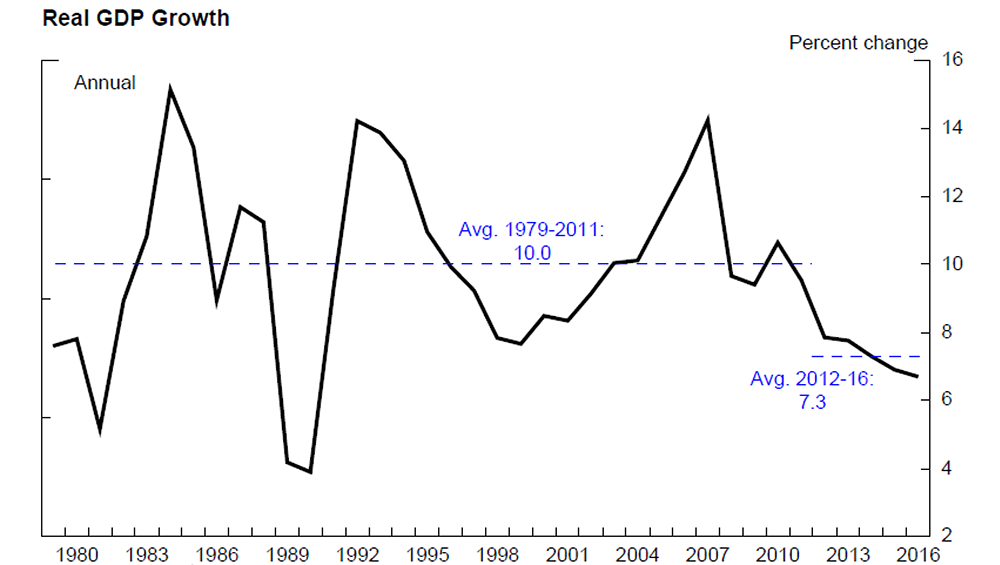
Source: Haver Analytics
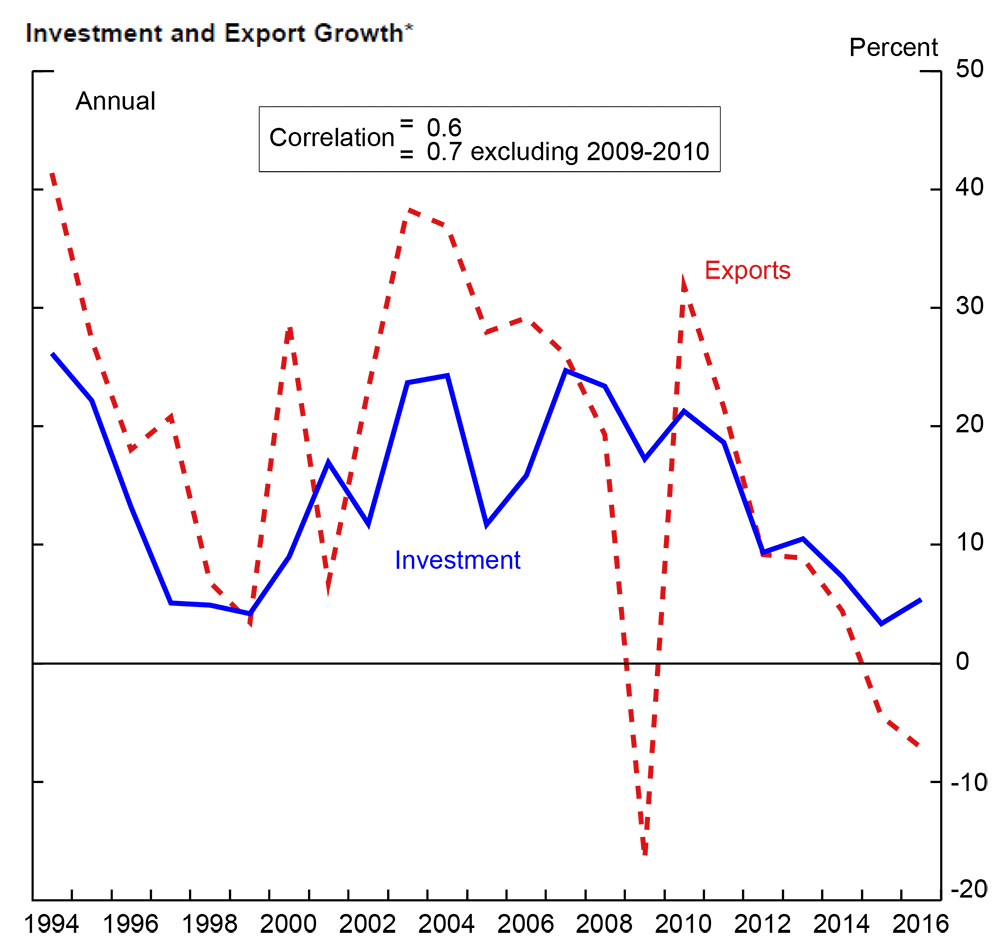
How was this rise achieved? In short, China used its cheap and large labor supply to expand its manufacturing base and play an ever-increasing role in meeting the world's external demand. Strong export growth, supported by export-led investment, underpinned Chinese growth (slide 3). Note the quite high correlation between growth of exports and investment, which weakened during the Global Financial Crisis (GFC), when investment was used to support a massive stimulus package even as exports slowed sharply. China's growth model was also based on export processing zones, industrial policies that gave preferential tax treatments to exporters, and—to some extent—an undervalued currency (with accompanying massive foreign exchange reserves accumulation).
Exports far outpaced imports, which means that savings rose even faster than investment and a large current account surplus built up (slide 4). As such, even though consumption per capita grew rapidly, China's consumption share of GDP remains low compared with other emerging market economies (EMEs), two of which are shown here (slide 5). All that said, it bears noting that for most of the period, it was not the rise in net exports per se that contributed to China's growth rates; for example, even over the years from 2003 to 2008, when China was fast gaining from its recently acquired entry into the World Trade Organization (WTO), the arithmetic contribution of net exports to growth averaged only 1½ percentage points. Rather, trade propelled China's growth by providing the country with a market for manufactured goods and allowing it to exploit huge productivity gains by moving from agriculture to industry.

Source: Haver Analytics

Turning to spillovers and how China's rise has affected other economies, a key channel has been China's role as a conduit—the endpoint of a giant Asian supply chain—which has also boosted some other economies in the region. The conduit role, of course, ultimately depends on final demand that comes from other countries.
As can be seen in slide 6, China's share of parts and components in its total manufactured imports (shown by the yellow bars on the left) rose between 1995 and 2005 and has been much higher than its share of parts and components in its total manufactured exports (shown to the right). These properties are consistent with China being an endpoint of a large global value chain and shipping mostly final goods abroad. Moreover, the share of parts and components in China's imports from other Asian economies (the green bars on the left) is significantly higher than in imports from the rest of the world (the blue bars), pointing to the special role of the rest of Asia in partnering with China in the process of "production fragmentation." Lately, the share of parts and components in China's imports has fallen substantially, something to which I will return later.
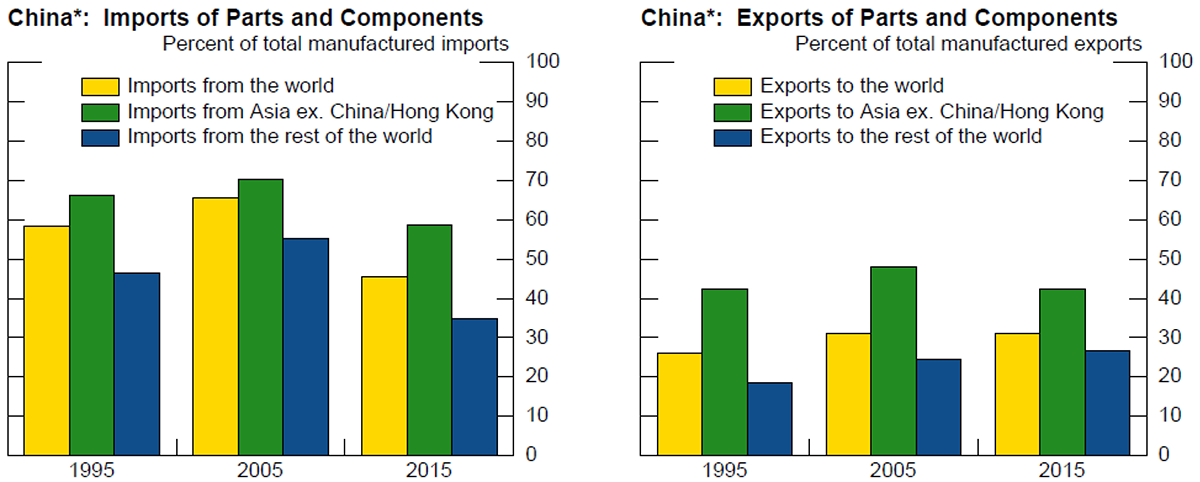
*Includes Hong Kong
Source: FRB staff estimated based on United Nations Comtrade data
Updated using the methodology of Haltmaier et. al (2007). Asia ex. China includes following selection in Comtrade: India, Indonesia, Japan, Malaysia, Philippines, Singapore, South Korea, Thailand, Vietnam, and Other Asia
Key identifies bar segments from left to right within each period.
China has also boosted commodity net-exporters around the world through its voracious demand for various commodities, which has been a key driver of world prices of these commodities. China now accounts for more than 10 percent of the global demand for oil and about half of the world's demand for steel, coal, and copper (slide 7).
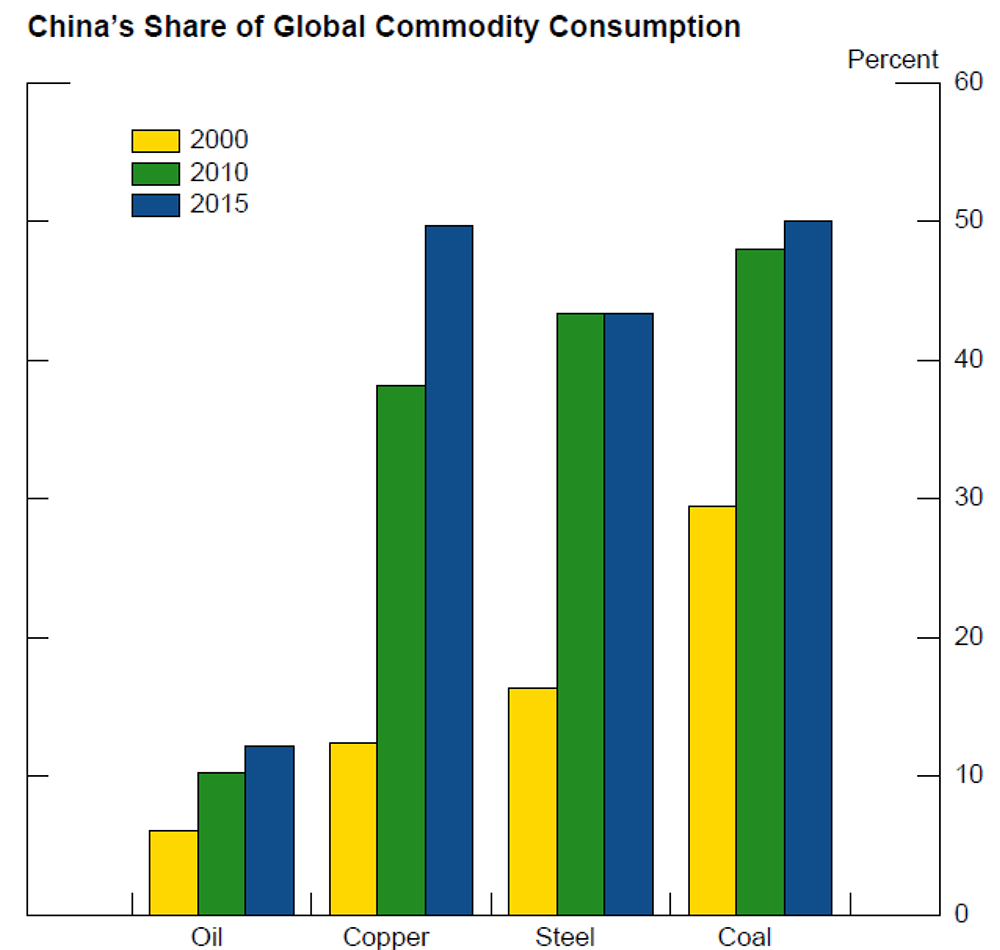
Source: oil from International Energy Association, copper from Bloomberg, steel from Worldsteel Association's Steel Statistical Yearbook 2016, and coal from BP Statistical Review of World Energy, June 2016.
Key identifies bar segments from left to right within each commodity category.
Through these specific channels, China helped lift many other EMEs, but its rise has had much broader ramifications. Increased production fragmentation—and China's special role in it, given its low-cost labor—is a natural outgrowth of the principle of comparative advantage. This process efficiently made available a larger variety of goods to consumers at lower prices all over the world, thus also benefiting the advanced economies, which are the biggest demanders of consumer goods.
Not all regions have necessarily benefited from China's rise, though. To some countries, China may have appeared to be more of a steamroller. For example, after the Multi-Fibre Arrangement (MFA) on textiles expired in 2004, other textile exporters found it very difficult to compete with China.2 Similarly, the years following China joining the WTO in 2001 were kind of a testy period for Mexico.3
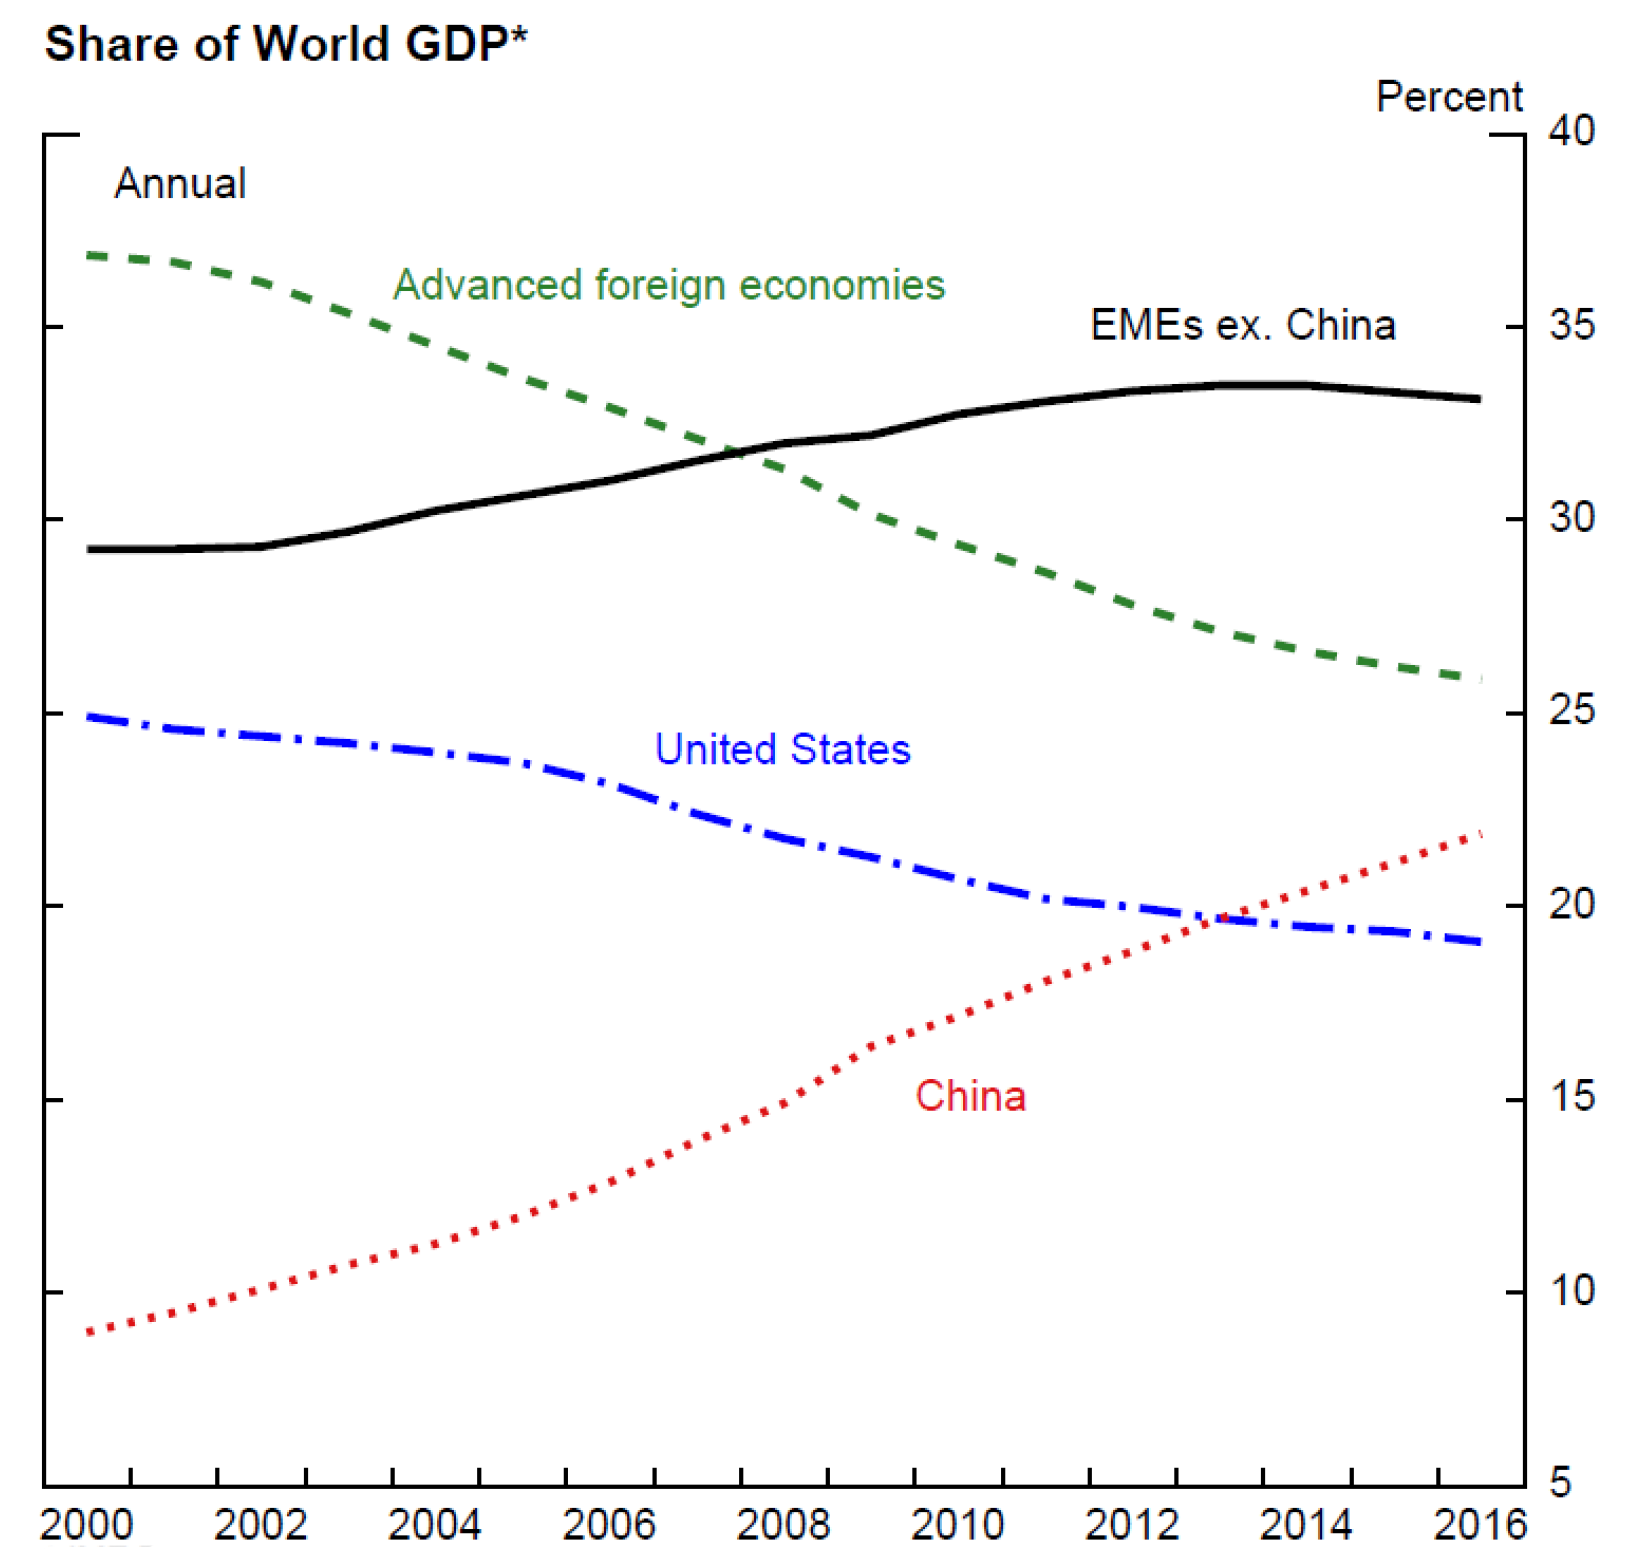
China's rise is reflected in it becoming a much greater player in the global economy. First, China's share in global trade has trended up sharply since the early 2000s, reaching double-digit levels earlier in this decade, before falling back a bit recently (slide 8).4 Second, over the past two decades, the share of China in world GDP has risen markedly, along with the shares of other EMEs (slide 9). China by itself now accounts for almost 20 percent of world GDP, using purchasing power parity weights, while the EMEs together now account for over half.

Source: IMF
Let's look now in more detail at how China's influence on the global economy has changed in recent years.
One clear trend over the past several years is the decline in the import content of Chinese exports. "Processing" exports—whereby parts and components are imported and assembled or processed into final goods for export—have seen their share of total exports decline to just 35 percent from more than 50 percent before 2007, with the share of "non-processing" exports commensurately rising to 65 percent (slide 10). Non-processing exports have a larger share of inputs that are domestically sourced.5 Moreover, the gray bars in the slide show that even "processing" exports now have more domestic value-added with relatively less contribution from imported inputs than before.6 To the extent that this development reflects China moving up the quality and technology ladder, it may now, in some industries, have become more of a competitor with some of its Asian neighbors rather than the end-point of the supply chain.
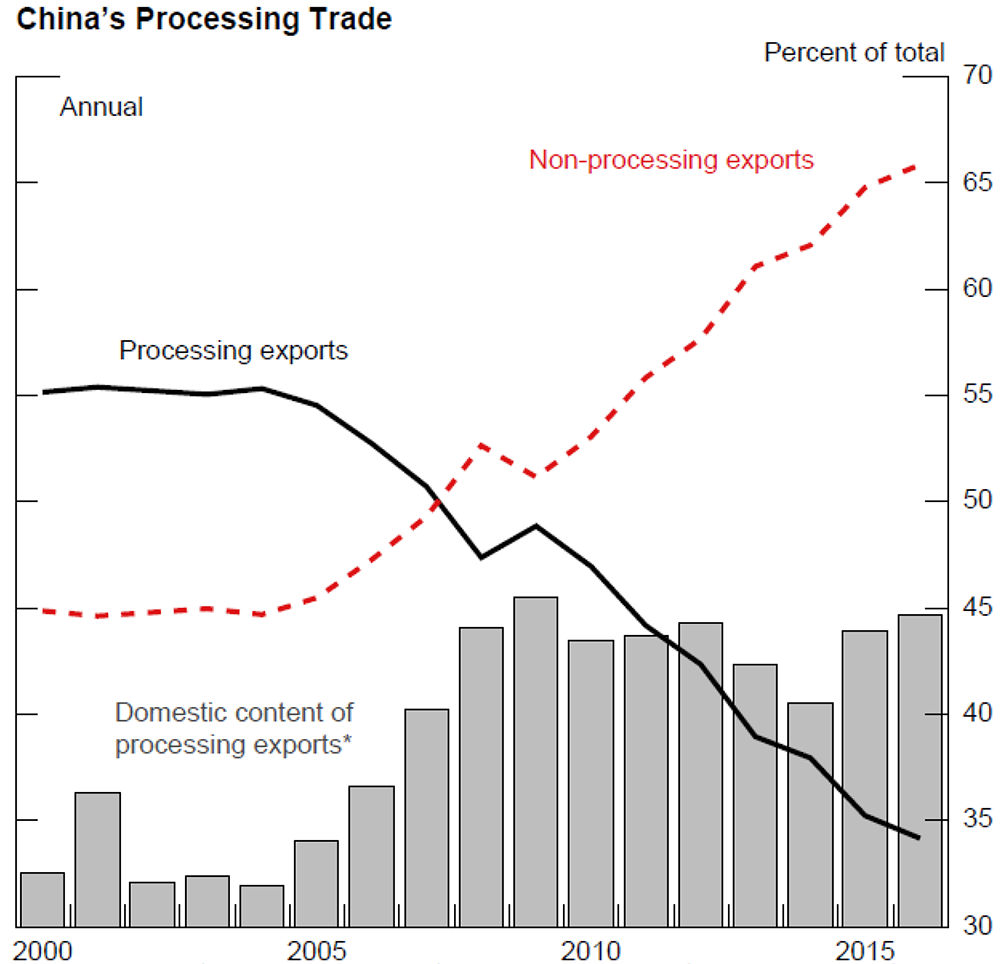
*Processing exports less processing imports, expressed as a percent of processing exports.
Source: Haver Analytics, FRB staff estimates
We can see the reduced role of processing trade on the imports side as well in this next slide, consistent with the parts and components imports chart I showed you earlier (slide 11). The much lower share of processing imports in total imports is consistent with two hypotheses—one, that more domestically sourced inputs are being used in the export goods being produced (for which I showed you some evidence in the slide 10), and the other that goods are being increasingly imported for domestic use and consumption rather than largely just channeling final demand from other economies.7
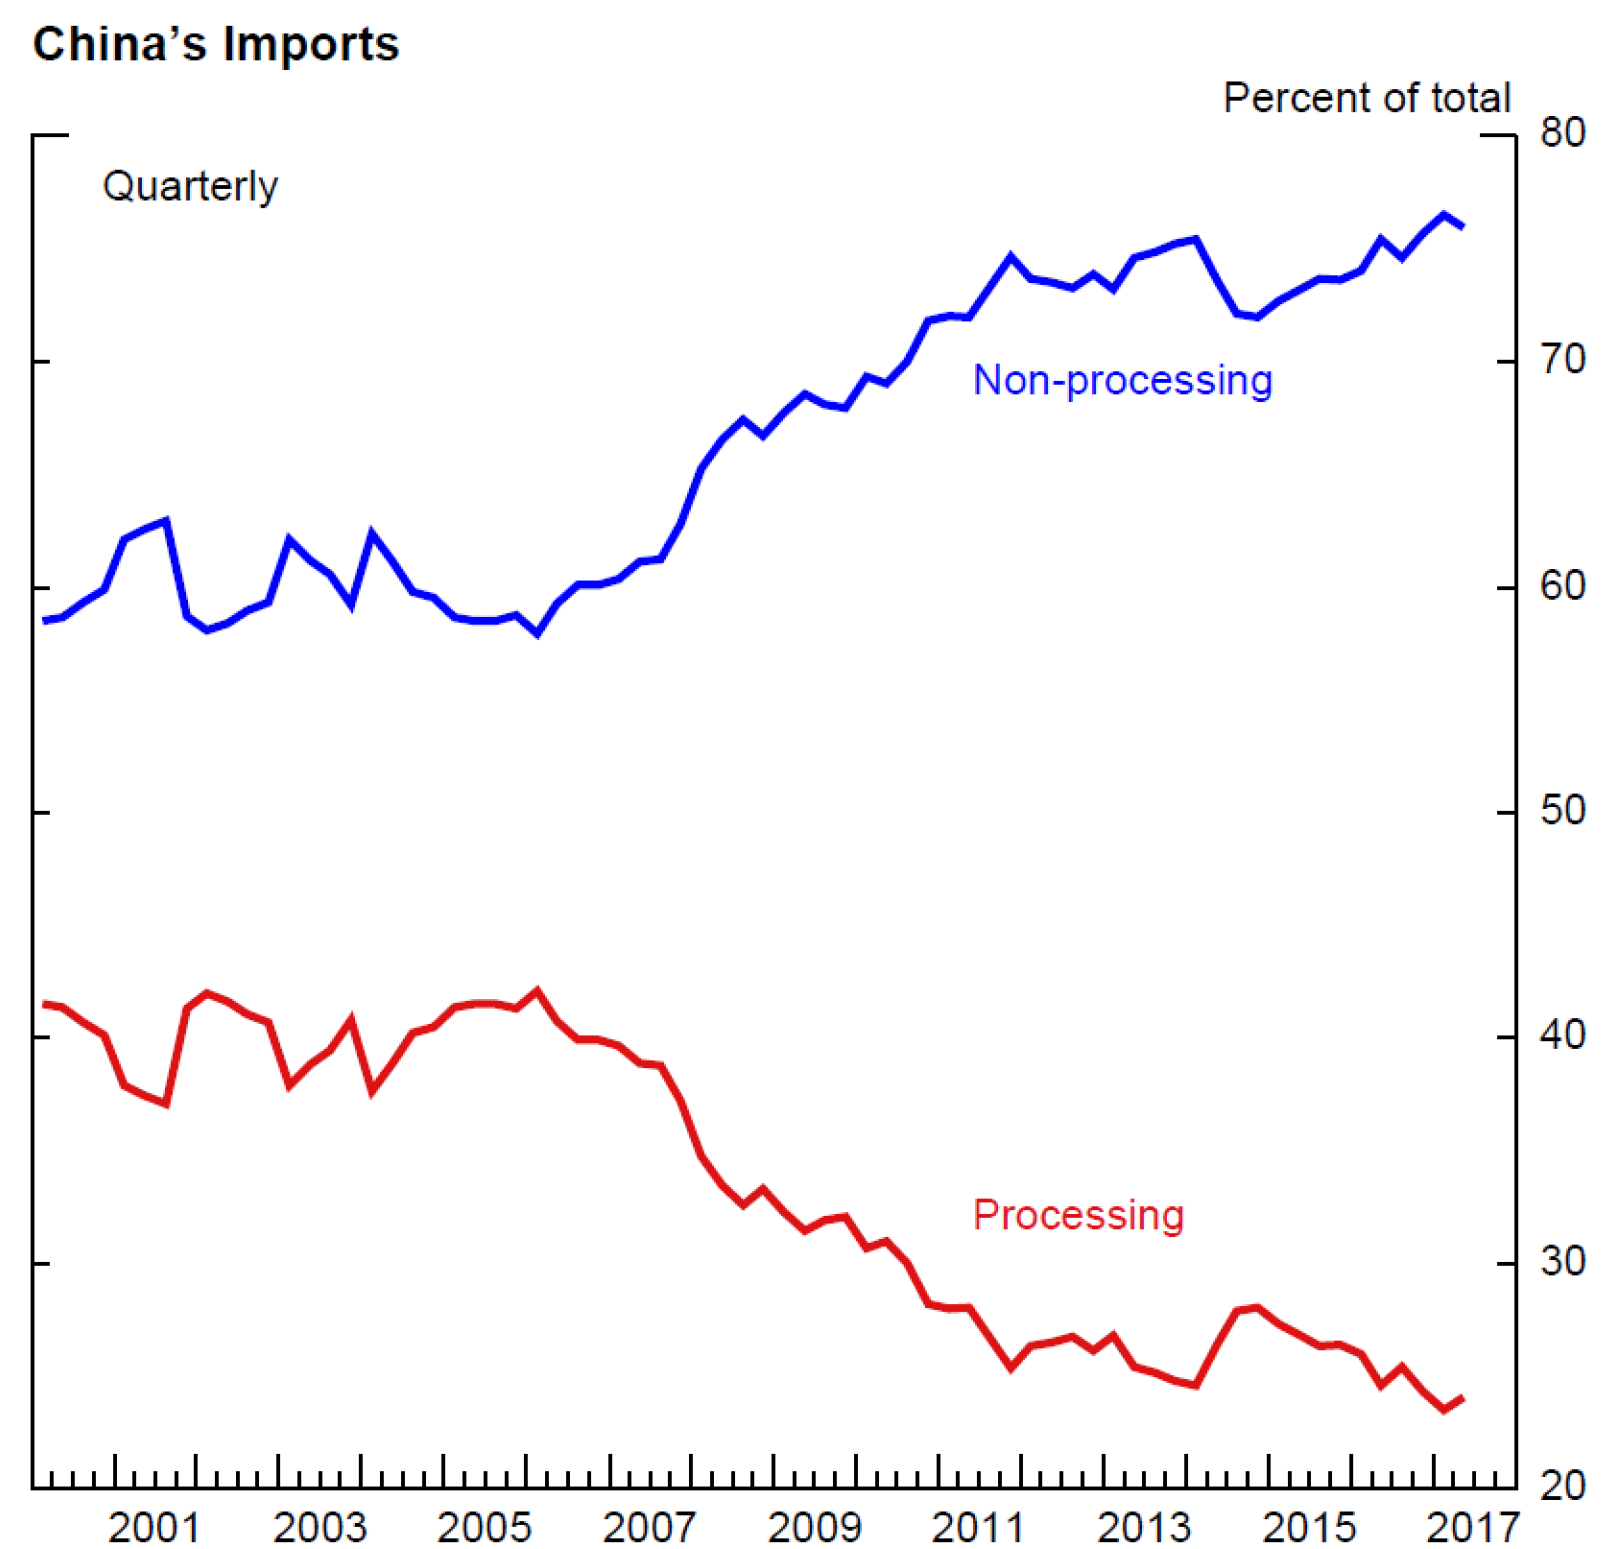
Source: Haver Analytics and FRB staff estimates
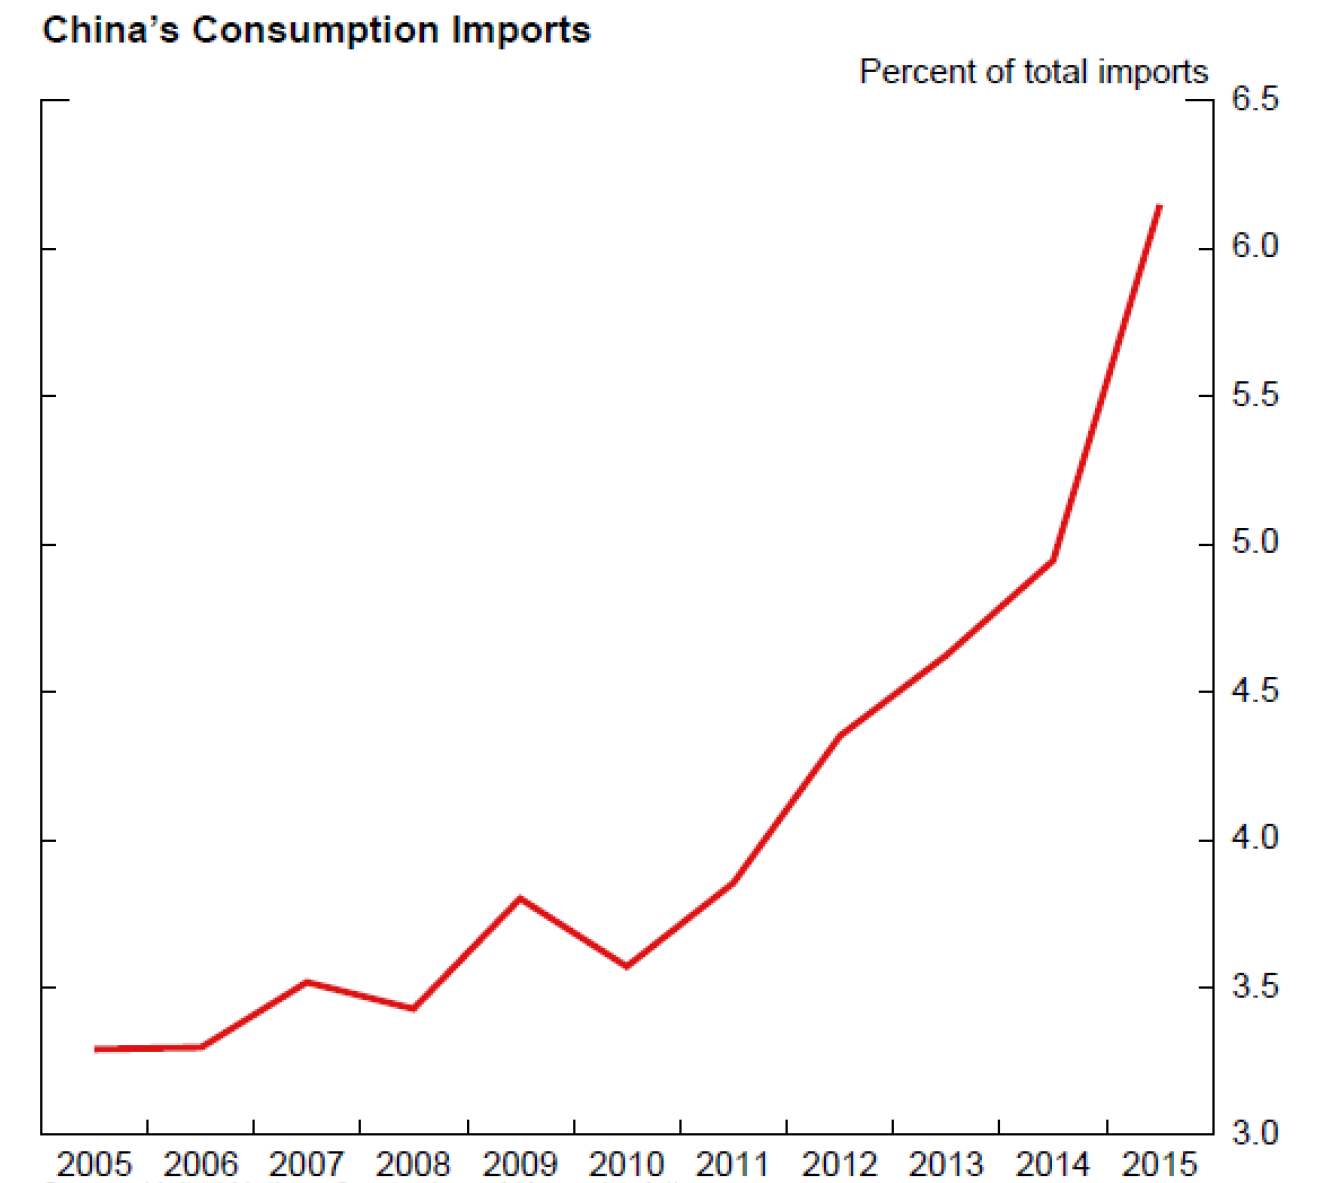
So, what evidence do we have of the rising role of Chinese consumers as an engine of global demand? This next slide plots values of Chinese imports by broad categories (first chart of slide 12). The red bars for consumption imports are barely visible until the turn of the decade. Nonetheless, they have been rising since then (albeit from a very small base), and, as shown on the second chart of slide 12, the share of consumption goods in total Chinese imports, while still quite low, has nearly doubled since 2010 to over 6 percent.
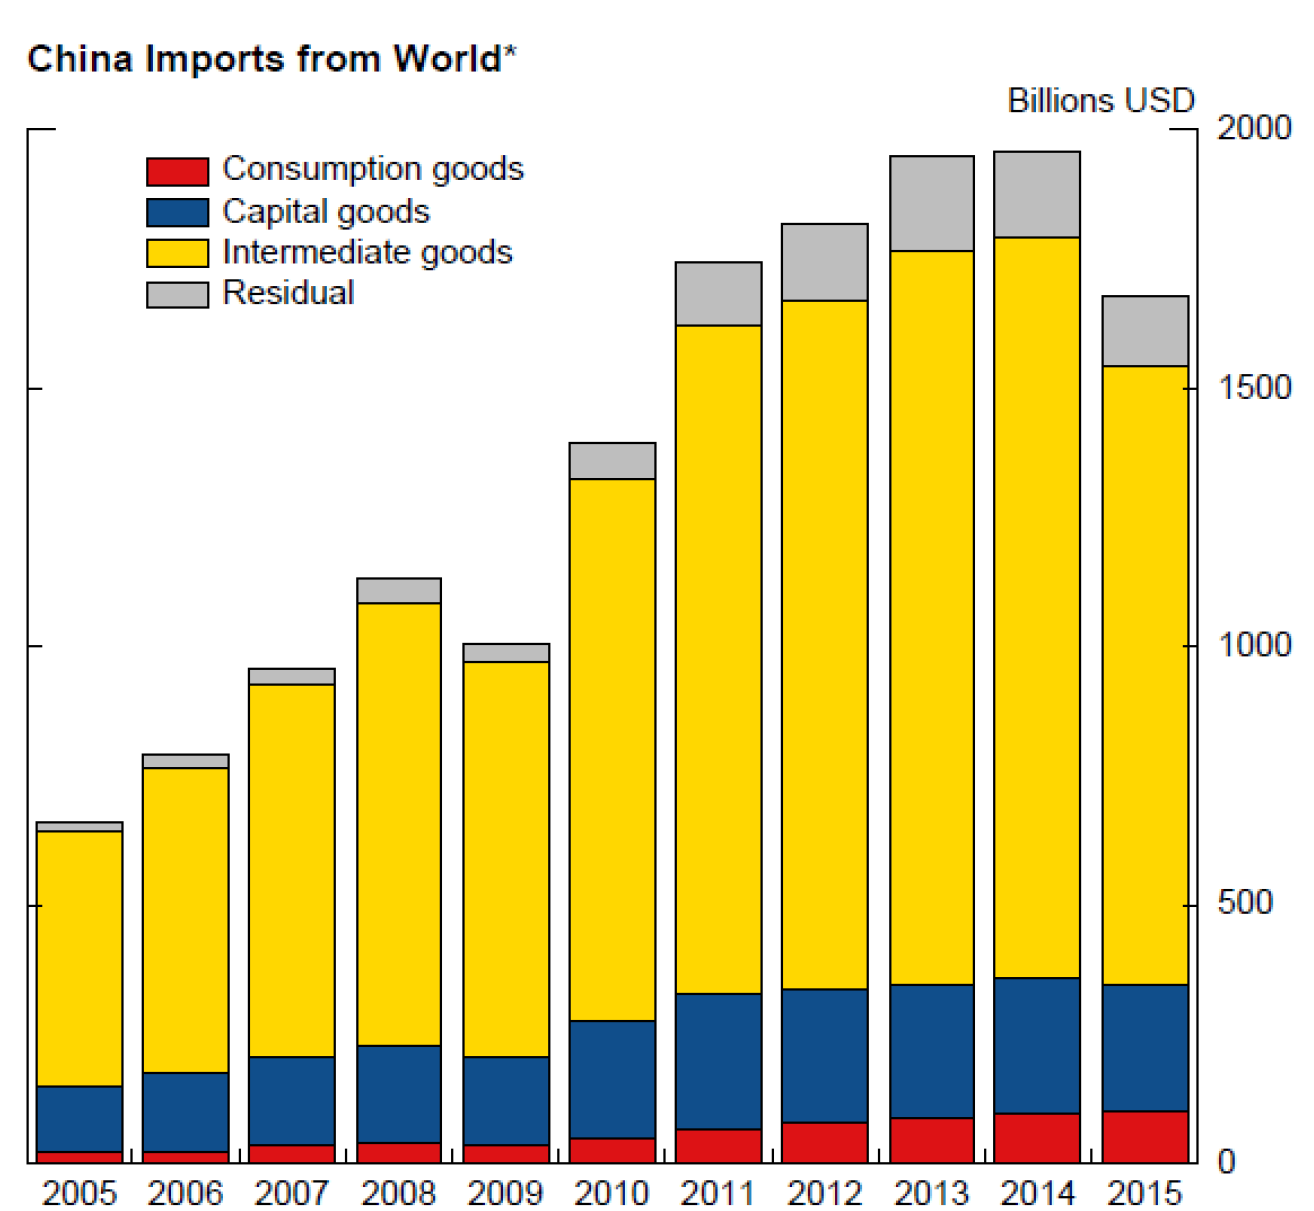
*Imports are classified into consumption, capital, and intermediate goods according to the UN Broad Economic Categories Classification System (rev. 4). Consumption goods include the following: primary and processed food and beverages for household consumption, non-industrial transport equipment and parts and accessories, and durable and semi- and non-durable consumer goods not elsewhere specified.
Source: United Nations Comtrade
Key identifies segments from bottom to top for each period.
Source: United Nations Comtrade and Haver Analytics
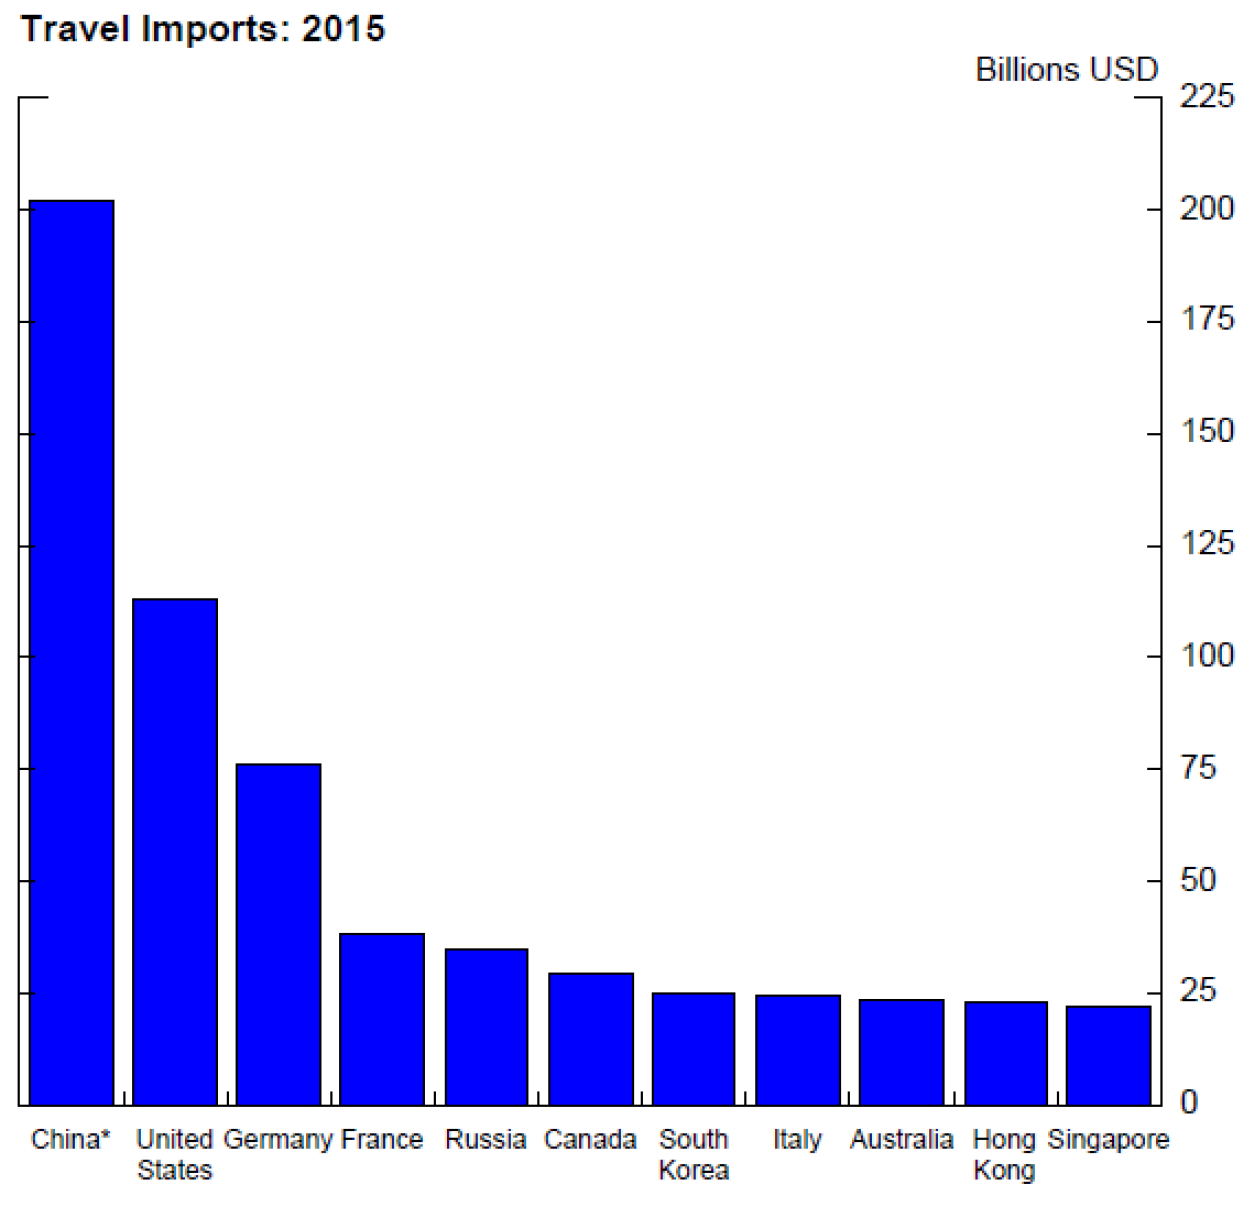
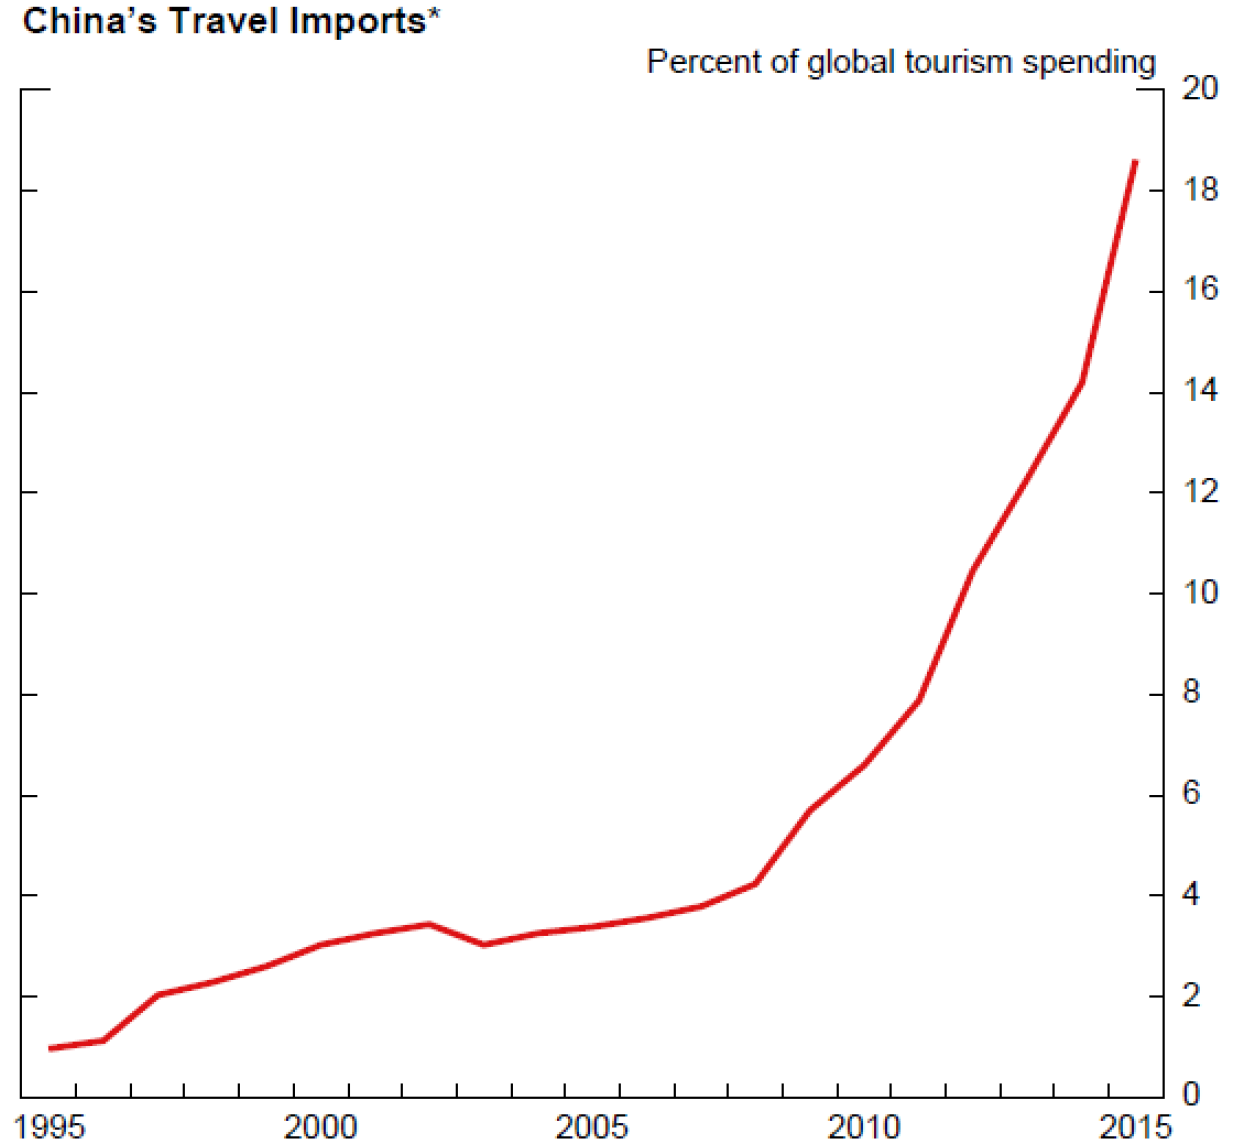
On the services side, particularly in Chinese spending on tourism, we see stronger evidence of demand for consumption imports. My colleague, Anna Wong, has quantified the amount of travel imports in China that are disguised-capital outflows. But even adjusting for this distortion, as shown in the second chart of slide 13, China's share of global tourism has increased sharply in recent years to about one-fifth.8 All in all, on the rise of the Chinese consumer as an importer of global goods and services, I would say that this rise is still a work in progress, but there are some grounds to be optimistic.
*Adjusted for disguised capital outflows (Wong, 2017)
Source: UN World Tourism Organization, FRB Staff Estimate
*Adjusted for underreporting before 2013 and disguised capital outflows since 2013 (Wong, 2017)
Source: UN World Tourism Organization, FRB Staff Estimate
I also examine how China's economic growth directly affects other countries in a vector autoregression (VAR) model. To this end, the top of your next slide shows the effects of an exogenous 3 percent shock to Chinese real GDP using a global VAR (or GVAR) model, developed by my colleagues at the Federal Reserve Board, consisting of 26 country or region blocks (slide 14). In this work, each block of the GVAR consists of domestic variables as well as aggregates of foreign variables.9 According to the GVAR model, a shock of this size would raise the real GDP of other EMEs by about one-third of what the shock does to Chinese GDP itself.
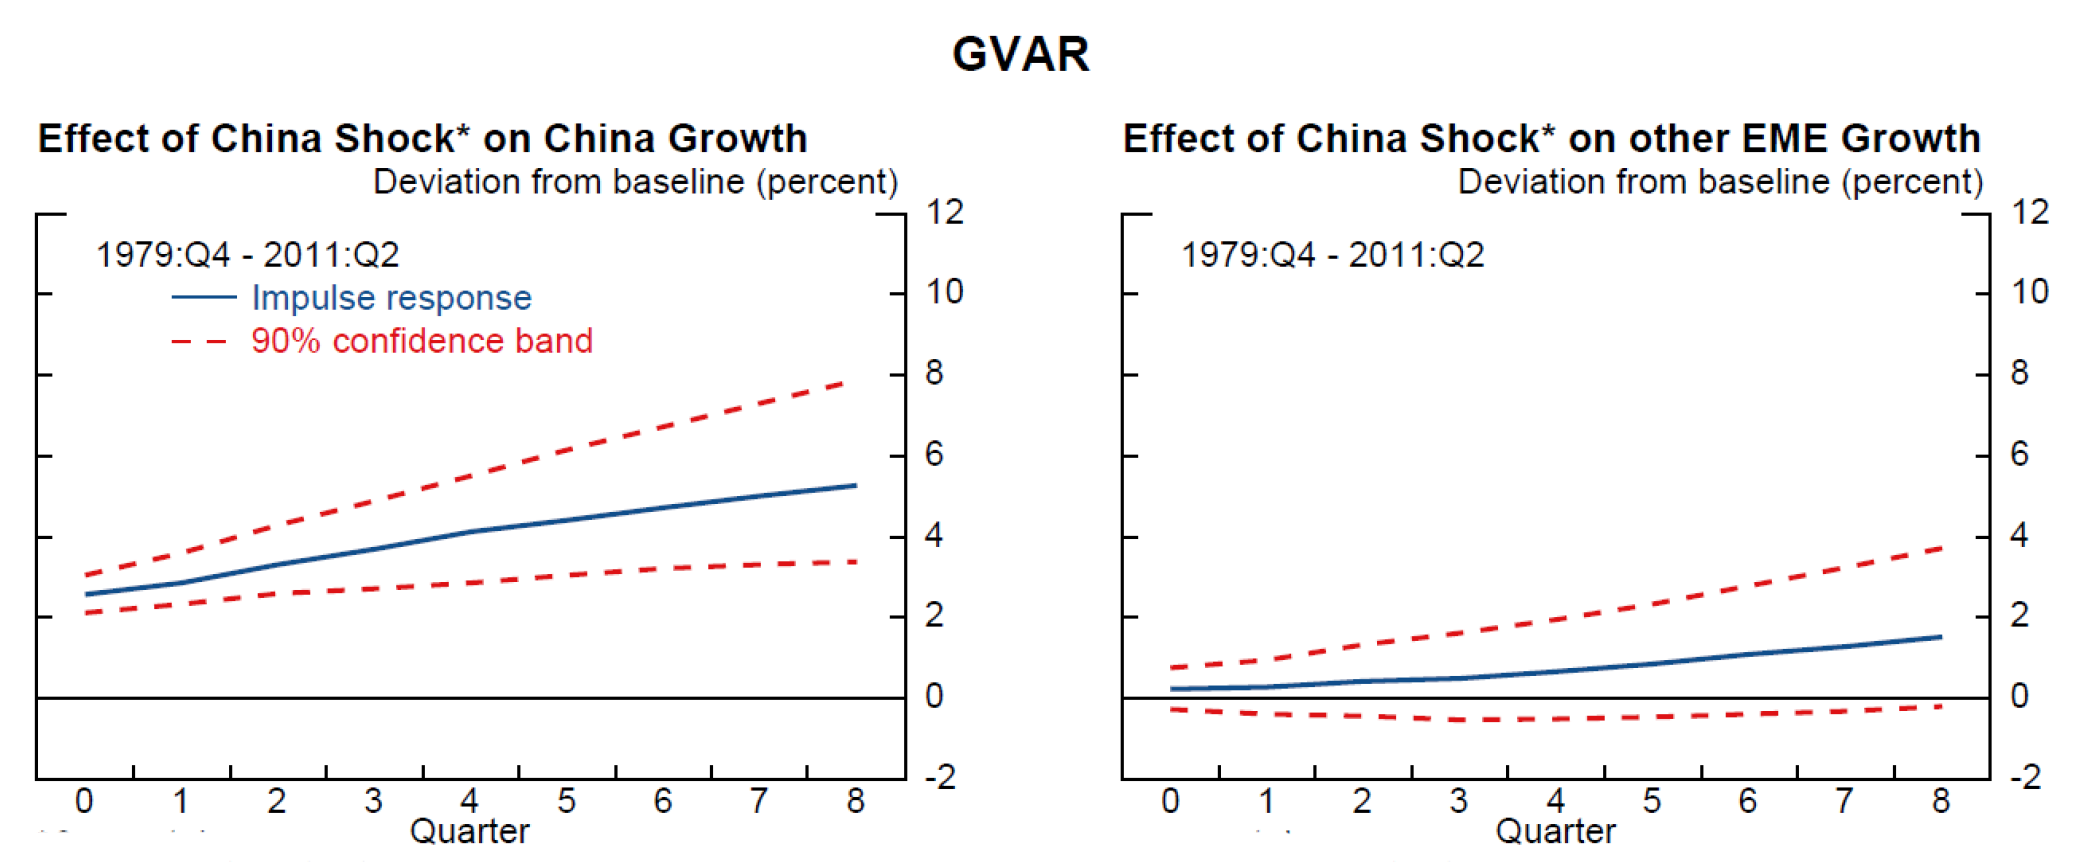
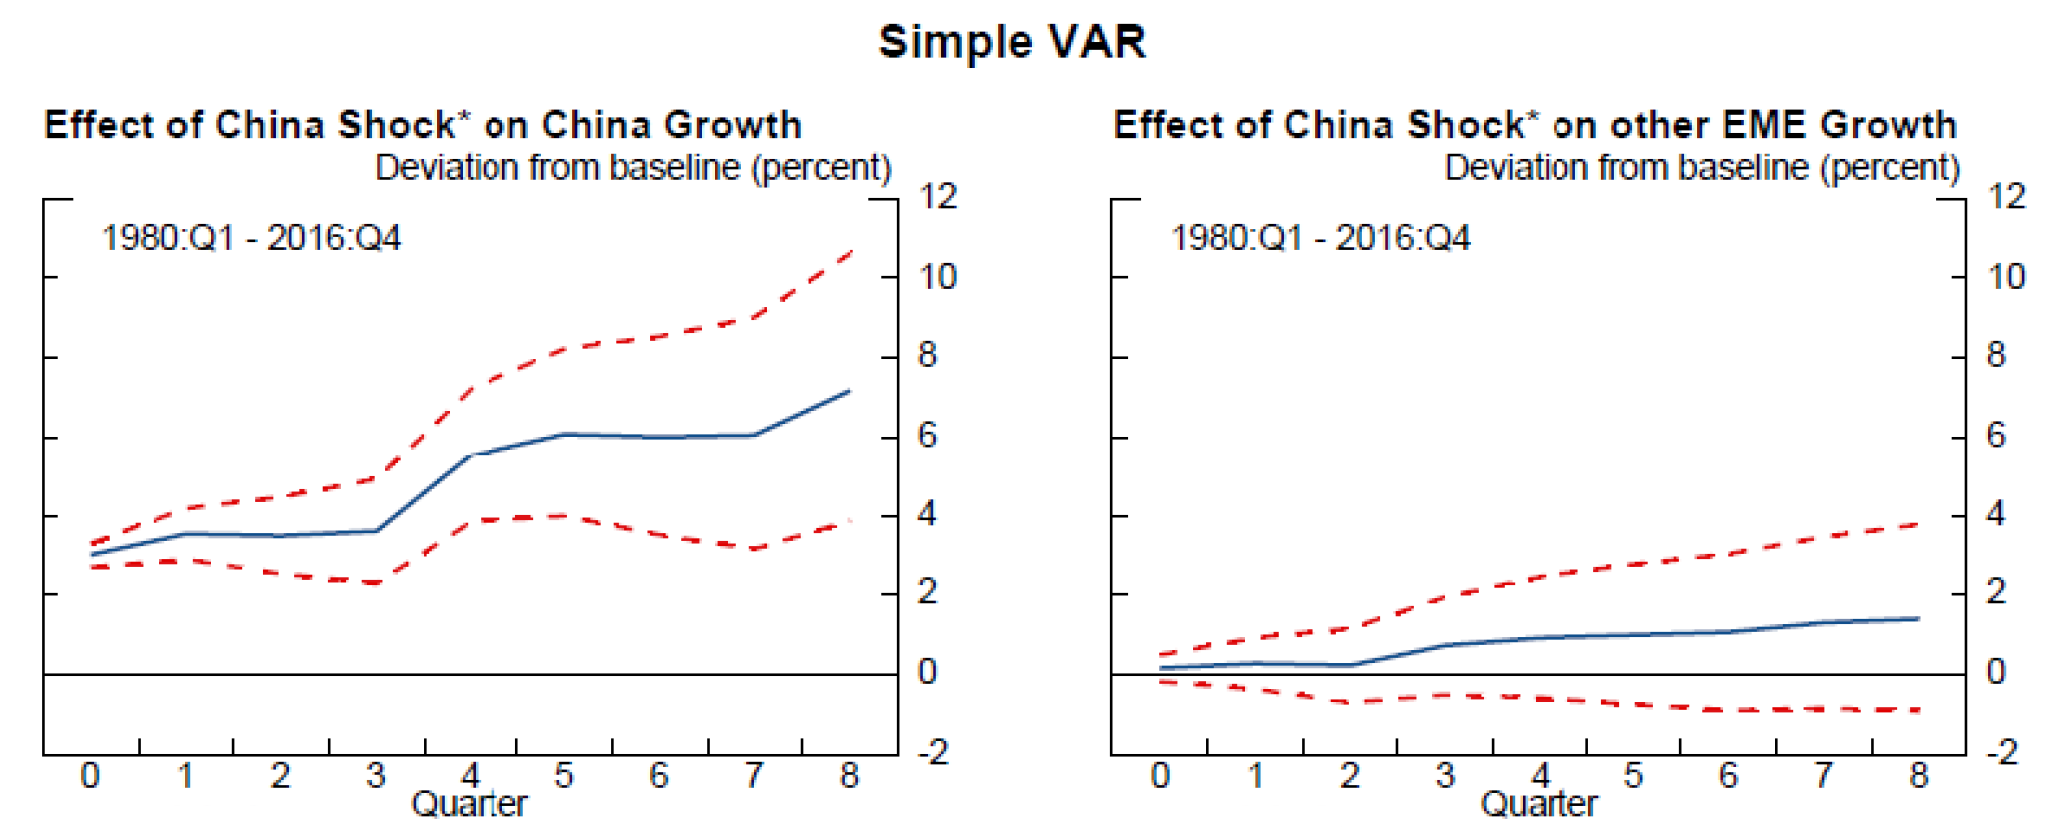
It would be useful to know how these effects have changed in recent years. For example, even though Chinese growth has moderated from earlier years, because Chinese GDP is a larger share of the world economy, its growth may still be contributing as much to global growth. To examine the effects over time, I estimated a simpler three-variable VAR using a recursive contemporaneous causal ordering going from advanced-economy growth to Chinese growth to growth in EMEs excluding China. The full-sample results for comparison with the GVAR estimates are presented in the bottom panels. Note that the effects on the other EMEs of a China shock are broadly similar to the GVAR model.
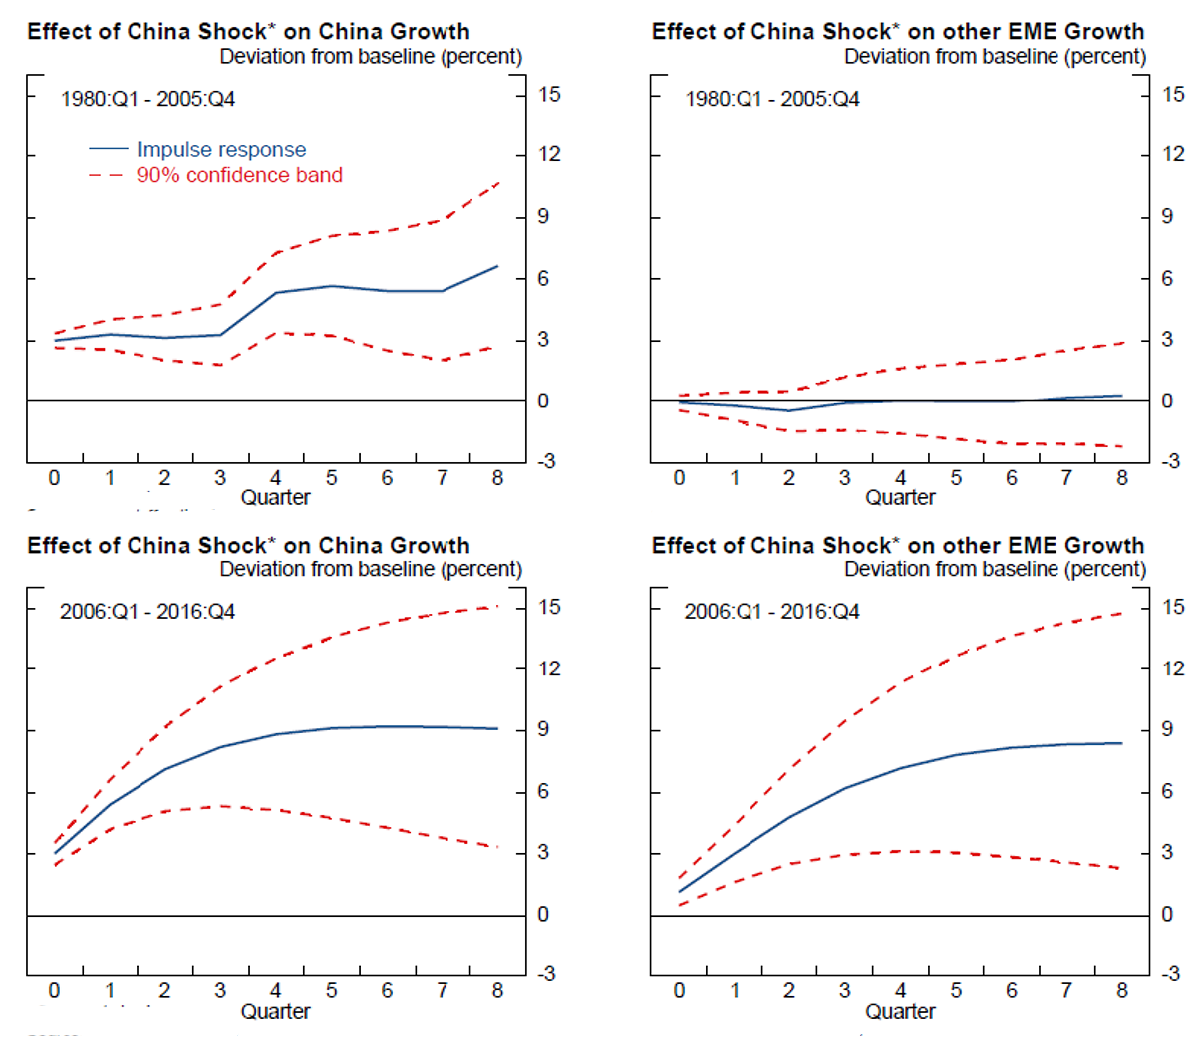
The next slide shows the recent versus earlier effects on EME growth from the simple VAR (slide 15). Over the period from 1981 to 2005, shown in the top panel, an exogenous 3 percent shock to Chinese real GDP has very little effect on other EMEs. It is important to note that this exogenous shock is meant to capture the independent direct effect of China's growth on other EMEs, keeping fixed the indirect effects of advanced-economy demand. For the period since 2006, shown in the bottom panel, the results are vastly different, with a Chinese GDP shock affecting other EMEs close to one-to-one. Although the exact magnitudes obtained from this very simple model should certainly be taken with a grain of salt, the results are suggestive of a large increase in direct spillovers from China to other EMEs in recent years.
The world's financial markets also seem more sensitive to Chinese developments now. Hardly a day goes by when some analyst somewhere does not cite a development or two in the Chinese economy as affecting some global financial market. In particular, China's surprise exchange rate devaluation and "fixing" reforms in August 2015 seemed to trigger bouts of financial volatility in world markets, including many equity markets around the globe and Asian foreign exchange markets. We must also recognize these increased correlations in the analysis of the effects of China on the global economy.
China at a Crossroads: Medium-Term Risks and Longer-Term Challenges
So, where do we stand? Let's quickly take stock. China's economic rise has been meteoric and, in many ways, has lifted other countries and improved global economic welfare. But growth has slowed significantly in recent years, and the nature of Chinese trade has also changed. While the export-led growth model served China well for many years, it also led to serious imbalances that have now created significant risks. I will now briefly discuss these imbalances and risks.
The first imbalance I would like to highlight is overinvestment and excess capacity in certain sectors. In the aftermath of the GFC, a massive stimulus package led to a surge in investment, notably in infrastructure and manufacturing (slide 16). This surge contributed to a subsequent property boom and resulted in excess capacity problems in segments of real estate markets and certain manufacturing sectors, such as steel.
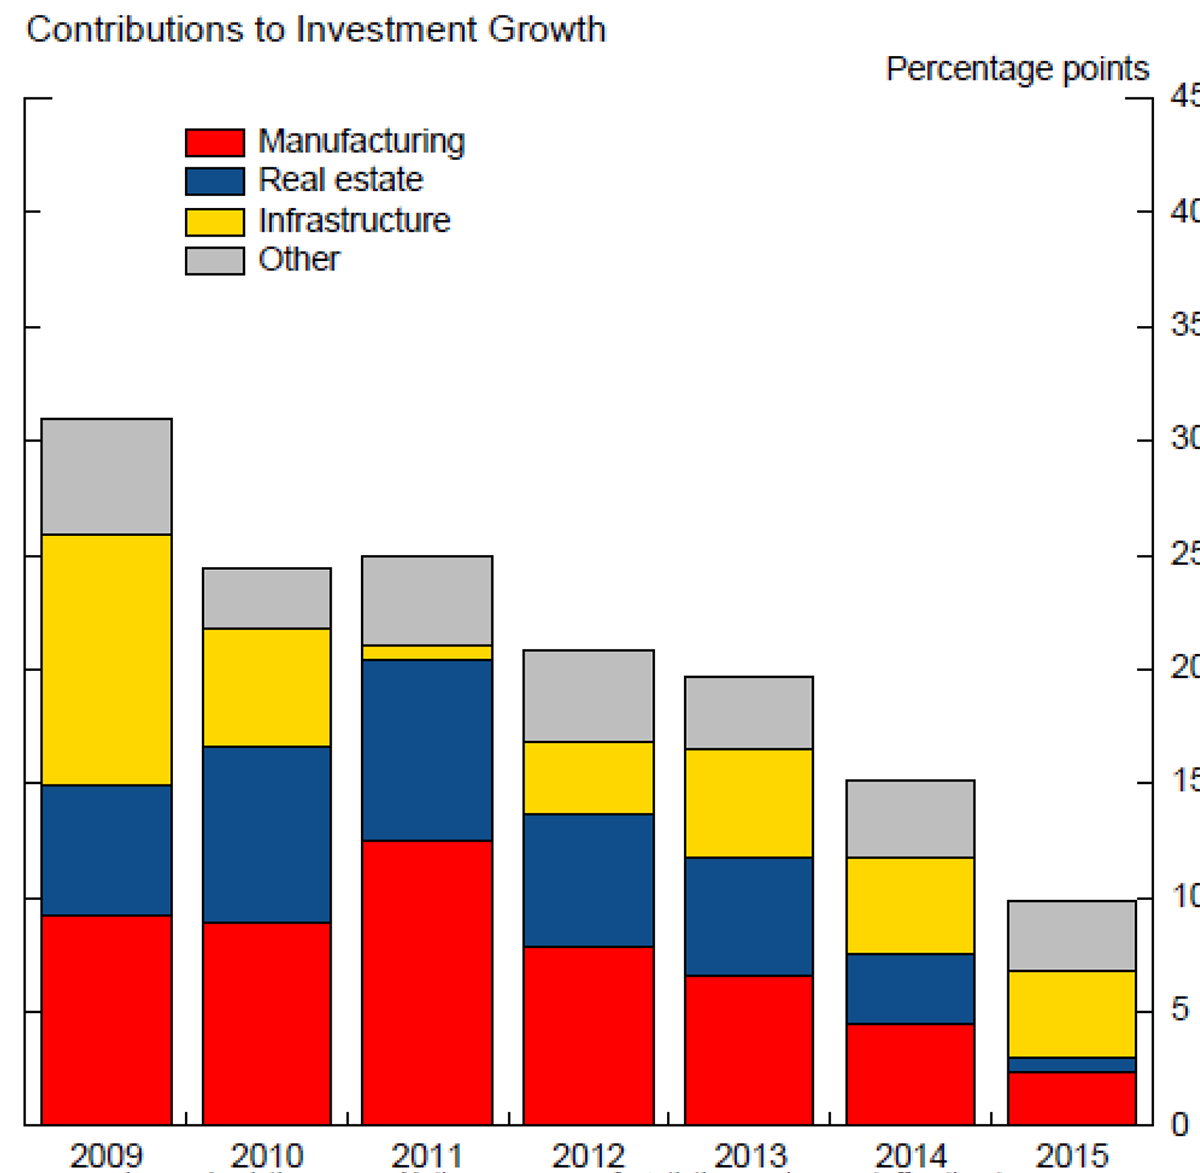
Source: Haver Analytics, China National Bureau of Statistics, and FRB staff estimates
Key identifies bar segments from bottom to top for each period.
The investment was largely financed by a massive credit boom, which created imbalances and vulnerabilities in the financial sector (slide 17). Total credit as a percentage of GDP (the black line) climbed sharply from about 120 percent before the GFC to nearly 230 percent last year. It is especially concerning that this credit boom has been fueled increasingly by nontraditional lending (or "shadow banking"), the majority of which is still intermediated by banks but mostly through off-balance-sheet activities to avoid regulatory restrictions.10
Slide 17: China at a Crossroads: Risks, Massive credit boom, fueled increasingly by nontraditional credit
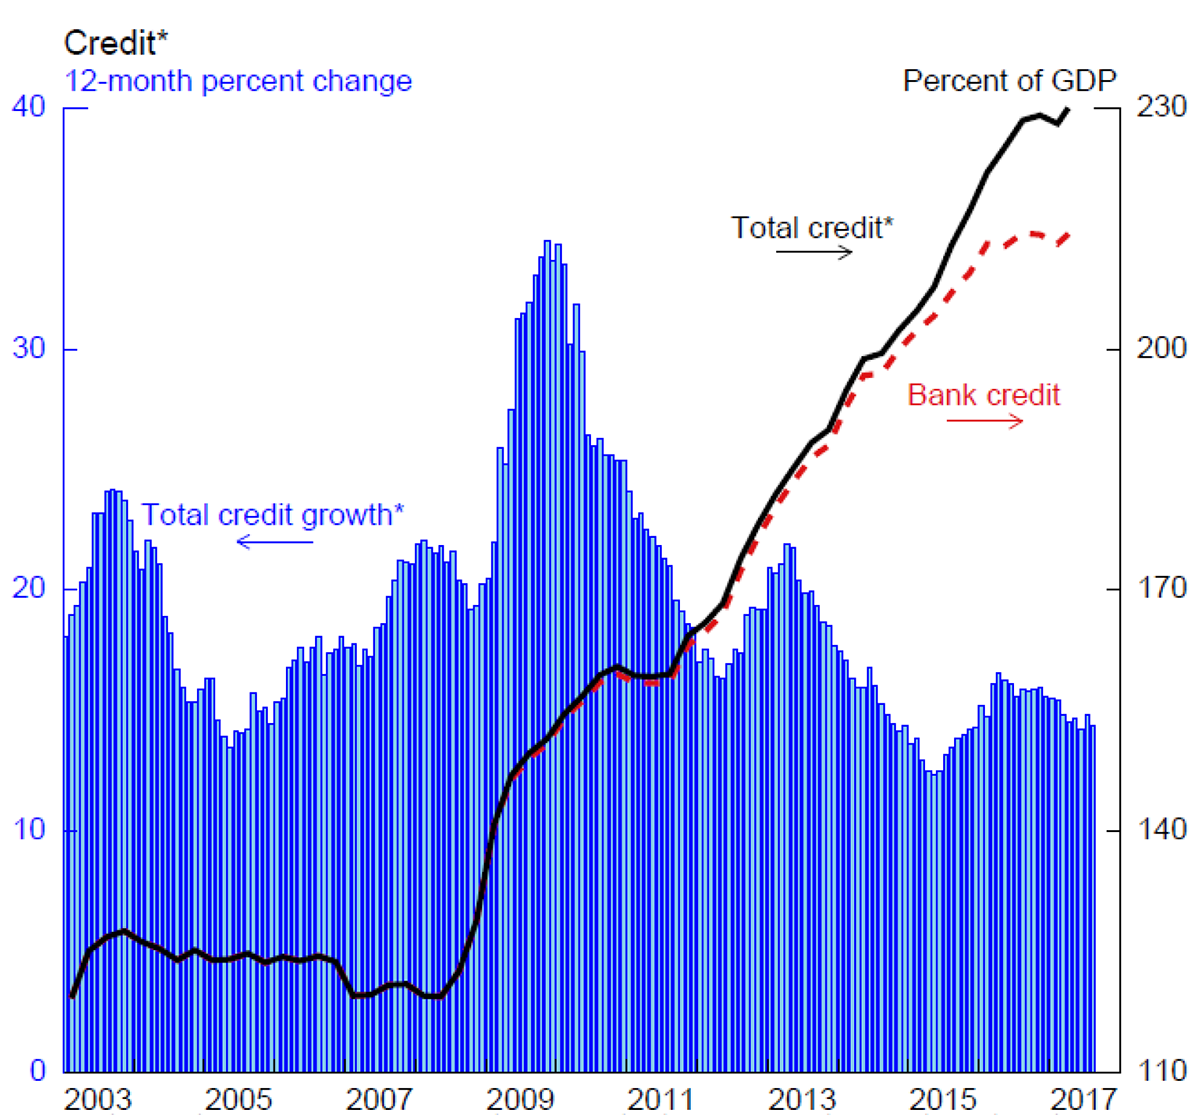
*Total credit includes off-balance-sheet financing, trust loans, and net corporate debt/equity issuance
Source: Haver Analytics, FRB staff estimates
These developments leave banks highly exposed to the vulnerable property and nonfinancial corporate sectors, with concerns about asset quality and moral hazard. While financial-sector vulnerabilities are acute, several features of China mitigate the risks of a financial crisis. First, China's credit boom has been funded largely by domestic savings. Second, a less market-oriented financial system, while the source of many inefficiencies and distortions, also lessens the risk of a drying up of credit, as authorities can simply compel financial institutions to lend. Third, even as economic growth has slowed by Chinese historical standards, it is still quite robust. Finally, Chinese authorities have substantial resources to rescue troubled debtors and bail out banks, if necessary.
On top of the medium-term risks I just highlighted, China is also facing the longer-term challenge of a downward trend in its potential economic growth. To some extent, this slowing is a natural result of the process of "convergence." Economies tend to slow as they develop, and a slowing on that count should be viewed as a measure of success rather than of failure. For example, in both Japan and South Korea, as the level of per capita income increased over the decades, real GDP growth slowed. Both economies were nonetheless able to sustain significant increases in per capita income (slide 18).11
Slide 18: China at a Crossroads: Challenges
Slowing potential growth but partly a result of catching up
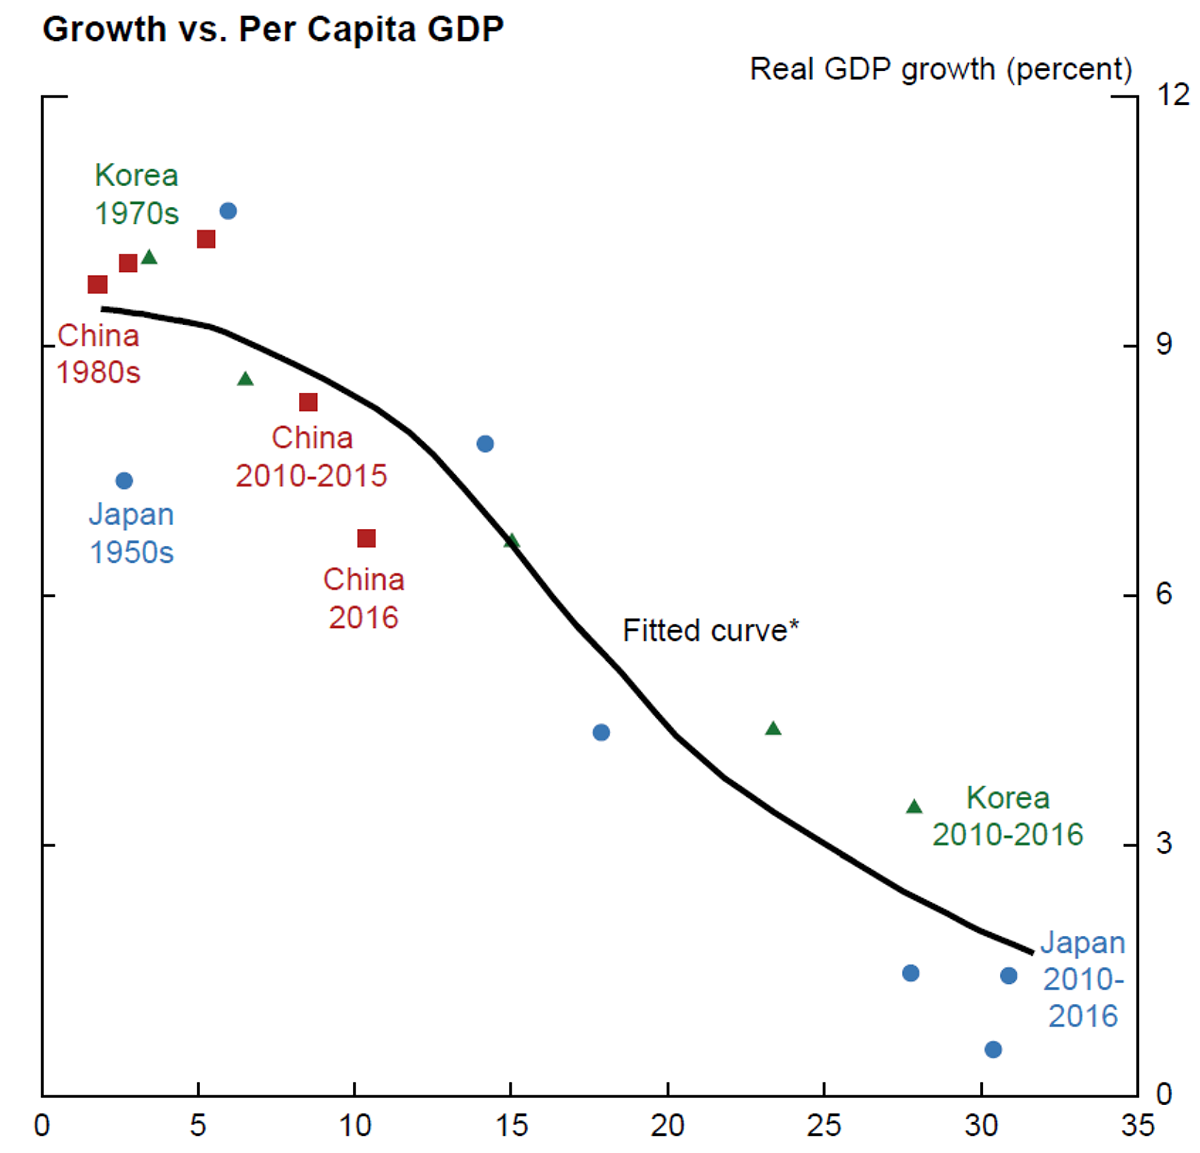
Curve fitted using annual data for the three countries.
Source: Haver Analytics, Penn World Tables, and FRB Staff Estimates
But there are also other reasons for the slowing of trend growth in China. In particular, as can be seen on slide 20, China faces headwinds from demographic changes, with its working-age population (the yellow bars) having peaked and with rapid growth of its elderly population projected (the green bars). As such, the dependency ratio is expected to rise steeply. This source of slowing growth has the potential to threaten social welfare.
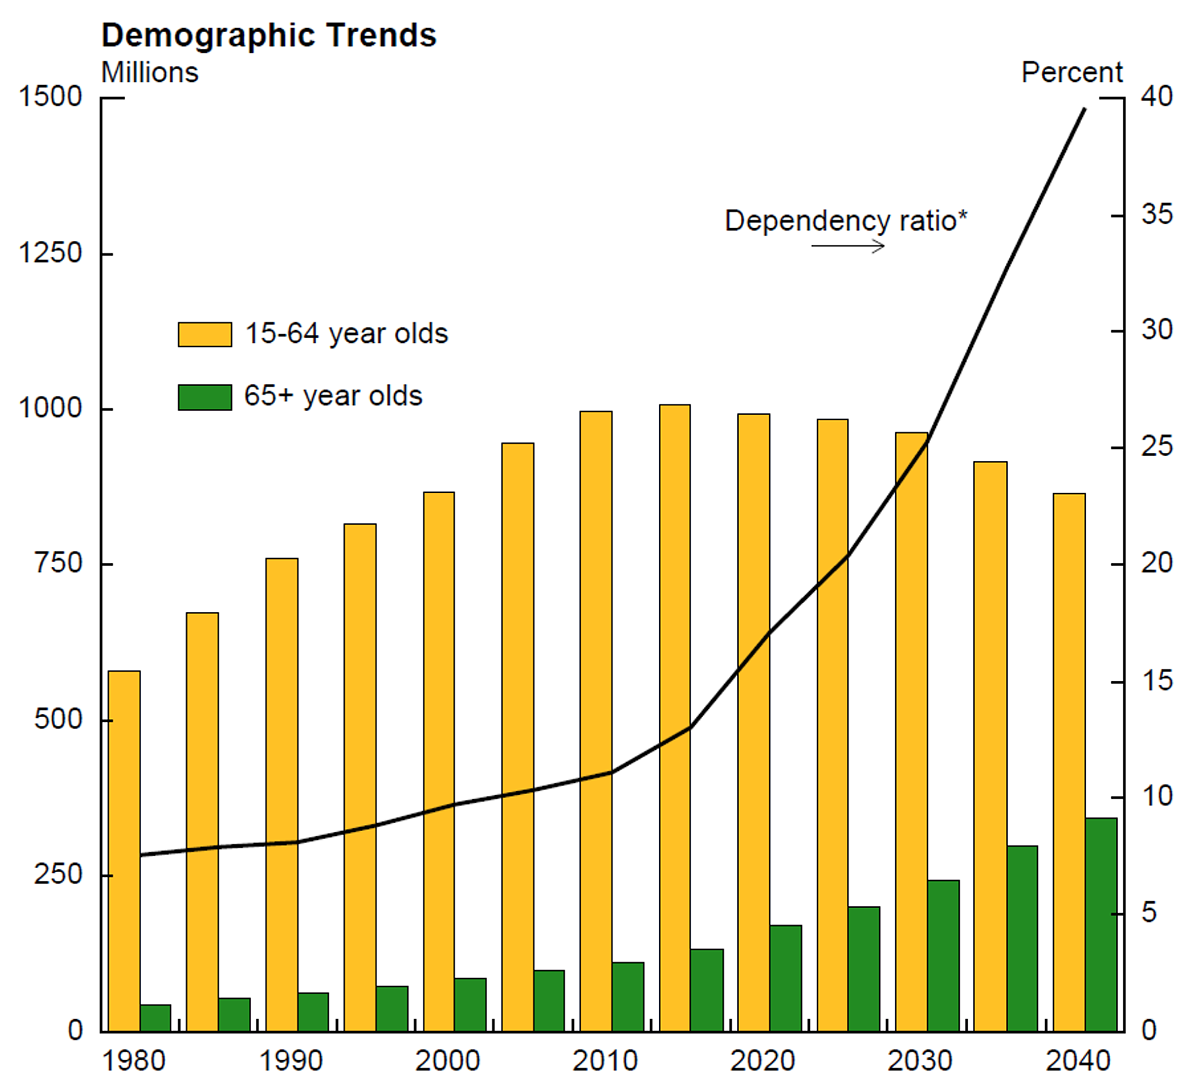
*65+ as share of adult population
Key identifies bars from left to right within each period.
Source: UN World Population Prospects
China's mitigating factors I mentioned earlier decrease the likelihood of a financial crisis. But these factors, by themselves, do not address the inherent vulnerabilities and imbalances in its economy. Even with these mitigants, there is some possibility that certain types of shocks could snowball into something much bigger. Some of the more severe shocks or trigger events that could lead to a crisis situation include a property-sector bust, a run on some shadow banking products, and a particularly large and disruptive depreciation of the renminbi. While the probability of a crisis situation, especially in the near term, is quite low, and I do not view this outcome as the most likely, it remains a significant risk.
A Sharp Chinese Economic Slowdown: Potential Effects on the Global Economy
If Chinese growth did slow abruptly, possibly accompanied by a financial crisis, what would the effect be on the rest of the world?
My colleagues and I use the Federal Reserve Board staff's global model, SIGMA, to quantify the effects of an adverse China shock. SIGMA is an open economy, general equilibrium model (slide 20). Monetary policy typically follows a Taylor rule, subject to a zero-lower-bound (ZLB) constraint. The model consists of three blocks, calibrated to the U.S. economy, the advanced foreign economies (or AFEs), and the EMEs.

To quantify the effects of a China slowdown through this model, we need to know its effect on other EMEs. This is where our VAR results come in. Recall in those results that over the full sample, a shock to Chinese GDP seemed to affect other EMEs on the order of one-third of the Chinese response. But there was also evidence that the response of other EMEs has gone up in recent years. In light of that, we consider "standard" spillovers from China to other EMEs, mainly through trade channels, to be half the China response.
Different scenarios in SIGMA can be generated through shocks to exchange rate risk premiums, confidence, corporate spreads, and interest rates. We consider three scenarios (slide 21): a moderate China slowdown with standard trade spillovers, a China crisis also with standard trade spillovers, and a China crisis with extra financial spillovers to the rest of the world. In this last scenario, financial turbulence in China is assumed to spread to other countries' financial markets and make the GDP hit to other EMEs one-to-one, rather than half.

It is not obvious exactly how much Chinese growth would decline in a crisis. We assume a crisis situation to be one in which annualized growth falls 4 to 5 percentage points below trend growth and this decline is sustained for some time. This translates roughly into the level of real GDP about 7 percent below baseline over a period of a year and a half (the blue and red lines in panel A of slide 22) before gradually returning to the baseline. We judge a moderate China economic slowdown to be about half of this decline (the green line).
Slide 22: China Slowdown: Global Effects
China crisis would hit EMEs and AFEs hard; significant U.S. effect too
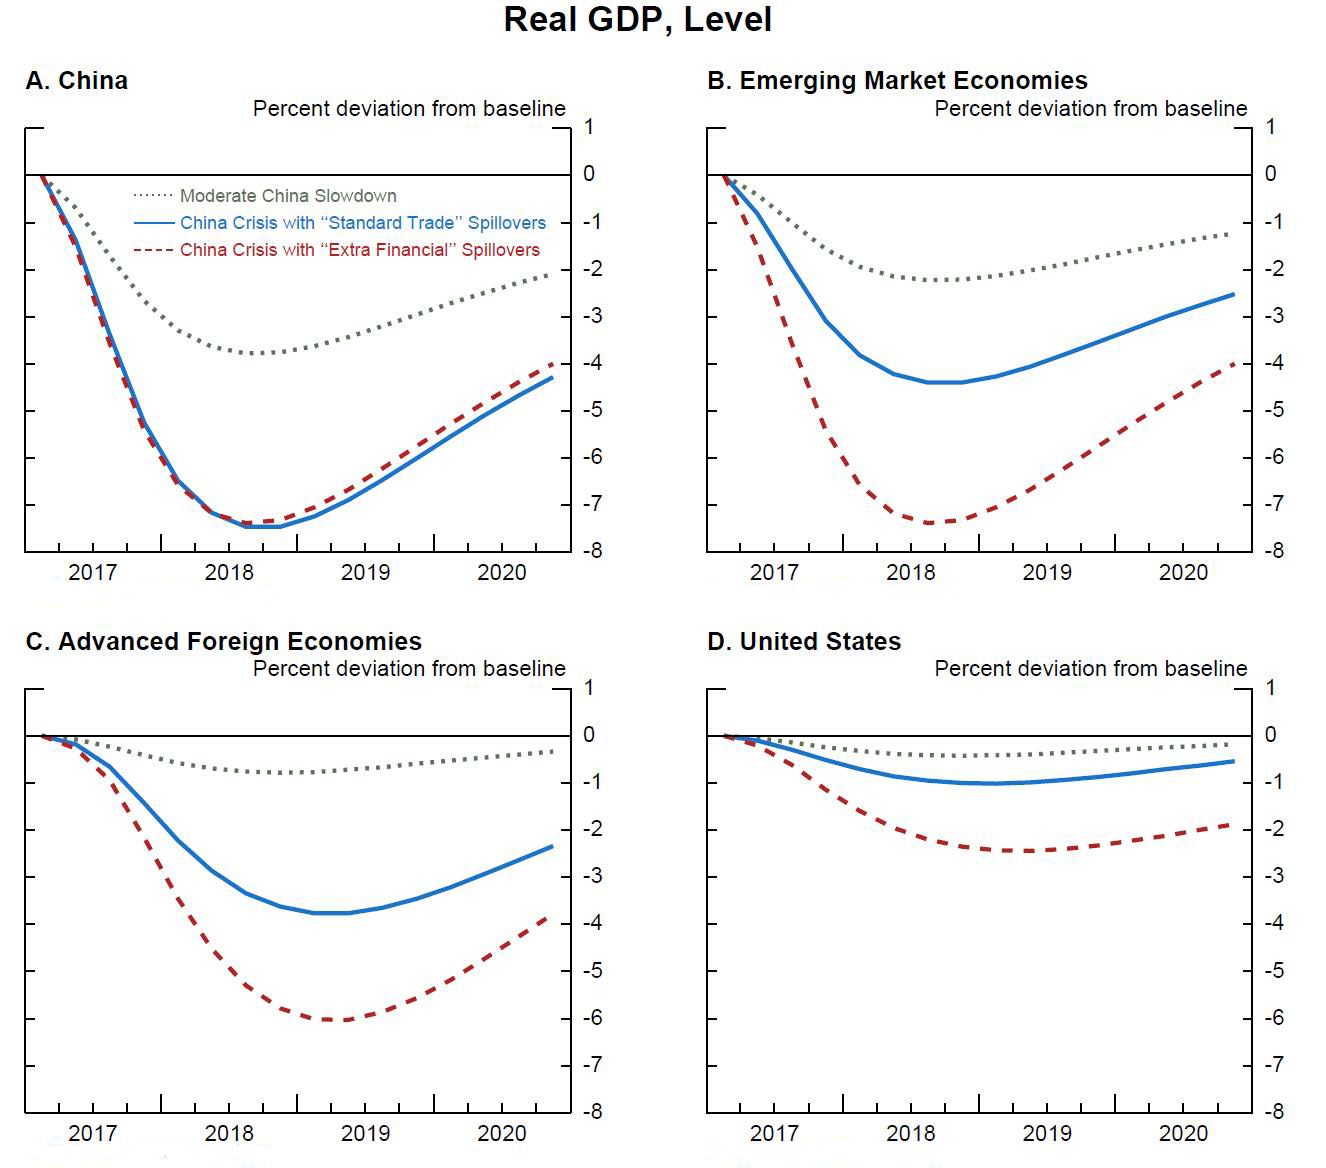
Source: FRB Staff Calculations
Now consider the broader effects, shown in panels B through D. First, note from the green lines that a moderate slowdown in China, while adversely affecting aggregate EME real GDP to a significant extent, would not appear to be too problematic for the AFEs and the United States. But if China went into a crisis, which admittedly is a tail risk, the effects around the globe would be substantial even with just the standard trade spillovers (the blue lines). With other EMEs hit hard, aggregate EME would drop 4 percent below the baseline, roughly equivalent to what transpired in the Mexican 1994–95 crisis. Note that the AFEs, with policy space constrained, would also suffer a sizable real GDP drop of 3 percent. The United States appears relatively insulated, but U.S. GDP still falls a significant 1 percent.
Things could even be worse if financial turmoil in China causes reverberations in other financial markets around the world. As can be seen by the red lines, aggregate EME GDP would drop 7 percent (about equivalent to the 1997–98 Asian crisis); AFE GDP would drop about 6 percent; and U.S. GDP would drop 2 percent. This third scenario is likely in the extreme tail of the probability distribution, but it should not be completely discounted, given the increased correlation between news from China and world financial markets.
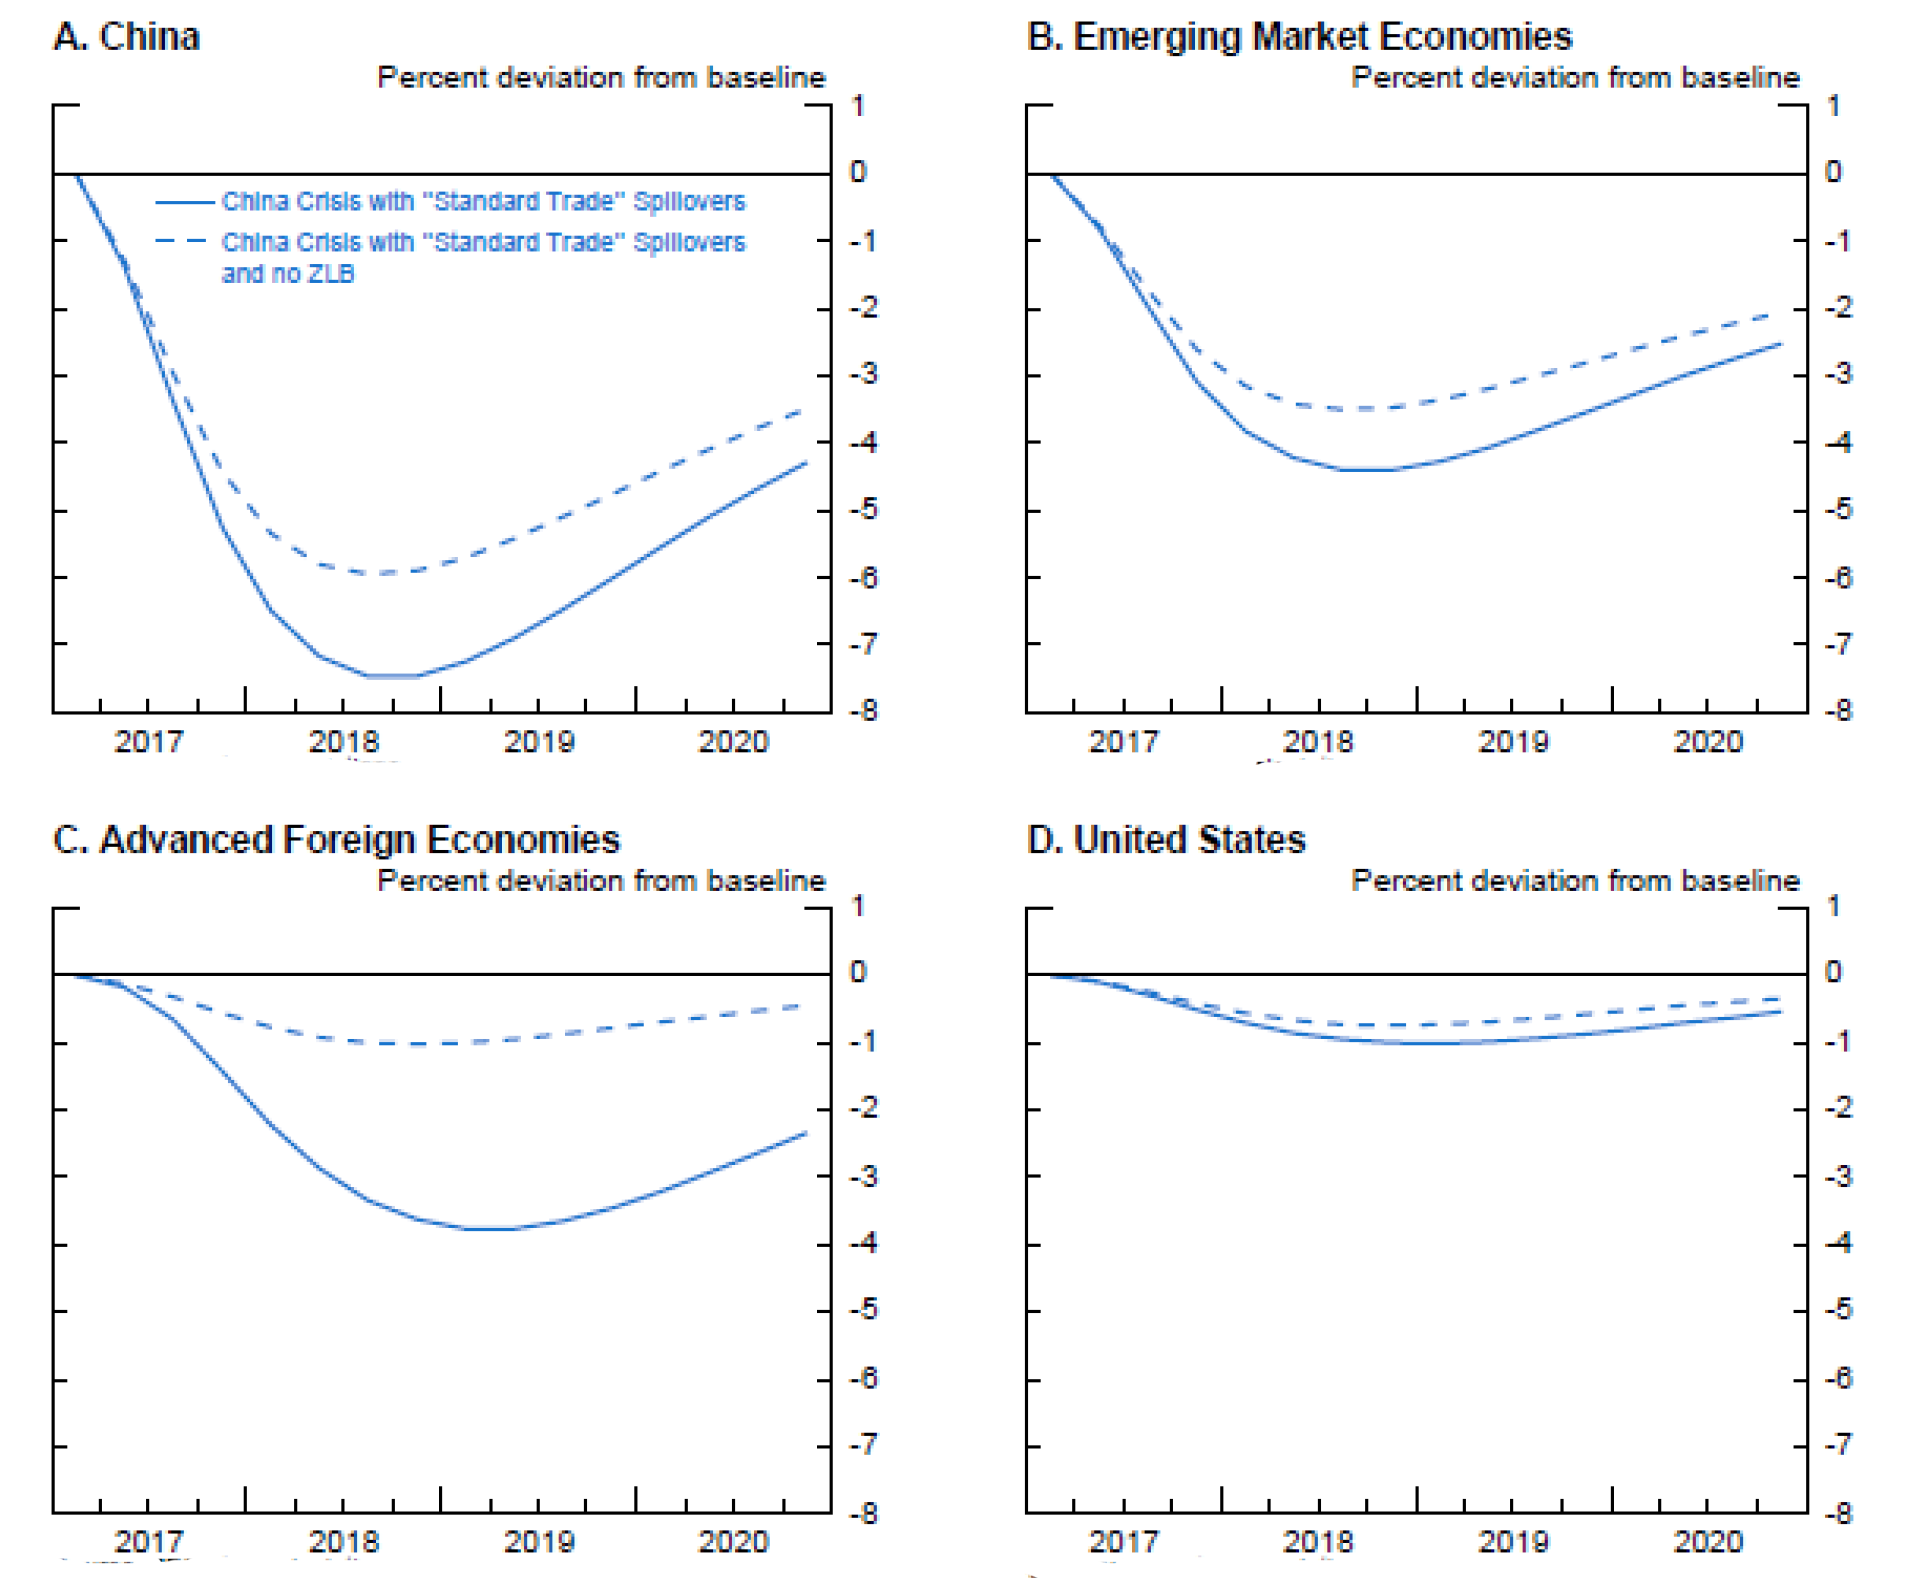
According to these results, the spillovers to advanced economies as a whole for a China crisis would be bigger than those observed in previous EME crises. One obvious reason for the bigger response is a higher share of China and other EMEs now in global GDP and trade. But another less obvious, but important, reason (depicted in slide 23) is the limited scope for monetary policy to respond appropriately to negative shocks in many advanced economies. In the model, this limited scope is captured as a strict zero-lower-bound constraint on the policy rate. If the ZLB was not binding in the model, the adverse effect of a China slowdown on the AFEs (the dashed line in panel C) would be much smaller. In practice, we do see negative policy rates in some AFEs, and the larger effect on AFEs due to policy limits shown in the slide is perhaps overstated. But I would argue that it is probably overstated only a bit, as it is generally believed that the scope for additional monetary stimulus in many AFEs at this time is fairly limited.12
Slide 23: China Slowdown: Global Effects
AFE effects bigger now—more limited scope for monetary policy
Source: FRB Staff Calculations
China's Path to Reducing Financial Vulnerabilities
All in all, the risk of a financial crisis in China is relatively low but significant, and such an outcome would be quite consequential for the global economy. Therefore, it is in everyone's interest to try and prevent a sharp slowdown in China that could trigger such a crisis. But it is also imperative that the key sources of financial stability risks are addressed over the medium term so as not to risk a bigger crisis down the road. So what can China do to address its vulnerabilities?13
Policies should focus on further reducing structural imbalances in the economy—shifting GDP from investment to consumption and growth becoming more domestically driven and less export-led. I will just mention some selected specific policy areas that could help further these objectives—these are by no means exhaustive, and some of these areas (and others as well) have already been highlighted in the papers presented (slide 24).

First, policies to reduce the economy's high savings rate need to be accelerated. Increased government spending on health and social security would reduce the need for precautionary household savings. Moreover, increasing dividend payouts by state-owned enterprises (SOEs) and using them to finance social security expenditures would help reduce business savings. Absent such reforms, China's high savings will lead to either credit or investment bubbles or to larger capital surpluses that have to be somehow absorbed by the rest of the world.
Second, fiscal policies need to become less oriented toward stimulating investment. The excessive investment orientation of Chinese stabilization policies is partly the result of China's reliance on the banking system to provide stimulus. Accelerating the liberalization of the financial sector would be helpful.
Third, more can be done to reinvigorate the private sector as an engine of growth. In particular, it is crucial that authorities hasten the pace and broaden the scope of SOE reforms, not just by merging SOEs but by clearing the way for non-viable firms, particularly in excess-capacity sectors, to shut down. Such reforms would enable the gradual removal of implicit public guarantees and subsidies as well as application of appropriate bankruptcy procedures. SOEs are also held back by poor governance, which needs reform.
Finally, Chinese authorities should continue to take steps to further increase the flexibility of the exchange rate over time, thereby benefiting more fully from its role as an equilibrating mechanism.
In closing, since my time is about up, let me just say the following: We have all heard some variant of the saying "When the United States sneezes, the rest of the world catches a cold." Well, the analysis I presented suggests that in the case of China, it will still take more than just a sneeze to send the rest of the world rushing to the medicine cabinet. But it would be in China's own interest and that of the global economy to take more forceful preventive measures to avoid catching pneumonia.
Thank you; I would be happy to take a few questions.
References
Brambilla, Irene, Amit Khandelwal, and Peter Schott (2017). "China's Experience Under the Multifiber Arrangement (MFA) and the Agreement on Textiles and Clothing," NBER Working Paper No. 13346, August, http://www.nber.org/papers/w13346
Eichengreen, Barry, Donghyun Park, and Kwanho Shin (2012). "When Fast-Growing Economies Slow Down: International Evidence and Implications for China," Asian Economic Papers, 11:1, Winter/Spring, pp.42-87.
Ericsson, Neil, Lucas F. Husted, and J.E. Seymour (2014). "Potential Spillovers from a Sudden Sizable Slowdown in Chinese Growth (Washington: Board of Governors of the Federal Reserve System, June, manuscript)
Hanson, Gordon H. (2010). "Why Isn't Mexico Rich?" Journal of Economic Literature, 48:4, pp. 987-1004.
Lewis, Logan and Ryan Monarch (2016). "Causes of the Global Trade Slowdown," IFDP Notes (Washington: Board of Governors of the Federal Reserve System, November), https://www.federalreserve.gov/econresdata/notes/ifdp-notes/2016/files/causes-of-the-global-trade-slowdown-20161110.pdf
OECD, (2017). "OECD Economic Surveys: China 2017," (Paris: OECD Publishing, March), http://www.oecd-ilibrary.org/economics/oecd-economic-surveys-china_20725027
Powell, Jerome H. (2016). "The Global Trade Slowdown and Its Implications for Emerging Asia," Remarks delivered at the Federal Reserve Bank of San Francisco 2016 Pacific Basin Research Conference (Washington: Board of Governors of the Federal Reserve System, November), https://www.federalreserve.gov/newsevents/speech/powell20161118a.htm
Wong, Anna (2017). "China's Current Account: External Rebalancing or Capital Flight?" IFDP, No. 1208 (Washington: Board of Governors of the Federal Reserve System, November), https://www.federalreserve.gov/econres/ifdp/files/ifdp1208.pdf
1. The author is Associate Director of the International Finance Division, Board of Governors of the Federal Reserve System, Washington DC 20551 U.S.A. He can be reached at [email protected]. This note reproduces remarks that were delivered by the author at the Second International Monetary Fund and Federal Reserve Bank of Atlanta Research Workshop on the Chinese Economy in Atlanta, GA, on May 19, 2017. The author would like to thank for their assistance and input Mandy Bowers, Daniel Dias, Neil Ericsson, Jasper Hoek, Jessica Liu, Michael Navarrete, Albert Queralto, Andrea Raffo, Bekah Richards, Ellen Wiencek, Anna Wong, and, especially, Zach Sauers. The views expressed are solely the responsibility of the author and should not be interpreted as reflecting the views of the Board of Governors of the Federal Reserve System or of any other person associated with the Federal Reserve System. Return to text
2. For example, Brambilla, Kandelwal, and Schott (2007) discuss how China's takeoff in apparel and textile exports after the MFA and its successor, the Agreement on Textiles and Clothing, adversely affected the exports of other countries in these goods. Return to text
3. See, for example, the section on the "perils of competing with China" in Hanson (2010). Mexico over time seems to have been able to restructure its exports to cope fairly well with competition from China. Return to text
4. See Lewis and Monarch (2016) and Powell (2016) for an analysis of the recent fall in global trade and China's role in that decline. Return to text
5. The division into "processing" and "non-processing" exports is based on categories in Chinese customs data. It is not a perfect delineation—while "processing" exports do have a relatively high content of imported inputs, "non-processing" exports do not have zero import content, just much less. Return to text
6. This point is also emphasized in Powell (2016). Return to text
7."Processing" imports are those that will mostly be used to produce goods for export and that carry some tax advantages. The remainder, "non-processing" imports, are largely those that will not be used as inputs in producing export goods. But, again, in the data the distinction is not perfect, and some of the so-called non-processing imports may be used in producing export goods. Return to text
8. See Wong (2017). Return to text
9. See Ericsson, Husted, and Seymour (2014). The domestic variables are real GDP, consumer price index inflation, real equity prices, the real exchange rate, and short- and long-term nominal interest rates. The foreign variables include the international oil price and weighted aggregates of each previous variable minus the domestic country's corresponding variable. Return to text
10. Although shadow banking has now become an area of concern, it has played some positive roles as well—for example, in the provision of credit to small-and-medium enterprises and alternative investments for diversification-constrained retail investors. Return to text
11. According to the fitted relationship (the curve in black in slide 19), there appears to be a sharp deceleration of an economy around a per capita level of $15,000, a figure that China is nearing. This result is broader than just based on the Korean and Japanese experiences; see, for example, Eichengreen, Park, and Shin (2012). Return to text
12. The model also does not take into account that policymakers can react with unconventional monetary policies as well, but these policies have some limits too. Return to text
13. One interesting report discussing China's policy options is OECD (2017). Return to text
Ahmed, Shaghil (2017). "China's Footprints on the Global Economy: Remarks delivered at the Second IMF and Federal Reserve Bank of Atlanta Research Workshop on the Chinese Economy," IFDP Notes. Washington: Board of Governors of the Federal Reserve System, September 2017, https://doi.org/10.17016/2573-2129.37.
Disclaimer: IFDP Notes are articles in which Board economists offer their own views and present analysis on a range of topics in economics and finance. These articles are shorter and less technically oriented than IFDP Working Papers.