IFDP Notes
June 19, 2018
How vulnerable are EME corporates?
Daniel O. Beltran and Christopher G. Collins1
- Introduction
Nonfinancial corporate debt in emerging market economies (EME) has tripled since the global financial crisis (GFC), reaching a peak of $25 trillion (110 percent of GDP) in 2016:Q1 (Figure 1). The sharp increase in corporate debt has raised concerns about the risks this debt poses to emerging markets and the global economy.
In a previous note, we assessed vulnerabilities in the EME corporate sector using firm-level data from financial statements through 2016:Q3, and found these vulnerabilities to be moderate. At the time, only a few countries exhibited significant levels of risky corporate debt as a share of total debt. However, the amount of risky debt had reached its highest level since the GFC, even without any crises, and appeared quite sensitive to earnings, interest rate, and to a lesser extent, exchange rate shocks.
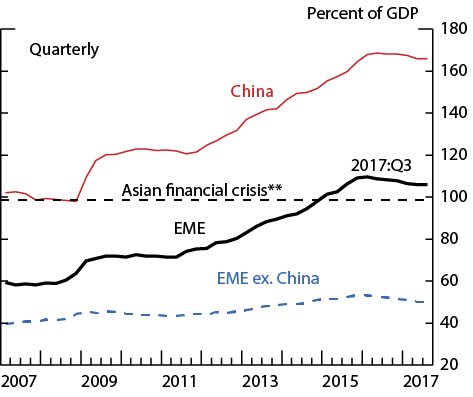
* Emerging market economies (EME) include Argentina, Brazil, Chile, China (including Hong Kong), Hungary, India, Indonesia, Malaysia, Mexico, Poland, Russia, South Africa, South Korea, Thailand, and Turkey.
** Asian financial crisis is GDP-weighted average of Hong Kong, Singapore, South Korea, and Thailand in 1996.
Source: Bank for International Settlements; Federal Reserve Board staff estimates.
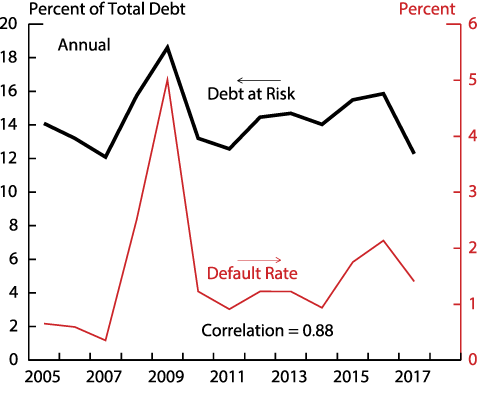
Note: Debt at risk is debt of firms with ratio of earnings before interest, tax, depreciation, and amortization to interest expense less than 2.
Source: Moody's Investors Service, Inc.; Federal Reserve Board staff estimates.
This note provides an update on the health of EME corporates and examines the extent to which they are vulnerable to risks, including those that might be associated with monetary policy normalization in advanced economies. Overall, the health of the EME corporate sector has improved since 2016, as the firming of global growth has boosted EME corporate earnings, which has enhanced their capacity to service debt. Furthermore, levels of EME corporate debt as a share of GDP have stabilized, and an orderly deleveraging process is underway in many economies. Average borrowing costs remain low as most EME central banks are still easing monetary policy, and EME corporate bond spreads are well below their long-run averages. As a result, the amount of debt at risk, as a share of total debt, has moved down near the bottom of its range over the past decade.
At the same time, several advanced economy central banks have been tightening monetary policy, and others are expected to follow suit. Given the likelihood that policy normalization will proceed gradually and predictably, and with solid prospects for global economic growth, policy normalization should prove manageable for EME corporates.2 There is some risk, however, that rising global interest rates could lead to higher debt burdens, weaker currencies, capital outflows, and lower earnings. Such adverse developments could weigh on EME corporates, especially those with dollar-denominated debt, triggering loan losses, bond defaults, and broader financial stress. To assess these concerns, we stress test the EME corporate sector by imposing shocks to firms' borrowing costs, earnings, and the exchange rate.
- Debt at risk
We assess the riskiness of the corporate debt stock by analyzing balance sheet and income statement data from Capital IQ for a sample of roughly 12,000 public and private firms in 15 emerging market economies. We compute the share of risky debt as the debt of firms with interest coverage ratio (ICR)—the ratio of earnings to interest expense— less than 2, divided by the total debt of firms in our sample.3 Our estimated shares of risky debt appear to be closely associated with corporate distress events; global debt at risk is highly correlated with the issuer-weighted global corporate default rate from the rating agency Moody's (Figure 2).
As shown in Figure 3, we estimate that 23 percent of the EME corporate debt stock is at risk. For comparison, we estimate the share of risky debt to be about 8 percent both in the United States and the euro area. This share has declined notably since 2016 for most EMEs in our sample. While somewhat high in some economies, such as Argentina, and having increased significantly in others, such as India, Turkey, and Thailand, the share of risky debt is below the level seen in East Asia on the eve of the Asian financial crisis for all of the economies in our sample.
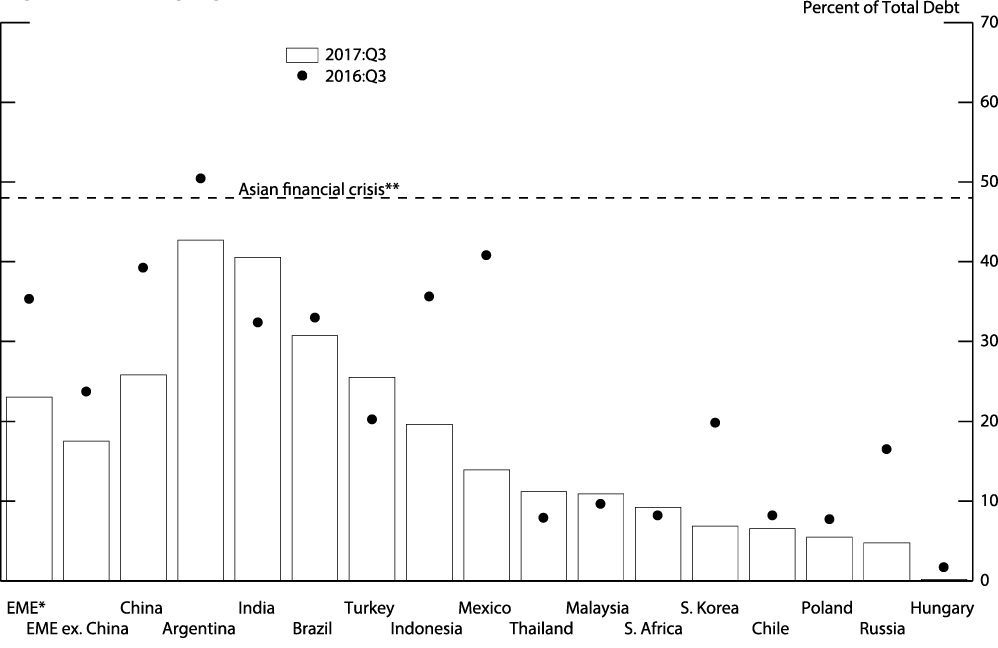
Note: Debt at risk is debt of firms with ratio of earnings before interest, tax, depreciation, and amortization to interest expense less than 2.
* Emerging market economies (EME) include Argentina, Brazil, Chile, China (including Hong Kong), Hungary, India, Indonesia, Malaysia, Mexico, Poland, Russia, South Africa, South Korea, Thailand, and Turkey.
** Asian financial crisis is GDP-weighted average of Hong Kong, Singapore, South Korea, and Thailand in 1996.
Source: Standard & Poor's Global Market Intelligence; Federal Reserve Board staff estimates.
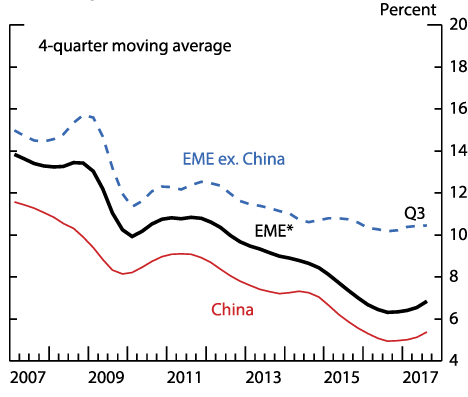
The overall decline in the share of risky debt owes to the increase in ICRs since mid-2016 (Figure 4). Taking a closer look at the drivers of this improvement, we decompose ICR into its components: return on assets, financial leverage, and average borrowing cost.
$$ICR = \frac{Earnings}{Interest Expense} = \frac{Earnings}{Assets}*\frac{Debt}{Interest Expense} = \frac{Return on Assets}{Financial Leverage*Average Borrowing Cost}$$
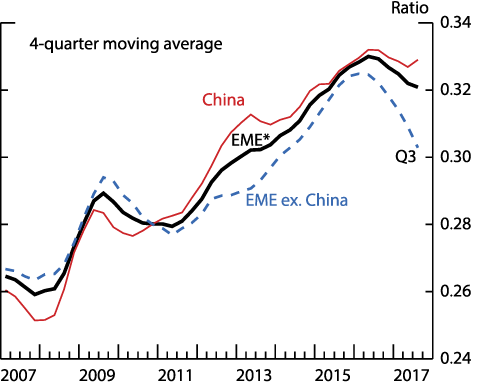
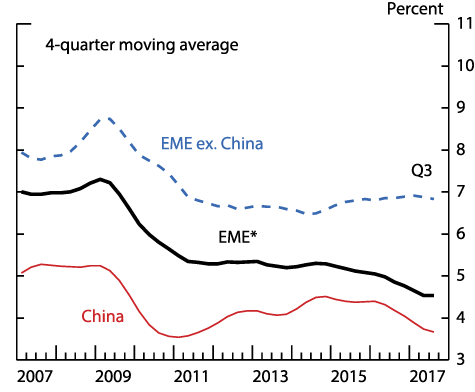
Equation 1 tells us that, all else equal, firms that are more profitable, are less leveraged, or have lower borrowing costs will have higher ICRs, indicating a greater capacity to service debt. The improvement in ICRs (and reduction in the share of risky debt) is mostly attributed to an increase in return on assets, and a decrease in financial leverage (Figures 5 and 6). As shown in Figure 7, average borrowing costs have been trending down in China since 2016, and have been mostly flat for the other EMEs.
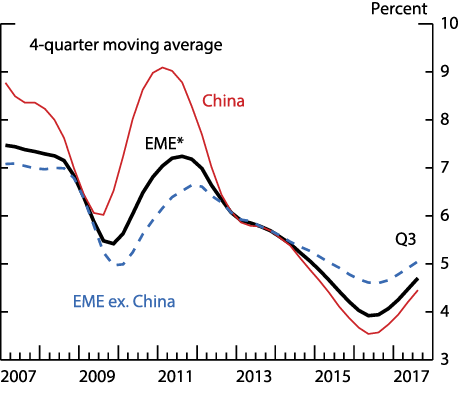
Note: Interest coverage ratio is earnings before interest, tax, depreciation, and amortization to interest expense. Average borrowing cost is interest expense as a percentage of total debt. Return on assets is earnings before interest, tax, depreciation, and amortization as a percent of total assets. Financial leverage is total debt to total assets.
* Emerging market economies (EME) include Argentina, Brazil, Chile, China (including Hong Kong), Hungary, India, Indonesia, Malaysia, Mexico, Poland, Russia, South Africa, South Korea, Thailand, and Turkey.
Source: Standard & Poor's Global Market Intelligence; Federal Reserve Board staff estimates.
Even if a high share of corporate debt is at risk in a particular country, it may pose limited systemic risk if corporate debt is itself a small share of GDP. Conversely, systemic risk may be greater if corporate debt outstanding is large relative to GDP, even with a smaller share of debt at risk. To provide an estimate of the systemic importance of the risky corporate debt, we scale risky debt for each economy by GDP. This can help gauge the potential costs to governments of rescuing these companies or their lenders if the debt were to turn bad.4
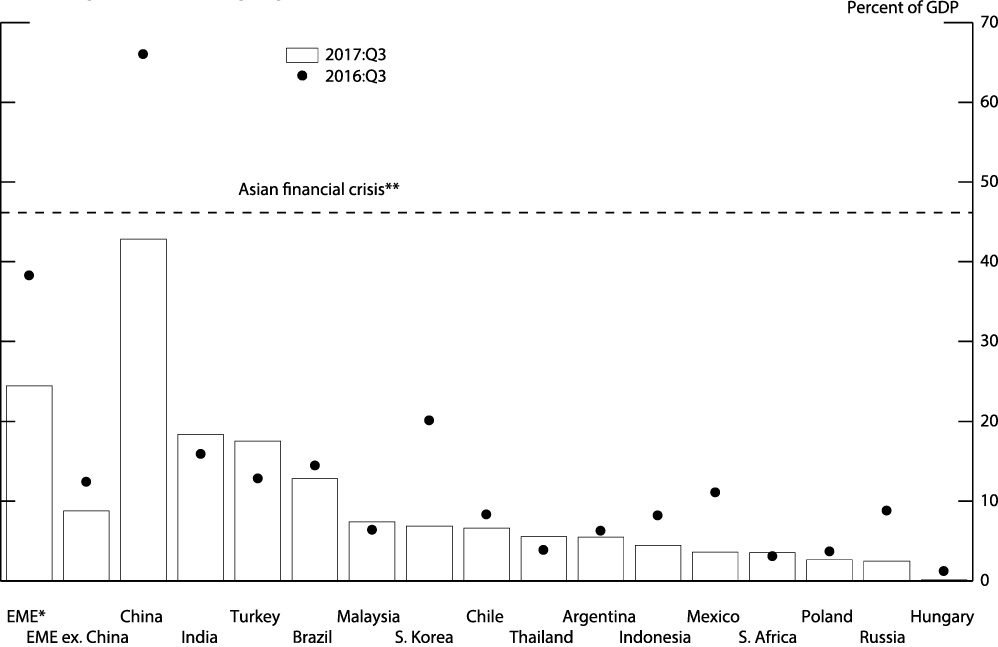
Note: Debt at risk is debt of firms with ratio of earnings before interest, tax, depreciation, and amortization to interest expense less than 2. GDP is gross domestic product.
* Emerging market economies (EME) include Argentina, Brazil, Chile, China (including Hong Kong), Hungary, India, Indonesia, Malaysia, Mexico, Poland, Russia, South Africa, South Korea, Thailand, and Turkey.
** Asian financial crisis is GDP-weighted average of Hong Kong, Singapore, South Korea, and Thailand in 1996.
Source: Bank for International Settlements; Standard & Poor's Global Market Intelligence; Federal Reserve Board staff estimates.
When scaled by GDP, risky debt in China exceeds 40 percent of GDP, a level just below that of the East Asian economies before the Asian financial crisis. The amount of risky debt relative to GDP is also notable in India, Turkey, and Brazil. For the other EMEs (including Argentina), the amount of risky debt seems manageable at less than 10 percent of GDP.
- Stress-testing the EME corporate sector
How vulnerable are EME NFCs to an increase in borrowing costs, perhaps related to monetary policy tightening in the advanced economies? To gauge these effects, we use firm-level data and stress each firm's financials by increasing the average borrowing cost 1 percentage point (the effects of which are shown by the red portion of the bars in Figure 9).5 Except for China, where debt at risk is estimated to rise 20 percentage points of GDP, this increase in borrowing costs by itself would not be problematic. But higher global interest rates might be accompanied by broader financial stress and slower EME growth. To model these effects, we consider two additional shocks: reducing earnings 20 percent and imposing a 20 percent exchange rate devaluation on the amount of debt that is denominated in foreign currency (the gray portion of the bars).6
Taken together, the three shocks double the share of overall EME risky debt in GDP to around the level observed for the East Asian economies before the Asian financial crisis. The increase mostly reflects China. Still, even outside of China, the shocks more than double the amount of risky debt in many EMEs. Despite this, even with all three shocks, debt at risk remains low as a share of GDP in many economies, because current ICRs are sufficiently high (Figure 10). If normalization of monetary policy in the advanced economies results only in higher borrowing costs for EME corporates, this problem appears to be manageable. However, if that rise in interest rates is accompanied by broader financial stress, which in turn results in depressed earnings and weaker currencies, the effects will be more adverse. Such developments could pose a threat to financial stability if they spill over to banks and create an adverse feedback loop that the authorities have trouble containing.
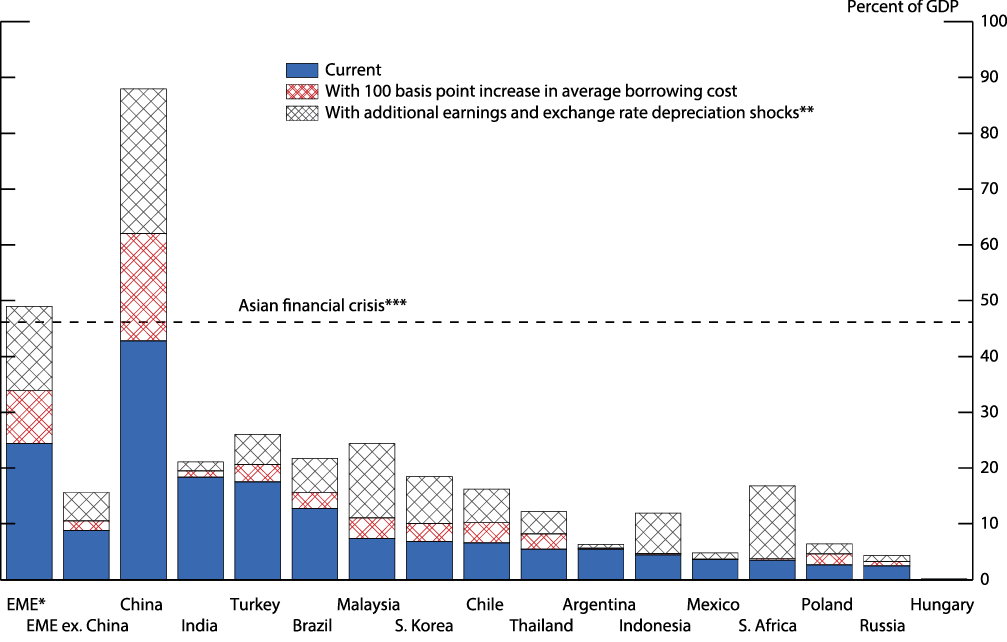
Note: Debt at risk is debt of firms with ratio of earnings before interest, tax, depreciation, and amortization to interest expense less than 2. GDP is gross domestic product.
* Emerging market economies (EME) include Argentina, Brazil, Chile, China (including Hong Kong), Hungary, India, Indonesia, Malaysia, Mexico, Poland, Russia, South Africa, South Korea, Thailand, and Turkey.
** Shocks include a 20 percent fall in earnings and a 20 percent depreciation of the local currency against the dollar.
*** Asian financial crisis is GDP-weighted average of Hong Kong, Singapore, South Korea, and Thailand in 1996.
Source: Ayala, Nedelijkovic, and Saborowski (2015); Bank for International Settlements; Standard & Poor's Global Market Intelligence; Federal Reserve Board staff estimates.
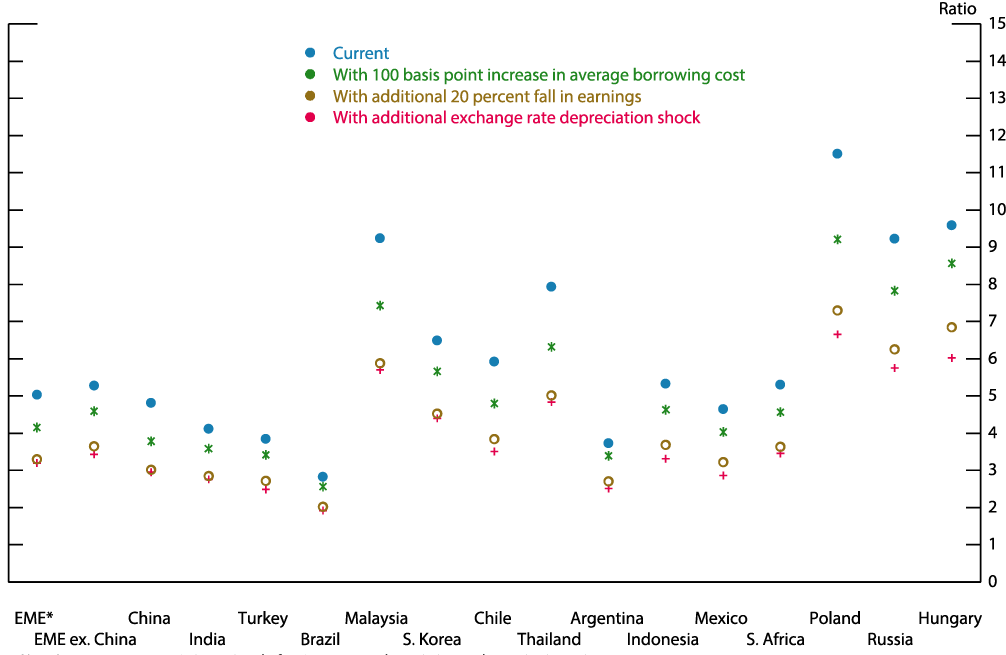
Note: Interest coverage ratio is earnings before interest, tax, depreciation, and amortization to interest expense.
* Emerging market economies (EME) include Argentina, Brazil, Chile, China (including Hong Kong), Hungary, India, Indonesia, Malaysia, Mexico, Poland, Russia, South Africa, South Korea, Thailand, and Turkey.
Source: Standard & Poor's Global Market Intelligence; Federal Reserve Board staff estimates.
References
Ayala, D., M. Nedeljkovic, and C. Saborowski (2015): "What Slice of the Pie? The Corporate Bond Market Boom in Emerging Economies," IMF Working Paper 148, International Monetary Fund.
Beltran, Daniel, Keshav Garud, and Aaron Rosenblum (2017). "Emerging Market Nonfinancial Corporate Debt: How Concerned Should We Be?," IFDP Notes. Washington: Board of Governors of the Federal Reserve System, June 2017.
Pomerleano, M. (1998): "Corporate Finance Lessons from the East Asian Crisis," Discussion Paper 155, The World Bank Group.
1. Federal Reserve Board of Governors, Division of International Finance. The views in this paper are solely the responsibility of the authors and should not be interpreted as reflecting the views of the Board of Governors of the Federal Reserve System or any other person associated with the Federal Reserve System. We thank Shaghil Ahmed, Carol Bertaut, Christopher Erceg, Steven Kamin, and Beth Anne Wilson for helpful comments. Return to text
2. See speech by Federal Reserve Chairman Jerome H. Powell "Monetary Policy Influences on Global Financial Conditions and International Capital Flows," May 8, 2018. Return to text
3. Throughout, earnings refers to earnings before interest, taxes, depreciation, and amortization, or EBITDA. For example, just before the Asian financial crisis, firms in Korea, Thailand, and Indonesia had an average ICR of 2; see Michael Pomerleano (1998) "Corporate Finance Lessons from the East Asian Crisis," Viewpoint: Public Policy for the Private Sector Note 155 (Washington: World Bank, October), https://openknowledge.worldbank.org/handle/10986/11531. Return to text
4. Because our sample does not include all the firms in an economy, we need to scale up our estimate of risky debt to approximate its likely total size. We use BIS data on credit to the nonfinancial private sector (total debt) as a share of GDP as the scale factor. Implicit in this scaling is the assumption that the share of risky debt of the firms in our sample is the same as that of the entire corporate sector in each economy. Return to text
5. Although on the face of it this shock does not seem too large, it is applied to the average interest rate on the entire existing debt, not just on new debt. Given that the average interest rate for EME firms is about 4¾ percent, a 1 percentage point rise increases the interest expense about one-fifth. Return to text
6. Because firm-level data on the currency composition of assets and liabilities are scarce, we compute the effect of this shock on the level of debt at risk by using aggregate foreign currency shares of debt provided by Ayala et al. (2015). That is, we assume that each firm within an economy holds the same share of foreign currency debt, equal to the aggregate share. Return to text
Beltran, Daniel O. and Christopher G. Collins (2018). "How Vulnerable are EME Corporates?" IFDP Notes. Washington: Board of Governors of the Federal Reserve System, June 2018, https://doi.org/10.17016/2573-2129.46.
Disclaimer: IFDP Notes are articles in which Board economists offer their own views and present analysis on a range of topics in economics and finance. These articles are shorter and less technically oriented than IFDP Working Papers.