June 15, 2009
Containing the Crisis and Promoting Economic Recovery
Governor Elizabeth A. Duke
At the Women in Housing and Finance Annual Meeting, Washington, D.C.
When I joined the Board of Governors last August, the other Board members were already formulating monetary policy to limit the economy-wide consequences of a very substantial housing downturn and actively responding to a severe financial crisis.
In September, the crisis intensified when the collapse and subsequent bankruptcy of Lehman Brothers triggered a sequence of events that brought credit markets--and in particular, the commercial paper (CP) market and interbank funding market--to a near standstill.1 The enormity of these events--and their potential implications for the economy--should not be underestimated. Credit plays a critical role in the undertaking of almost all production activities in the economy and a large portion of expenditure activities as well. The breakdown of credit markets that followed the collapse of Lehman, if left unchecked, could have meant a very significant contraction in economic activity. Indeed, you may have heard the anecdote soon after the Lehman collapse about Chairman Bernanke being asked, "Well, what if we don't do anything?" To which he replied, "There will be no economy on Monday."
Policymakers in the United States and the world certainly did not follow the course of "not doing anything," either with regard to the events of last September or more generally through the financial crisis. Policymakers in the Congress, the Department of the Treasury, the Federal Deposit Insurance Corporation (FDIC), and the Federal Reserve--and their counterparts abroad--were well aware of the dire implications that a lack of access to credit would have had on economic outcomes. And they were extremely active in formulating policies aimed at alleviating pressures in credit markets so as to ensure that the economy continued to function.
What I would like to do today--now nine months after the collapse of Lehman Brothers and the tumultuous events that followed--is to look back on the policies that have been implemented throughout the financial crisis and consider how well they have worked to lessen the broader impact of financial market disruptions. Of course, it is too early to gauge the influence of policy on the economy's evolution through the financial crisis. It is difficult to do this with precision in general, and it is especially difficult to undertake analysis so soon after the events have occurred with so little data since the policy implementation. However, what we can do is look at how conditions in specific financial markets, and credit volumes more generally, have evolved, and ask whether this information is at least suggestive that the policies that we have implemented have worked to avert a far more severe and detrimental outcome.
I will talk first about programs aimed at conditions in specific markets and the responses of those markets. I will then move to a discussion of credit aggregates more generally. I will use the Federal Reserve Flow of Funds data for four major credit types--residential mortgages, consumer credit, commercial real estate lending, and commercial and industrial loans--to compare credit aggregates in the current cycle to previous recessions generally considered to be credit-crunch periods. In particular, I will compare credit in the current crisis to the 1990-1991 episode that, as you might remember, also included a financial crisis. To preview my conclusions, I confess that I was actually rather startled by the pattern of the data. I originally started to look at these data to determine how much worse the credit contraction in this episode was compared with previous episodes. Instead, the data suggest that the actual credit contraction in this episode has been quite subdued compared with what might have been expected. So I do think that policies have helped maintain the flow of credit to businesses and households.
How Well Have Policies to Contain the Crisis Worked? A Market-by-Market Perspective
The policy responses to the financial crisis have been substantial and have occurred on all fronts. Fiscal policy and monetary policy, as well as policies relating to government guarantees and safety nets, such as deposit insurance, have been used to improve conditions in the financial sector. In discussing these policies and how they appear to have worked (or will likely work in the case of more-recent policies), I will start with policies and programs implemented by the Federal Reserve before moving to policies implemented by the government generally.
Apart from traditional monetary policy, the goal of which is to strengthen aggregate demand, the ultimate goal of the other policies is to maintain credit availability to households and businesses. In the more immediate term, these policies are focused on relieving stresses in particular markets or strengthening the financial condition of specific, or classes of, institutions.
Traditional Interest Rate Methods of Monetary Policy
The Federal Open Market Committee (FOMC) has responded to the financial crisis by aggressively easing short-term interest rates, beginning in September 2007. At its December 2008 meeting, the Committee reduced its target for the federal funds rate close to its lower bound, setting a range between 0 and 1/4 percent. With inflation expected to remain subdued for some time, the FOMC has indicated that short-term interest rates are likely to remain low for an extended period. By communicating this expectation, the FOMC reinforced market beliefs that its policy is likely to remain on hold, thereby putting downward pressure on longer-term rates, which have the greatest effects on spending behavior. This sort of communication can be very useful in stimulating borrowing and spending by businesses and households and promoting growth in economic activity.
Balance Sheet and Credit-Easing Policies
In addition to easing the traditional interest rate instrument of monetary policy, the Federal Reserve has been supporting credit markets through an expansion of the asset side of its balance sheet. This approach--described as credit easing--is conceptually distinct from quantitative easing, the policy approach used by the Bank of Japan from 2001 through 2006. Credit easing and quantitative easing both share the feature that they involve the expansion of the central bank's balance sheet. That said, the ways in which the policy approaches expand the balance sheet--and act to stimulate lending--are different.
Quantitative easing can be thought of as an expansion of the central bank's balance sheet with no intentional change in its composition. That is, the central bank undertakes more open market operations with the objective of expanding bank reserve balances, which the banking system should then use to make new loans and buy additional securities. However, when credit spreads are very wide, as they are at present, and the credit markets are quite dysfunctional, it becomes less likely that new loans and additional securities purchases will result from increasing bank reserve balances.
In contrast, credit easing focuses on the mix of loans and securities that the central bank holds as assets on its balance sheet as a means to reduce credit spreads and improve the functioning of private credit markets. The ultimate objective is improvement in the credit conditions faced by households and businesses. In this respect, the Federal Reserve has focused on improving functioning in the credit markets that are severely disrupted and that are key sources of funding for financial firms, nonfinancial firms, and households.
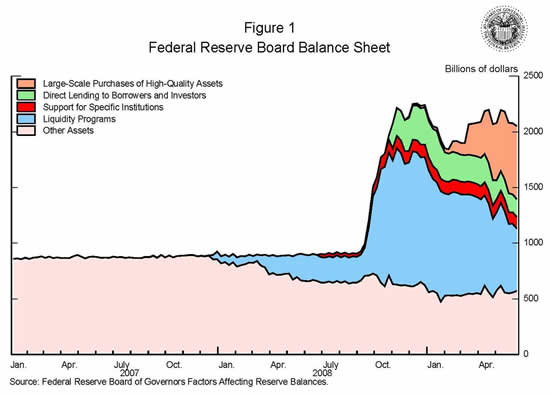
Figure 1 graphs the asset side of the Federal Reserve balance sheet, which has expanded substantially since the end of the third quarter of 2008. Federal Reserve initiatives with regard to the expansion of the asset side of its balance sheet can be grouped by the markets those initiatives are intended to help: (1) targeted actions to prevent the failure or substantial weakening of specific systemically important institutions, which are shown by the red area; (2) liquidity programs for financial institutions, which are shown by the light blue area; (3) lending to support the functioning of key financial markets, which are shown by the green area; and (4) large-scale purchases of high-quality assets, which are shown by the pink area.
1. Targeted actions aimed at specific systemically important institutions. Targeted actions to prevent the failure or substantial weakening of specific systemically important institutions include the first Maiden Lane transaction in March 2008, which extended support to facilitate the merger of Bear Stearns and JPMorgan Chase. It also includes loans and facilities supporting American International Group (AIG). These actions were driven by concerns that the disorderly failure of a large, complex, interconnected firm would impose significant losses on creditors, including other financial firms, dislocate a wide range of financial markets, and impede the flow of credit to households and businesses.2 To be sure, in no sense were these actions taken to protect the affected firms' managers or shareholders from the costs of past mistakes. Although I was not present for the Bear Stearns transaction, I can tell you that the decisions regarding loans to AIG were extremely difficult and uncomfortable. But at the time, the Federal Reserve was the only government entity with authority to act, and the tremendous risks to the financial system and the real economy implied by the failure of a large, complex, interconnected firm made the option of not acting unthinkable.
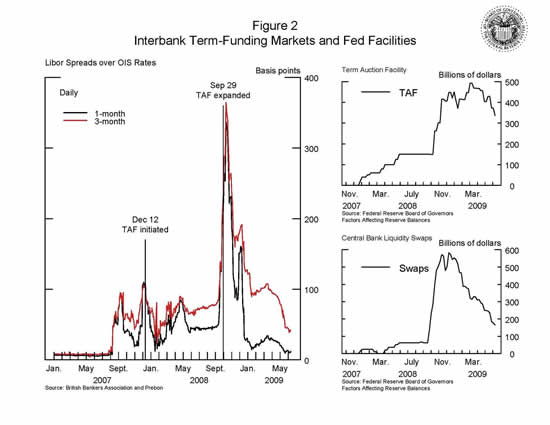
2. Liquidity programs for financial institutions. Since the onset of the crisis, the Federal Reserve has also modified existing facilities and implemented a number of new ones to provide liquidity to sound financial institutions in an environment in which interbank funding markets and repurchase agreement, or repo, markets (for securities other than Treasury securities) are severely disrupted.
For example, the Federal Reserve has improved banks' access to short-term credit by temporarily relaxing the terms on the discount window and by expanding--through the introduction of the Term Auction Facility and the establishment of reciprocal currency arrangements (liquidity swap lines) with foreign central banks--the range of programs through which it can lend to depository institutions.3 Ultimately, the objective of liquidity programs is to facilitate the intermediation of credit to households and businesses. The immediate goal of such facilities, however, is the reduction of stresses in the interbank funding market. The significant narrowing since the start of this year in important measures of stress in this market--specifically, Libor-OIS spreads, shown in the left panel of figure 2--together with diminished usage of these facilities--shown to the right--suggest that some easing in this market has occurred in line with the implementation and expansion of these initiatives.
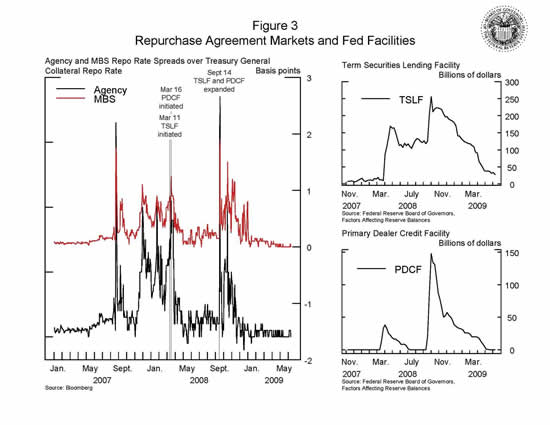
In a similar manner, the Term Securities Lending Facility (TSLF) and Primary Dealer Credit Facility (PDCF) provide liquidity to primary dealers to allow them to perform their function of making markets to support their customers' needs to buy, sell, and issue securities.4 The immediate goal of these facilities was the reduction of stresses in repo markets for securities other than Treasury securities. The narrowing of spreads between repo rates on agency and mortgage-backed securities (MBS) and Treasury general collateral repo rates--shown in the left panel of figure 3--together with diminished usage of the TSLF and PDCF--shown to the right--suggest that stresses in this market have eased since November.
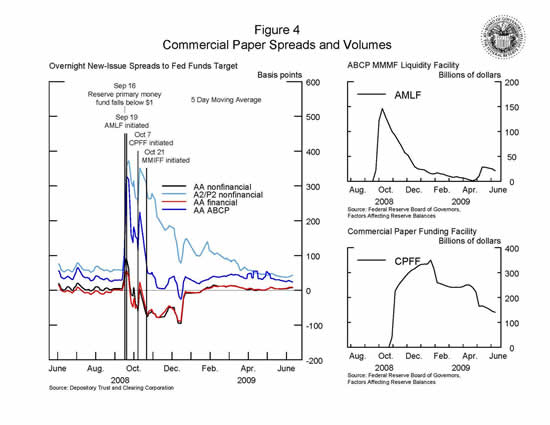
3. Lending to support key financial markets. Credit-easing policies have also been targeted at improving conditions in key financial markets--specifically, markets for commercial paper, asset-backed securities (ABS), and commercial mortgage backed securities (CMBS).
Money market mutual funds have significant investments in CP. When Lehman Brothers failed, it caused at least one money market mutual fund to "break the buck," leading to a run on money market funds. Three facilities--the Asset-Backed Commercial Paper Money Market Mutual Fund Liquidity Facility, the Commercial Paper Funding Facility and the Money Market Investor Funding Facility--were created to restore the functioning of CP markets and allow money market mutual funds to manage through the volatility.5 Conditions in the CP market have improved markedly since the introduction of the various Federal Reserve facilities aimed at fostering market liquidity. CP spreads--shown in the left-hand panel of figure 4--have declined sharply since these facilities went into effect. As with the bank and primary dealer-oriented facilities, when spreads narrowed, usage subsided, as shown in the right-hand panel. While usage has declined significantly, market participants tell us that the backstop provided by the facilities continues to bolster market confidence.
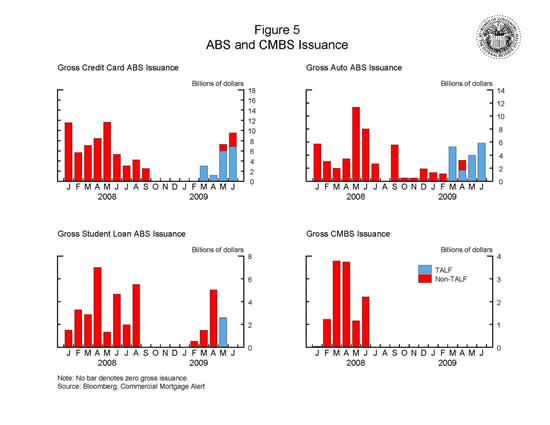
The Term Auction Lending Facility (TALF) was created as a joint endeavor of the Federal Reserve and Treasury to support economic activity by making credit more readily available for consumers and businesses. The facility provides loans with maturities of up to five years to investors to help finance their acquisitions of certain ABS and CMBS. The program was announced in late 2008 at a time when ABS and CMBS markets had essentially shut down, which thereby threatened to limit credit availability to households and businesses. Initially, eligible collateral included newly issued triple-A-rated ABS backed by a variety of loans to consumers and small businesses. Recently, the Board announced that triple-A-rated newly issued and legacy CMBS would also be accepted as collateral.6
Conditions in the markets for consumer ABS have improved notably since the beginning of this year and more recently have improved in the markets for CMBS. Estimates of spreads on triple-A-rated consumer ABS have narrowed between 70 to 80 percent from peak levels in December 2008. Estimates of spreads on triple-A-rated CMBS have also moved down since March, although such spreads remain well above their levels observed a year ago.7 While the now familiar improvement in spreads is good news, the real story of TALF is in new issuance, shown in figure 5. Remembering that these securities are used to finance new loans, look at the virtual shutdown of securitization that occurred starting last fall in the credit card, auto, student loan, and commercial real estate markets. The TALF began operation in March. For the first two months, TALF lending and associated ABS issuance was fairly low, in part because investors were unfamiliar with the program, but investor interest picked up considerably in May and June and consumer ABS issuance has returned to levels near those seen before the disruption of ABS markets last fall. In addition, some ABS issues have come to market outside of the TALF, and these are taking place at greatly improved spreads. We hope to see similar improvements in the CMBS market later this summer when the first TALF loans collateralized by newly issued and legacy CMBS are expected.
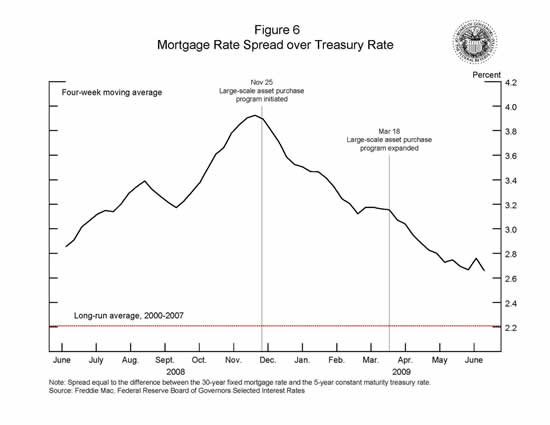
4. Large-scale purchases of high-quality assets. Credit-easing policies have also been implemented through the purchase of high-quality assets aimed at improving mortgage lending and housing markets as well as overall conditions in private credit markets. In November 2008, the Federal Reserve announced plans to purchase a total of up to $1.25 trillion of agency MBS and up to $200 billion of agency debt by the end of the year, and in March 2009, the Federal Reserve announced that it may also buy up to $300 billion of Treasury securities by the fall.8
The program appears to be having its intended effect. Yields on mortgages relative to Treasury yields have come down since November 2008. As shown in figure 6, the 30-year fixed mortgage rate relative to the 5-year constant maturity Treasury rate benchmark has declined about 1-1/4 percentage points since the first MBS purchase program was announced. Indeed, today mortgage spreads are a lot closer to their mean for 2000-2007 than they were in November. That said, mortgage rates have recently risen with the increase in Treasury rates.
Fiscal Policy: Emergency Economic Stabilization Act
In October 2008, the Congress passed the Emergency Economic Stabilization Act (EESA), which enabled a series of initiatives to provide confidence in the financial system and to strengthen market stability. The ultimate goal of all these initiatives was to increase the flow of financing to U.S. businesses and consumers and to support the U.S. economy.
Lending activities require both capital and liquidity. While the Federal Reserve had been providing liquidity, equity markets were virtually closed to financial firms last fall. Using authorities and funding provided by EESA, the Treasury's Capital Purchase Program provides government capital investments to banks in good condition. Since last fall, nearly $200 billion has been invested under this program.
Confidence in the U.S. banking system has also been supported by temporary extensions of government safety net policies. A component of EESA was the temporary raising of the basic limit on federal deposit insurance coverage from $100,000 to $250,000 per depositor. In line with this change, the FDIC also announced the provision of full coverage of noninterest bearing deposit transaction accounts under its temporary Transaction Account Guarantee Program. In addition, the FDIC began guaranteeing newly issued senior unsecured debt of banks, thrifts, and certain holding companies under the Temporary Liquidity Guarantee Program (TLGP).9 Since late April, some banks have issued debt outside of the TLGP, albeit with spreads of several percentage points higher than debt issued under the program. This activity suggests that the TLGP is providing an important source of support to the funding needs of banks, thrifts, and their parent companies.
The Supervisory Capital Assessment Program
In February of this year, the Federal Reserve, as part of the Treasury's Financial Stability Plan, initiated the Supervisory Capital Assessment Program (SCAP) to evaluate whether large U.S. banking institutions would need to raise a temporary capital buffer to be able to withstand losses in a more challenging economic environment than generally anticipated. The SCAP determined the capital buffer by estimating losses and internal resources to absorb losses at the 19 largest U.S. banking institutions. The scenario used to estimate the buffer was more adverse than that expected by the consensus of private forecasters. The exercise was conducted by more than 150 examiners, analysts, economists, accountants, attorneys, and other professionals from the Federal Reserve, the Office of the Comptroller of the Currency, and the FDIC.
When completed, the assessment indicated that additional capital buffers--with a total value of $185 billion--were required by 10 out of the 19 institutions to maintain Tier 1 capital in excess of 6 percent of total assets and Tier 1 common equity capital in excess of 4 percent under the more adverse scenario. Of the $185 billion, the equivalent of $110 billion had already been raised or committed prior to the announcement of the results in early May. And since the announcement, these firms have raised about $50 billion from equity offerings, preferred stock conversions, and asset sales. I believe the early success shown by firms in accessing private capital demonstrates the improvement in market confidence provided by the SCAP exercise. With renewed access to nongovernment debt and private capital, many institutions have announced intentions to repay the government preferred stock issued under the CPP.
How Well Have Policies to Contain the Crisis Worked? An Aggregate Credit Perspective
So far I have discussed evidence that programs directed at dysfunction in specific markets has been successful in alleviating stresses in those markets. But the ultimate goal of those policies as well as those aimed at strengthening financial institutions is to improve the flow of credit to households and businesses. I now want to look at this ultimate goal by examining how credit volumes have evolved over this current business cycle downturn relative to previous downturns, as identified by the National Bureau of Economic Research (NBER) Business Cycle Dating Committee. I will do this using the Federal Reserve's Flow of Funds data. In most instances, I will focus only on those downturns associated with credit crunches.10
A credit crunch, according to the White House Council of Economic Advisers, "occurs when the supply of credit is restricted below the range usually identified with prevailing market interest rates and the profitability of investment projects."11 Judging whether a credit crunch is happening in real time--and, to some extent, even in hindsight--is not easy. It is extremely difficult to sort out the relative importance on the flow of credit of reduced demand due to weaker economic activity, reduced supply because borrowers appear less creditworthy, or reduced supply because lenders face pressures, such as a shortage of capital, that restrain them from extending credit. In other words, while demand considerations could certainly result in a decline in credit flows, a reduction in the supply of credit--caused either by bank balance sheet pressures or by banks being reluctant to lend to less-creditworthy borrowers--could produce the same result. Anecdotal evidence and some academic research suggest that the recessions that followed the business cycle peaks in 1969, 1973, 1981, and 1990 were credit-crunch recessions.12 Clearly, the current downturn--specifically, that following the December 2007 business cycle peak--is also considered a credit-crunch recession.
How Has Credit Evolved during This Business Cycle?
Growth of the broad credit aggregates. In looking at the evolution of credit in both the current and past business cycle downturns, I will look at four major types of credit: home mortgages, commercial mortgages, consumer credit, and nonfinancial business credit. Figure 7 presents four-quarter growth rates for each credit type from 1952 to 2008, where the shaded areas denote NBER recession periods. As can be seen from the figure, credit growth typically declined prior to and during economic downturns, and this time-series pattern is readily apparent in the current downturn in all four panels.
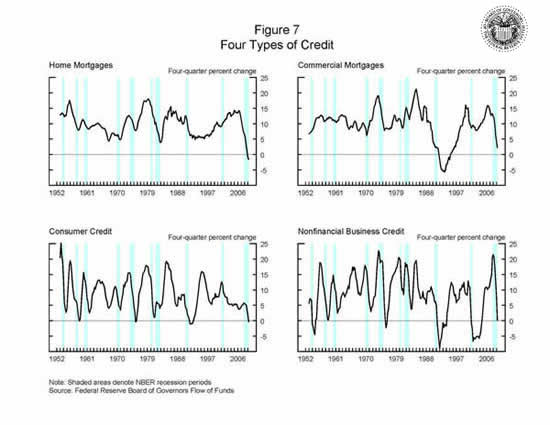
In the current downturn, the reduction in lending growth that stands out as being the most "out of the ordinary" is that of home mortgages, which is shown in the top-left panel. Home mortgage volumes actually contracted for the first time in the Flow of Fund's 50-plus year history over the four quarters ended 2008:Q4, after having always maintained growth above 4 percent. In terms of being an outlier relative to past business cycles, the current experience for home mortgages is similar to that of commercial mortgages in the 1990-91 recession, which is shown in the top-right panel.
In the downturn following the 1990 business cycle peak, commercial mortgage volumes contracted after having never contracted (in nominal terms) before that. This downturn also included a financial crisis, although then it was due to commercial real estate rather than residential real estate, as it is now. Given the similarities between these two business cycle downturns, it seems interesting to compare them.
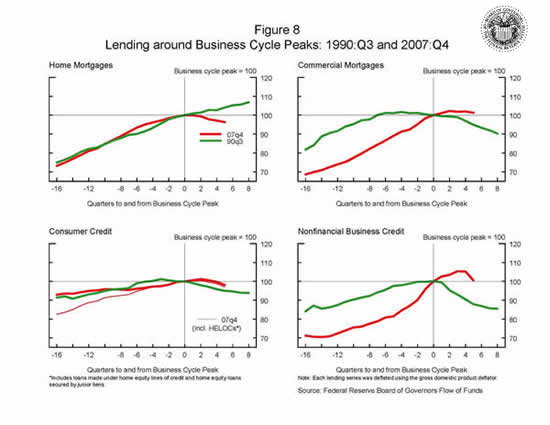
A comparison of the current downturn with the one that followed the 1990:Q3 peak. Figure 8, which shows the same credit types as figure 7, provides "butterfly" charts for inflation-adjusted levels of four different types of lending--home mortgages (top-left panel), consumer credit (bottom-left panel), commercial mortgages (top-right panel), and nonfinancial business credit (bottom-right panel)--over the current downturn and the 1990-91 recession. The series in the charts have been normalized to 100 at each business cycle peak, which is also marked with the vertical bar.13 Normalized lending data for quarters prior to and after each business cycle peak are color-coded to each peak. Data associated with the 1990:Q3 peak are shown using thick dark green lines, and data associated with the recent 2007:Q4 peak are shown using thick red lines. Activity to the left represents the 16 quarters leading up to the peak, and the activity to the right represents the 8 quarters following the peak. A steeper line to the left of the vertical bar implies higher credit growth prior to the peak; a more negatively sloped line to the right implies a larger reduction in credit during the downturn.
The right side of the chart considers commercial mortgages and nonfinancial business credit. Both of these lending aggregates expanded more rapidly in the lead up to the 2007 business cycle peak than in the lead up to the 1990 peak, and both also contracted (or continued to contract) immediately after the 1990 business cycle peak. Until recently, neither lending aggregate had declined in the current downturn, but in the first quarter of this year, nonfinancial business credit contracted quite sharply.
For consumer credit (in the lower-left panel), it matters--in the lead up to the most recent business cycle peak--how we measure it. Without home equity lines of credit (HELOCs) and home equity loans, the increase in consumer credit in the lead up to the 1990 and the 2007 business cycle peaks are broadly similar. If we include all HELOCs and home equity loans, which can be used in a similar way to consumer credit, then lending in the lead up to the 2007 business cycle peak--represented by the thin red line--increases more notably.14 Consumer credit contracted in the 1990-91 recession but has remained broadly flat in the current downturn, albeit with a slight downward drift in more recent quarters.
For home mortgages, shown in the top-left panel, lending expanded similarly in the lead up to both the 1990 and the 2007 business cycle peaks. In contrast to the other types of credit, this type of lending did not contract in the 1990-91 recession but has contracted since the peak of this cycle.
Apart from home mortgages, the drop-off in credit in the 1990-91 recession was notably more severe than what has been experienced so far in the current downturn. There are two possible reasons why this might happen. One is that demand for credit turned down more sharply in the 1990-91 recession than in the current downturn, but I do not think that this is the reason. The slowdown in economic activity in the 1990-91 recession was nowhere near as severe (either in terms of depth or duration) as it has been to date in the current recession, which the NBER still considers to be ongoing. This difference in economic activity across the two recessions suggests that it is unlikely that credit demand contracted more sharply in the 1990‑91 recession than in the current downturn. The other possible reason, which I think more likely, is that credit supply conditions have been a little more favorable--albeit still stressful--in the most recent downturn relative to those during the 1990‑91 recession. I believe this difference does reflect policy. That is, all the facilities and programs laid out earlier have acted to shore up the financial sector and to prevent a notably more severe contraction in credit than we have seen.
Given the stark differences between the paths of credit in the current recession compared with those of 1990-91, I want to see if the same patterns hold true in comparison with other credit-crunch recessions.
A comparison of the current downturn with other credit-crunch recessions that occurred within the past 40 years. Figure 9 provides butterfly charts for the same four inflation-adjusted levels of credit as shown in figure 8, now shown with the last five business cycle peaks that preceded credit-crunch recessions--specifically, the business cycle peaks in 1969, 1973, 1981, 1990, and 2007. Data associated with the most recent peak continue to be shown by thick red lines. Data associated with the 1990 peak are now shown by thinner dark green lines.15
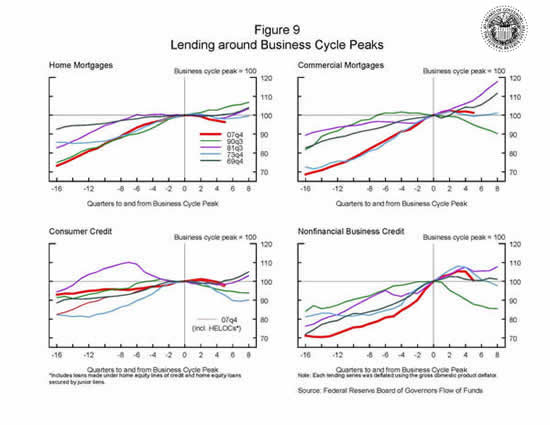
Figure 9 indicates that, with the exception of housing, lending over the current downturn does not appear particularly weak or subdued relative to other downturns. Indeed, for all categories of lending other than home mortgage lending (shown in the top-left panel), there are at least two other downturns for which the paths of lending after the business cycle peak lie below that following 2007:Q4 (that is, the drop-off in credit was more pronounced). Even for home mortgages, the decline in lending is not tremendously large relative to the experience of past business cycle downturns. In contrast, over the 1990-91 recession, lending, with the exception of home mortgages, experienced either the largest or the second-largest contraction of all credit-crunch-associated downturns.
This feature is even more prominent when lending only by depositories is considered. Figure 10 has the same format as figure 9 but presents time-series data on lending by depository institutions only--that is, commercial banks, savings institutions, and credit unions.16 Figure 10 indicates that lending by depositories over the current downturn does not appear particularly weak or subdued relative to other downturns. Indeed, for all components of credit other than home mortgages, the path of lending in the current downturn lies toward the upper end of the range of outcomes for past business cycle downturns. Of course, some of the observed lending by depositories in the current downturn does reflect the safety-valve role played by financial intermediaries in the financial system--that is, households and, in particular, businesses drawing on existing lines of bank credit when alternative sources of finance have become more difficult to obtain. Finally, when home mortgages made by depositories only is considered, the path of lending lies within the range of outcomes for past business cycle downturns (albeit toward the lower part of the envelope).
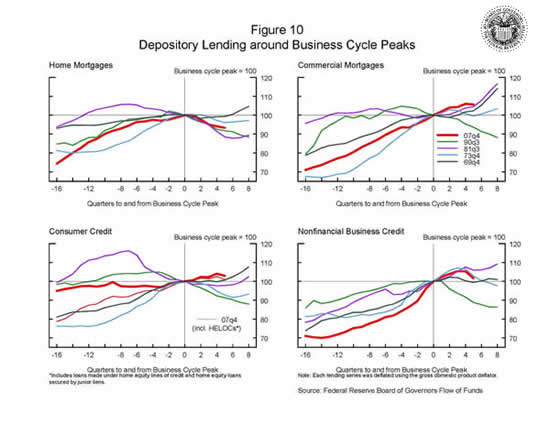
Given the enormity of some of the events of the past year, the findings of these business cycle comparisons may seem somewhat surprising. However, as was evident from the facilities and programs discussed earlier, policy has been extremely active in the current credit crisis, especially with respect to the banking sector.
Given the similarities between home mortgages in the current downturn and commercial mortgages in the 1990-91 recession, as well as the commonality that both recessions were characterized by a financial system crisis, the outcomes for lending in the 1990-91 recession could be thought of as a possible scenario for lending in the current downturn in the absence of any policy response. That said, the likely path of lending in the current downturn without any policy response would have been notably more contractionary than in the 1990-91 recession given that the earlier episode--while characterized by a financial crisis--did not face as extreme an episode as the one experienced last September.
Conclusion
Today I have reviewed developments in specific financial markets following the introduction of Federal Reserve and other agency facilities and programs, and have considered the evolution of the major categories of credit in both the current economic downturn and past downturns. This assessment of the data suggests that these government programs have been broadly successful in relieving stresses in the key credit markets. This success is also reflected in aggregate credit data, which indicate that most categories of household and nonfinancial-firm lending in the current recession do not appear especially weak relative to past recessions. Given the enormity of events over the past year, this result is a surprising but reassuring early indication that the combined policies have been successful at shoring up credit despite these events.
A note of caution is in order however. In the past, economic downturns were deepened or prolonged by the premature withdrawal of monetary or fiscal stimulus. To the extent that the severity of the current downturn has thus far been mitigated by extraordinary credit support, a significantly weaker path of lending--and thereby economic activity--could very likely occur if policy support for the financial sector is withdrawn too soon. In this case, stigmatization of support tools such as liquidity programs, direct lending programs, or government capital injections that make participants unwilling to use such programs will have the same effect as a direct policy withdrawal of the programs. And while the path of credit in this cycle compared with others is encouraging, the downturn in credit evident in the most recent quarter provides a reminder that conditions are still far from normal.
Footnotes
1. Losses on Lehman Brothers' debt securities that resulted from the investment bank's bankruptcy caused one money market mutual fund to "break the buck," with others also rumored to do so. This situation led to a rapid escalation in money market mutual fund outflows such that short-term funding markets for businesses and municipalities essentially froze. Interbank funding markets also stopped functioning, and overnight rates soared to extraordinarily high levels. Return to text
2. Losses sustained by other financial firms could then erode their financial strength, limiting their ability to play their intermediation role or even cause them to fail, thereby reinforcing financial pressures. In addition, the disorderly failure of a large, complex, interconnected firm could undermine confidence in the U.S. financial sector more broadly, potentially triggering a widespread withdrawal of funding by investors and an additional tightening of credit conditions, which would, in turn, cause a further reduction in economic activity. Return to text
3. Specifically, the Federal Reserve has relaxed the terms on the discount window by lowering the spread between the discount rate and the target federal funds rate from 100 to 25 basis points and extending the maturity on discount window loans, which now have a maximum duration of 90 days.
The Term Auction Facility provides credit to depository institutions through an auction mechanism, and liquidity swap lines provide U.S. dollar funding indirectly to foreign banks whose liquidity demands ultimately affect U.S. financial markets. Both of these initiatives have been expanded several times during the crisis, most notably when market turmoil reached a peak in September last year. Return to text
4. The TSLF was established in March 2008 as some large investment banks faced increasingly severe liquidity pressures, which began to limit their ability to hold inventories of financial assets and thereby make markets. The TSLF allows primary dealers to borrow Treasury securities from the Federal Reserve for one-month terms against less-liquid collateral, which they can then use as collateral to borrow cash from private counterparties. The PDCF was established shortly after as a backstop source of liquidity for primary dealers. Return to text
5. The Asset-Backed Commercial Paper Money Market Mutual Fund Liquidity Facility finances purchases of high-quality asset-backed commercial paper by U.S. depository institutions and bank holding companies from money market mutual funds, and the Money Market Investor Funding Facility provides liquidity to U.S. money market mutual funds and certain other money market investors. Both facilities are aimed at assisting money market mutual funds that hold CP to meet investor redemption demands, thereby increasing these funds' willingness to invest in money market instruments. The Commercial Paper Funding Facility was set up to provide a liquidity backstop to U.S. issuers of CP through a specially created limited liability company, which could purchase three-month unsecured and asset-backed commercial paper directly from eligible issuers. Return to text
6. The types of collateral eligible under TALF are: the highest investment-grade-rated tranches of ABS issued on or after January 1, 2009, for which the underlying credit exposures are auto loans, student loans, credit card loans, equipment loans, floor plan loans, insurance-premium finance loans, small business loans fully guaranteed as to principal and interest by the U.S. Small Business Administration, and receivables related to residential mortgage servicing advances or commercial mortgage loans; the highest investment-grade-rated tranches of CMBS issued on or after January 1, 2009; and certain high-quality CMBS issued before January 1, 2009. Return to text
7. The observed narrowing of spreads likely represents both direct and indirect benefits of the TALF to financial markets. The direct benefit is the increased demand for the specific types of securities that are eligible for the TALF, which has likely contributed to the observed reduction in spreads. The indirect benefits are the increase in the general level of confidence in the financial system, which has almost certainly contributed to the narrowing of risk premiums in a wide variety of markets, including cash markets--such as the corporate bond and leveraged loan markets--as well as markets for a range of structured products. Return to text
8. As of June 10, the Federal Reserve held $427 billion of agency MBS and $84 billion of agency debt (of which almost all was purchased since late November) and $622 billion of Treasury securities (of which $210 billion was purchased since March). Return to text
9. Since the TGLP went into effect in November 2008, $265 billion in debt has been issued by 30 parent companies and 37 firms, with spreads over Treasury securities in recent months remaining on the order of 1/4 to 3/4 percent, depending on the maturity Return to text
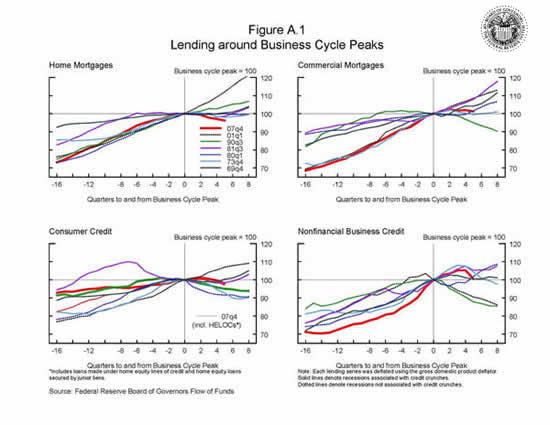
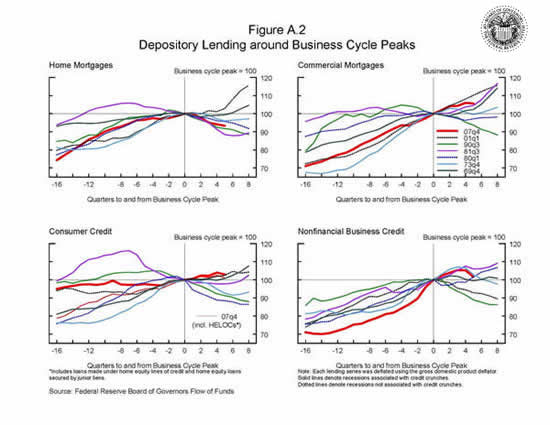
10. In these cases, however, accompanying charts (figures A.1 and A.2) that show the paths of credit over business cycle downturns in both credit-crunch and non-credit-crunch recessions are available online. Return to text
11. Council of Economic Advisers (1992), Economic Report of the President (Washington: Government Printing Office), p. 46. Return to text
12. More specifically, the business cycle peaks occurred in 1969:Q4, 1973:Q4, 1981:Q3, and 1990:Q3. Kaufman (1991) cites credit crunches that occurred in 1959, 1969-70, the mid-1970s, 1981-82, and 1990-91. See Henry Kaufman (1991), "Credit Crunches: The Deregulators Were Wrong," Wall Street Journal, October 9. Also see Albert M. Wojnilower (1980), "The Central Role of Credit Crunches in Recent Financial History," Brookings Papers on Economic Activity, vol. 11, pp. 277-340. Return to text
13. The normalization of each series is also made so that the difference between the level of a lending series at any date and the level at the business cycle peak has a percentage interpretation. For example, if a line has a value of 80 at some date before or after the business cycle peak, it means that the level of the category of lending that the line represents is 20 percent below the level of lending at the business cycle peak. Likewise, if a line has a value of 110 at some date, it means that the level of the category of lending that the line represents is 10 percent above the level of lending at the peak of the business cycle. Return to text
14. Note that cash-out refinancing--like HELOCs and home equity loans--can also be used in a similar way to consumer credit, which is not included in the chart. Return to text
15. A set of charts (figures A.1 and A.2) are provided online that also include the paths of credit around the business cycle peaks preceding non-credit-crunch recessions Return to text
16. Note that the data for depositories shown in figure 10 also use the Flow of Funds Accounts. Return to text