September 01, 2008
The United States in the International Financial System: A Separate Reality? Resolving Two Puzzles in the International Accounts
Governor Randall S. Kroszner
At the Central Bank of Argentina 2008 Money and Banking Conference, Buenos Aires, Argentina
I would like to thank the organizers here at the Bank for inviting me to this year's conference and for giving me the opportunity to join Madam Hu and Bill White in this session on “Different Tools, Different Realities. Differences in “tools” have been much discussed recently, in both the abstract (such as how the goals of monetary policy are set and communicated) and the operational (such as the structure of facilities used to provide liquidity to the financial system). Rather than continue this discussion, I would like to focus on the second part of the session title and ask whether the United States can be said to face a different economic “reality” than that faced by the rest of the world. The term reality can, of course, be interpreted in a number of ways; today, I am going to use it to refer to international trade and financial linkages that transmit disturbances, or “shocks,” from one economy to another.
In asking whether the United States faces a different reality, I am, in effect, asking whether the United States has become decoupled from the global economy. After arguing against the decoupling hypothesis, I will address two apparent puzzles in the international financial accounts that might suggest that the United States faces different financial constraints than other countries. However, I will show that a careful analysis of the data reveals that the United States, in fact, faces a “reality” very similar to that of other countries.
Are the United States and the Rest of the World Decoupled?
Some commentators suggested last year that the rest of the world would remain relatively unaffected by the housing slowdown in the United States. However, as turmoil emerged in financial systems around the world in the late summer of 2007, it became clear that this was not the case. Concerns about financial securities backed by U.S. mortgages spread to asset-backed securities more generally, which led to funding difficulties in European money markets at anything but the shortest maturities.
Moving into 2008, concerns about potential spillovers from slower U.S. growth and weaknesses in the financial system weighed increasingly on advanced economy equity markets. As the step-down in growth of gross domestic product (GDP) in a number of advanced economies became apparent, we also began to see reduced growth and prospects for growth in many emerging market economies, and stock markets in emerging economies declined sharply. Throughout the world, the challenges posed by weakening economic activity were further complicated by mounting inflationary pressures as food and energy prices soared. By now I believe it has become clear that the initial assessment that the United States had decoupled from the rest of the world was incorrect, and that, in fact, the global economy remains closely connected by both trade and financial linkages.
Global Trade Linkages
Trade linkages among countries are, broadly speaking, relatively well understood: One country's imports are another's exports. That is, of course, an oversimplification, but it captures a key element of global trade linkages, that exports to other countries can provide a direct and powerful stimulus to the domestic economy. The importance and benefits of free trade are widely accepted, although agreement on how to allocate these benefits is not always easy to come by. When domestic markets for goods and services are unrestricted and open to sellers worldwide and when supply adjusts efficiently to meet changes in demand, costs to consumers are minimized. The recent sharp increases in global food prices have underscored the importance of reducing barriers to trade in agricultural products. Reducing such barriers was one of the key subjects of the latest set of talks in the Doha round, and I am disheartened that this round of talks collapsed. Given the urgent need to expand the global food supply to meet burgeoning world demand, it is particularly unfortunate that these negotiations were unable to make progress.
Global Financial Linkages
Today's global financial linkages are quite complex and subtle. The nature and extent of these financial linkages are reflected in a range of characteristics, which include not only the net international investment positions but also the sizes of gross cross-border claims and liabilities positions, the composition of these positions by asset type, and the returns on the underlying assets. A quick review of these characteristics of U. S. financial linkages to the world will help resolve some puzzles in international finance that might otherwise suggest that the United States faces a different “reality” than other countries.
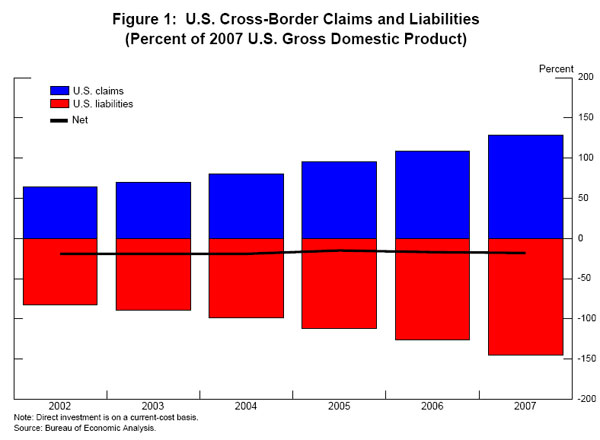
First, investments made by U.S. residents abroad and by foreigners in the United States are enormous, both in absolute terms and as shares of GDP. (See figure 1.) Last year, for example, U.S. liabilities to foreigners totaled more than $20 trillion, exceeding 140 percent of U.S. GDP. At the same time, U.S. claims on foreigners totaled $17.5 trillion, roughly 130 percent of U.S. GDP. Even the net liability position of the United States is sizeable, $2.5 trillion or more than 17 percent of GDP. This net position as a share of GDP has remained fairly constant in recent years, while gross claims and liabilities have both been growing steadily.
Second, within these enormous gross positions is a great variety of types of claims and liabilities, including many forms of direct investment, equity securities, and debt instruments.1 (See figure 2.) The composition of U.S. liabilities is quite different than the composition of U.S. claims on the rest of the world. For example, more than two-thirds of U.S. liabilities are in the form of debt instruments, while over half of U.S. claims are in equity securities and direct investment. Some call this the “venture capitalist” nature of the U.S. external position: U.S. investments abroad tend to be concentrated in relatively risky equity instruments, but liabilities of the United States tend to be in low-volatility debt instruments.
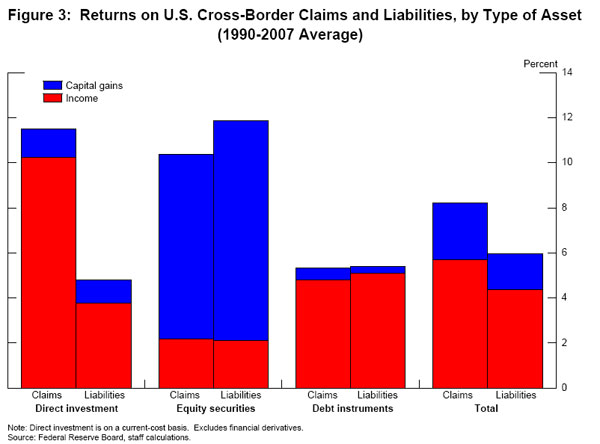
Third, the different asset classes tend to have different rates of return for both capital gains and income. (See figure 3.) The return on equity securities (both claims and liabilities), for instance, is mainly from capital gains, while the return on debt instruments and direct investment is primarily from income. For debt and equity securities, the income return and the rate of capital gain on U.S. claims are roughly the same as those on U.S. liabilities. This is not true, however, for direct investment: The income return on direct investment by the United States in other countries is more than twice as high as the income return foreigners receive on their direct investment in the United States. Taking into account the differences in returns and the differences in the composition of assets, the total return on U.S. claims turns out to be about 2 percentage points per year higher than the return that the United States pays on its liabilities to the rest of the world.
Puzzles in the U.S. International Accounts
Some apparently puzzling features of the U.S. cross-border investment positions have given rise to a number of hypotheses, several of which spring from the notion that the United States is unique in important respects. For example, in two cases that I will discuss today, some observers have concluded, first, that the United States is able to borrow on highly advantageous terms to finance its external deficits and, second, that the United States receives a much higher return on its foreign investments than other countries receive on their investments in the United States. Some novel theories have been developed to support these interpretations. Recent work by Federal Reserve staff, however, has shown that one need not resort to such exotic explanations to understand the behavior of the international accounts. Instead, a careful look at the published data reveals that differences in the three characteristics of U.S. claims and liabilities that I just discussed--returns, composition, and size--contain the key to understanding these apparently anomalous results and, hence, that the United States faces a “reality” similar to that of other countries.
Puzzle 1: Do Foreigners Pay to Lend to the United States?
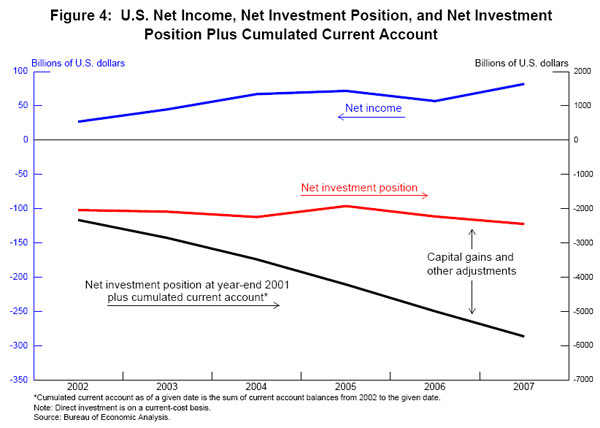
The first puzzle is longstanding and is well known within the international finance community: Why does it appear that foreigners pay to lend to the United States? For more than 20 years, the U.S. net international investment position has been negative. As I just mentioned, in 2007 the net liability position of the United States was 17 percent of GDP. (See figure 4.) Nonetheless, and somewhat surprisingly, the income received by U.S. residents on their foreign investments has consistently exceeded that received by foreigners on their holdings in the United States. This difference totaled $90 billion in 2007. So, at first blush, it might appear that the rest of the world pays the United States for the privilege of lending to it. Put differently, imagine a credit card that paid you interest to carry a debt balance, instead of the other way around. Sign me up!
This U.S. investment income puzzle has piqued the interest of some well-known economists. For example, in 1987, Milton Friedman wrote:
Clearly, if our investments abroad are yielding a positive return, their capital value must be positive not negative. Is this a defect of the figures on current flows, or is it a defect of the balance-sheet figures?2
Friedman's question suggests that the reported data must either be wrong or be missing some important component. Following this reasoning, some researchers have inferred the existence of unrecorded U.S. claims based on the observation of positive net investment income. Such unrecorded claims are sometimes called “dark matter. The term is borrowed from physics; dark matter cannot be seen, but its presence can be inferred from its effects on visible matter. These researchers suggest that unobserved assets, particularly intellectual property, are so large that the true claims position substantially exceeds the $20 trillion in U.S. liabilities to foreigners.
A careful look at the data, however, reveals that while unrecorded intellectual property may make a modest contribution to U.S. claims, there is no evidence of large-scale mismeasurement on the order of magnitude claimed by proponents of the “dark matter” theory. In fact, Federal Reserve staff research suggests just the opposite--that is, if anything, the true U.S. net investment position is slightly more negative than the published data show.
How then can we resolve this puzzle? The answer lies in the returns, composition, and size of U.S. claims and liabilities. As I mentioned earlier, for most cross-border assets, including debt and equity, the income component of the return paid on U.S. liabilities is roughly equal to that received on claims. The return received on U.S. direct investment claims on the rest of the world, however, is much larger than that paid by the United States on its direct investment liabilities to the rest of the world or on any other asset. Additionally, direct investment is a greater share of U.S. claims than it is of U.S. liabilities. With this combination of return and compositional differences, U.S. claims in total earn about one percentage point per year more than the United States pays on its liabilities.
This rate of return differential does not, by itself, lead to positive net income on a negative net position: If the U.S. net liability position of $2.5 trillion were the result of more modest gross positions, then U.S. net income might not be positive. The enormous gross positions magnify the impact of the different rates of returns on claims and liabilities, so, on net, income receipts are positive. Because of this leverage effect, it is not particularly informative to compare the net position to net income or to compute a rate of return on the net position. Ultimately, this is why the “dark matter” argument fails, because it relies on the negative net position to infer the existence of missing assets.
The United States is not unique in this regard. In several other countries, including the United Kingdom, net investment income is positive despite a large net liability position. And, as in the United States, a difference in the rate of return on direct investment claims and liabilities is largely responsible.
Taken together, these observations go a long way toward resolving the apparent puzzle: Positive net investment income receipts in the face of a net liability in the investment position can be explained by differences between the composition of U.S. claims and liabilities and between the corresponding rates of return, magnified by the leverage effect of the enormous gross positions.
The remaining question is, what accounts for the high return on U.S. direct investment claims? This high return may in part reflect a risk premium associated with investments in emerging economies. Tax policy may also play a role--some analysts have suggested that multinational entities are shifting intangible assets such as intellectual property to countries with more-favorable tax laws in order to reduce their overall tax burden. However, given the magnitudes involved, it seems unlikely that unrecorded intangible assets could account for a substantial part of the return differential. The topic remains the subject of ongoing research.
Puzzle 2: Can the United States Borrow without Increasing its Debt?
The second puzzle has emerged more recently: Why does it seem that the United States can borrow without a corresponding increase in its debt? As is well known, the United States has been running large current account deficits for many years. Financing these deficits has required substantial borrowing from abroad. However, the net increase in U.S. liabilities has been quite small relative to the cumulated current account deficits.
To be more specific, over the past six years, the United States has run current account deficits that add up to over $3.8 trillion, and these deficits have required an equivalent amount of financing from the foreign sector. One might have expected this borrowing to have led to equally sizable increases in the U.S. external debt, but this has not been the case. Over the same period, U.S. net liabilities increased by only $600 billion, which is $3.2 trillion less than the cumulated current account deficits.3 (See figure 4.) So it might seem that the United States has been able to borrow large amounts from abroad while accumulating few additional liabilities. Returning to the credit card analogy, imagine a charge card with a balance that increases by only a small fraction of your charges. No bank would issue such a card; how could a country do effectively the same thing?
Unlike a credit card balance, however, changes in the U.S. net external debt balance reflect more than just net transactions. There are also changes to the net position owing to capital gains and other adjustments to the values of claims and liabilities. As I mentioned, over the past six years, the net position has diverged from the cumulated current account by about $3.2 trillion, which represents capital gains and other adjustments. About $2.4 trillion of this divergence is due to valuation adjustments (capital gains) favoring U.S. claims; these adjustments arise from observed movements in asset prices and the dollar. An additional $800 billion is labeled “other adjustments” by the agency that maintains and publishes the international transactions accounts in the United States, the Bureau of Economic Analysis (BEA).
Some researchers have interpreted these “other adjustments” as additional capital gains. These adjustments significantly favor U.S. claims, and including them in capital gains doubles the total return advantage in favor of U.S. claims from the published estimate of about 2 percentage points per year to 4 percentage points per year. Borrowing a phrase popularized by Charles de Gaulle, these researchers suggest that this return differential constitutes an “exorbitant privilege” enjoyed by the United States. However, Federal Reserve staff have used survey data for the underlying cross-border positions to show that these “other adjustments” are not hidden capital gains but instead arise from imprecision in the measurement of a number of balance of payments flows and cross-border positions. As such, the returns advantage in favor of U.S. investments is, in fact, half the size claimed by proponents of “exorbitant privilege” and is well in line with the BEA's published data.
As with the first, the key to resolving the second puzzle lies in differences in portfolio returns, composition, and size. Most U.S. liabilities are debt securities, which realize small capital gains, while a large fraction of U.S. claims on the rest of the world are equity securities, which realize much larger capital gains. The result is a net difference in the capital gains rate slightly in favor of U.S. investors. When this rate differential is applied to the enormous gross claims and liabilities positions, however, it generates a sizable adjustment to the net investment position.
As also was the case with the first puzzle, the United States is not unique in regard to this second puzzle. For several other countries, including the United Kingdom, Canada, Australia, and New Zealand, the international investment positions have for extended periods diverged from the value suggested by historical current account balances, in a manner similar to that of the United States. The divergence can go the other way as well--Switzerland and Japan currently report net investment positions substantially less positive than those suggested by their persistent current account surpluses.
Conclusions
Our experience since the beginning of the recent financial turmoil strongly suggests that the global economy is bound together by strong trade and financial linkages, and through them the United States remains closely coupled to the global economy. The United States thus faces economic “realities” similar to those of the advanced and emerging market economies. These linkages provide powerful connections or “couplings” among economies and can contribute importantly to the efficient operation of global markets.
The nature and extent of financial linkages between economies both depend on several characteristics of cross-border investment, including the size and composition of the underlying gross positions, as well as the performance of the underlying assets. Two apparent puzzles concerning these international linkages--the apparent willingness of foreigners to pay to lend to the United States and the apparent ability of the United States to borrow without a corresponding increase in its debt--can be explained by careful analyses of these data, without resorting to theories such as “dark matter” or “exorbitant privilege. In the end, the economic realities faced by the United States are not so different from those faced by the rest of the world.
References
Curcuru, Stephanie E., Tomas Dvorak, and Francis E. Warnock (forthcoming). “Cross-Border Returns Differentials,” Quarterly Journal of Economics.
Curcuru, Stephanie E., Charles P. Thomas, and Francis E. Warnock (forthcoming). “Current Account Sustainability and Relative Reliability,” NBER International Seminar on Macroeconomics.
Hausmann, Ricardo, and Federico Sturzenegger (2007). “The Missing Dark Matter in the Wealth of Nations, and Its Implications for Global Imbalances,” Economic Policy, vol. 22, pp. 469-518.
Gourinchas, Pierre-Olivier, and Helene Rey (2007). “From World Banker to World Venture Capitalist: The U.S. External Adjustment and the Exorbitant Privilege,” in R. Clarida (ed.), G7 Current Account Imbalances: Sustainability and Adjustment. Chicago: University of Chicago Press, pp. 11-55.
Footnotes
1. We include bonds, loans, and deposits with debt instruments. Return to text
2. Letter to Charles Thomas of the Federal Reserve Board staff. Return to text
3. U.S. Bureau of Economic Analysis. Current accounts for 2002 to 2007, inclusive. Positions compare year-end 2001 to year-end 2007. Return to text