February 11, 2013
A Painfully Slow Recovery for America's Workers: Causes, Implications, and the Federal Reserve's Response
Vice Chair Janet L. Yellen
At the "A Trans-Atlantic Agenda for Shared Prosperity" conference sponsored by the AFL-CIO, Friedrich Ebert Stiftung, and the IMK Macroeconomic Policy Institute, Washington, D.C.
Thank you for the opportunity to speak to you today about the Federal Reserve's efforts to strengthen the recovery and pursue a goal that it shares with the labor movement: maximum employment.1
As an objective of public policy, maximum employment doesn't appear in the U.S. Constitution, in any presidential decree, or even in the mission statement of the Labor Department. A law passed in 1946 made it a general goal for the U.S. government, but so far the Federal Reserve is the only agency assigned the job of pursuing maximum employment. The 1977 law spelling out that responsibility also assigned the goal of stable prices, and we call this combination of objectives the Federal Reserve's dual mandate.2
With so many people today unable to find work, it might seem odd to highlight such an ambitious and distant goal for employment. I do so because the gulf between maximum employment and the very difficult conditions workers face today helps explain the urgency behind the Federal Reserve's ongoing efforts to strengthen the recovery. My colleagues and I are acutely aware of how much workers have lost in the past five years. In response, we have taken, and are continuing to take, forceful action to increase the pace of economic growth and job creation.
In the three years after the Great Recession ended, growth in real gross domestic product (GDP) averaged only 2.2 percent per year. In the same span of time following the previous 10 U.S. recessions, real GDP grew, on average, more than twice as fast--at a 4.6 percent annual rate.3 So, why has the economy's recovery from the Great Recession been so weak?
The slow recovery was preceded, of course, by the deepest recession since the end of the Second World War. The bursting of an unprecedented housing bubble, together with the financial crisis that followed, dealt a huge blow to demand. These developments robbed homeowners of wealth built over a generation, impaired their access to credit, decimated retirement savings, and shattered the confidence of consumers. Businesses slashed capital spending and payrolls, and real GDP contracted by 4.7 percent, more than twice the average for the 10 other recessions since World War II. The Great Recession was also the longest postwar recession--it lasted 18 months, compared with an average of 10 months for the others.
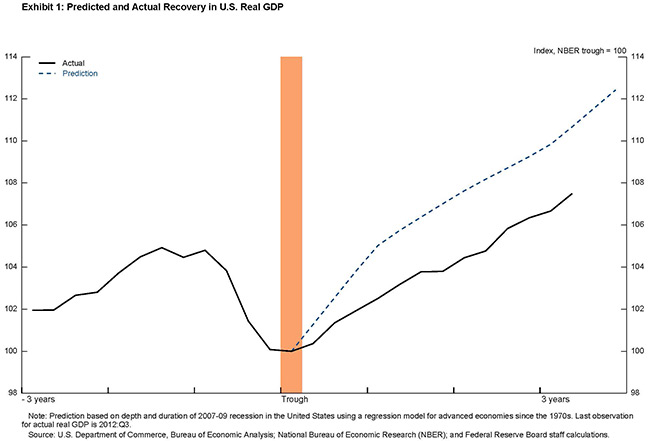
The experience of the United States and other advanced economies suggests that deeper recessions are usually followed by stronger-than-average recoveries. While it's also true that longer recessions tend to result in weaker recoveries, even after accounting for this factor, this recovery has been significantly weaker than past experience would have predicted.
The dashed line in exhibit 1 shows how real GDP would have been expected to increase in this recovery, based on the experience of the United States and other advanced economies and given the depth and duration of the Great Recession.4 The gap between the actual and the predicted path of real output gives a sense of how much economic performance has lagged in this recovery. But the implications of this result may seem a little abstract, so let me illustrate the same idea in a way that tries to show the burden that workers continue to bear in this slow recovery.
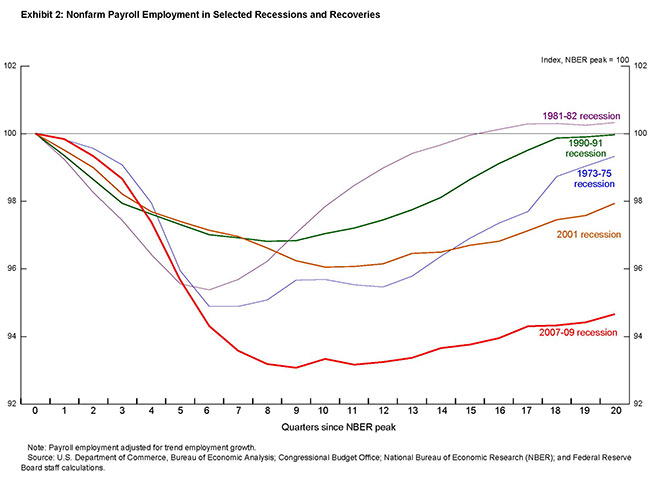
Exhibit 2 shows how employment has declined and recovered following several previous recessions. The employment measure attempts to control for the fact that demographic changes and other factors have altered the trend, or potential, workforce over the years. For example, in the 1970s, the pool of potential workers was expanding as baby boomers and an increasing share of women moved into the labor force, such that employment needed to rise relatively quickly just to absorb these additional workers. More recently, the aging of the population has put downward pressure on labor force participation, so employment hasn't had to grow as quickly to keep pace with the potential workforce.
Even after making this adjustment, however, the Great Recession stands out both for the magnitude of the job losses that attended the downturn and for the weak recovery in employment that occurred after the recession ended.
In trying to account for why this recovery has been so weak, it is helpful to first consider several important factors that have in the past supported most economic recoveries. By this I don't mean everything that contributes to economic growth, but rather those things that typically play a key role when the U.S. economy is recovering from recession. Think of these as the tailwinds that usually promote a recovery.
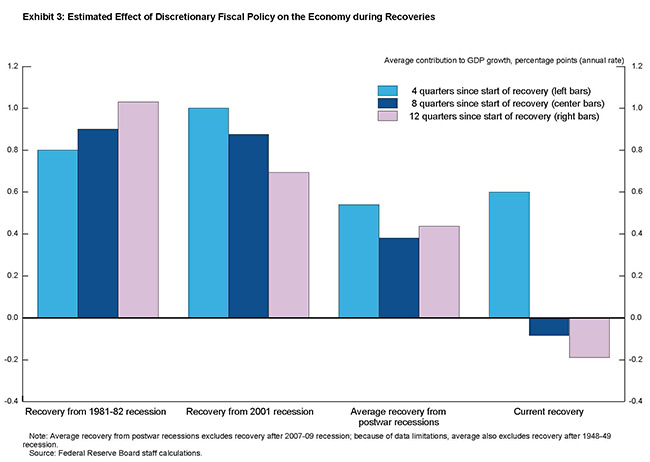
The first tailwind I'll mention is fiscal policy. History shows that fiscal policy often helps to support an economic recovery. Some of this fiscal stimulus is automatic, and intended to be. The income loss that individuals and businesses suffer in a recession is partly offset when their tax bills fall as well. Government spending on unemployment benefits and other safety-net programs rises in recessions, helping individuals hurt by the downturn and also supporting consumer spending and the broader economy by replacing lost income. These automatic declines in tax collections and increases in government spending are often supplemented with discretionary fiscal action--tax rate cuts, spending on infrastructure and other goods and services, and extended unemployment benefits. These discretionary fiscal policy actions are typically a plus for growth in the years just after a recession. For example, following the severe 1981-82 recession, discretionary fiscal policy contributed an average of about 1 percentage point per year to real GDP growth over the subsequent three years.5
However, discretionary fiscal policy hasn't been much of a tailwind during this recovery. In the year following the end of the recession, discretionary fiscal policy at the federal, state, and local levels boosted growth at roughly the same pace as in past recoveries, as exhibit 3 indicates. But instead of contributing to growth thereafter, discretionary fiscal policy this time has actually acted to restrain the recovery. State and local governments were cutting spending and, in some cases, raising taxes for much of this period to deal with revenue shortfalls. At the federal level, policymakers have reduced purchases of goods and services, allowed stimulus-related spending to decline, and have put in place further policy actions to reduce deficits. I was relieved that the Congress and the Administration were able to reach agreement on avoiding the full force of the "fiscal cliff" that was due to take effect on January 1. While a long-term plan is needed to reduce deficits and slow the growth of federal debt, the tax increases and spending cuts that would have occurred last month, absent action by the Congress and the President, likely would have been a headwind strong enough to blow the United States back into recession. Negotiations continue over the extent of spending cuts now due to take effect beginning in March, and I expect that discretionary fiscal policy will continue to be a headwind for the recovery for some time, instead of the tailwind it has been in the past.
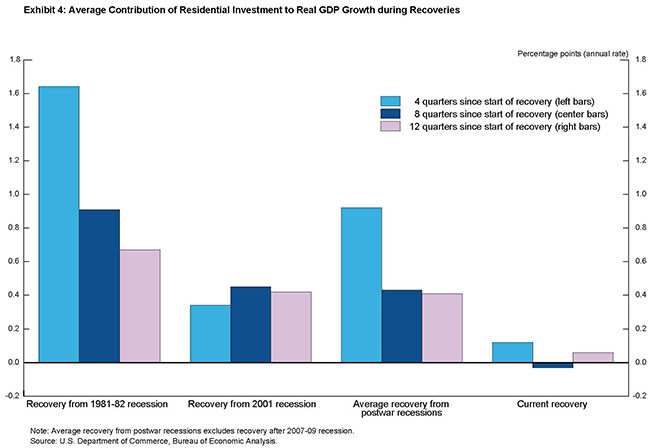
A second tailwind in most recoveries is housing. Residential investment creates jobs in construction and related industries. Before the Great Recession, housing investment added an average of 1/2 percentage point to real GDP growth in the two years after each of the previous four recessions, considerably more than its contribution to growth at other times.6
During this recovery, in contrast, residential investment, on net, has contributed very little to growth since the recession ended. The reasons are easy to understand, given the central role that housing played in the Great Recession. Following an extended boom in construction driven in large part by overly loose mortgage lending standards and unrealistic expectations for future home price increases, the housing market collapsed--sales and prices plunged and mortgage credit was sharply curtailed. Tight mortgage credit conditions are continuing to make it difficult for many families to buy homes, despite record-low mortgage interest rates that have helped make housing very affordable. I'm encouraged by recent improvement in the residential sector, but the contribution of housing investment to overall economic activity remains considerably below the average seen in past recoveries, as exhibit 4 shows.
Beyond the direct effects on residential investment, the extraordinary collapse in house prices resulted in a huge loss of household wealth--at last count, net home equity is still down 40 percent, or about $5 trillion, from 2005.7 This loss of wealth has weighed on the finances and spending of many homeowners. Households are less able to tap their home equity to deal with economic shocks, fund their children's education, or start new businesses. For some households, the collapse in house prices has left them underwater on their mortgages, and thus less able to refinance or sell their homes.
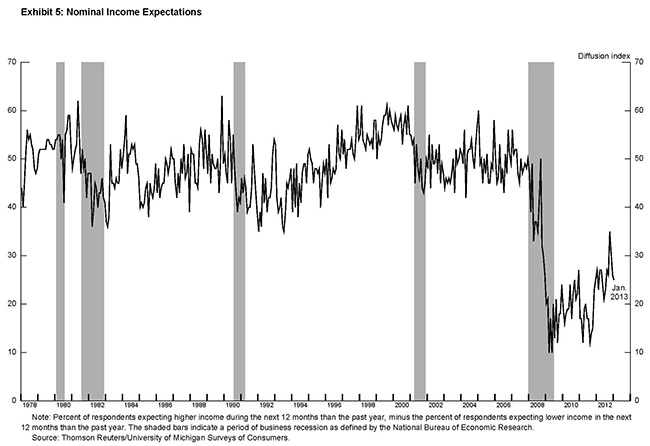
Another important tailwind in most economic recoveries is one that tends to be taken for granted--the faith most of us have, based on history and personal experience, that recessions are temporary and that the economy will soon get back to normal. Even during recessions, households' expectations for income growth tend to be reasonably stable, which provides support for overall spending. In the most recent recession, however, surveys suggest that consumers sharply revised down their prospects for future income growth and have only partially adjusted up their expectations since then (exhibit 5).
The recovery has also encountered some unusual headwinds. The fiscal and financial crisis in Europe has resulted in a euro-area recession and contributed to slower global growth. Europe's difficulties have blunted what had been strong growth in U.S. exports earlier in the recovery by sapping demand worldwide.
Let me say a few words now, and more later, about the role of monetary policy in this recovery. The Federal Reserve typically plays a large role in promoting recoveries by reducing the federal funds rate and keeping it low until the economy is again on a solid footing. Reducing the federal funds rate tends to reduce other interest rates and boost asset prices, thus encouraging spending and investment throughout the economy.
As it has before, the Federal Open Market Committee (FOMC) in 2007 started reducing the federal funds rate at the first signs of economic weakness and made sharper rate cuts as the recession deepened. As in some past recoveries that were disappointingly slow, the FOMC has kept rates low well after the end of the recession.
But unlike the past, by December 2008 the Committee had reduced the federal funds rate effectively to zero. Because that rate, for practical purposes, cannot be cut further, this level is referred to as the effective lower bound. Without the option of using its conventional policy tool, and with the recession getting worse, the FOMC decided to employ unconventional tools to further ease monetary policy, even though the efficacy of these tools was uncertain and it was recognized that their use might carry some potential costs. The better known of these tools is the purchase of large amounts of longer-term government securities, which is commonly referred to as quantitative easing. The other unconventional tool is known as forward guidance--providing information about the future path of short-term interest rates anticipated by the Committee. Both of these approaches are intended to address a gap caused by the effective lower bound. This gap is the shortfall between what the FOMC likely would do in current economic circumstances, were it able to reduce the federal funds rate below zero, and the reality that the rate can't be cut further.
I believe that the Federal Reserve's asset purchases and other unconventional policy actions have helped, and are continuing to help, fill this gap and thus shore up aggregate demand. The evidence suggests that the FOMC's actions have lowered short- and longer-term private borrowing rates and boosted asset prices.8 However, while this contribution has been significant, lower interest rates may be doing less to increase spending than in past recoveries because of some unusual features of the Great Recession and the current recovery. For example, as I noted, the housing crisis left many homeowners with high loan-to-value ratios and damaged credit records, creating barriers to their access to credit, while the financial crisis led many banks to lend only to borrowers with higher credit scores. As a consequence, the proportion of households that have been able to take advantage of declining rates to refinance their mortgages or to borrow to purchase new homes has probably been lower than in past recoveries. In addition, pronounced uncertainty about economic conditions has weighed on capital spending decisions and may have blunted the normal effect of lower interest rates on business investment.
These are the major reasons why I believe this recovery has been so slow. After a lengthy recession that imposed great hardships on American workers, the weak recovery has made the past five years the toughest that many of today's workers have ever experienced.
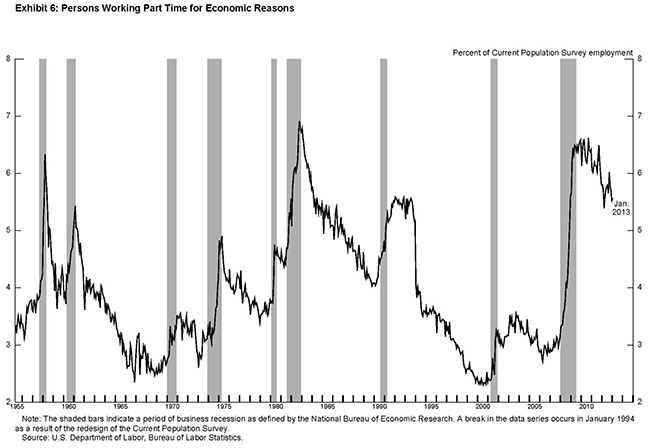
The unemployment rate now stands at 7.9 percent. To put this number in perspective, while that's a big improvement from the 10 percent reached in late 2009, it is now higher than unemployment ever got in the 24 years before the Great Recession. Moreover, the government's current estimate of 12 million unemployed doesn't include 800,000 discouraged workers who say they have given up looking for work. And, as exhibit 6 shows, 8 million people, or 5.6 percent of the workforce, say they are working part time even though they would prefer a full-time job. A broader measure of underemployment that includes these and other potential workers stands at 14.4 percent.
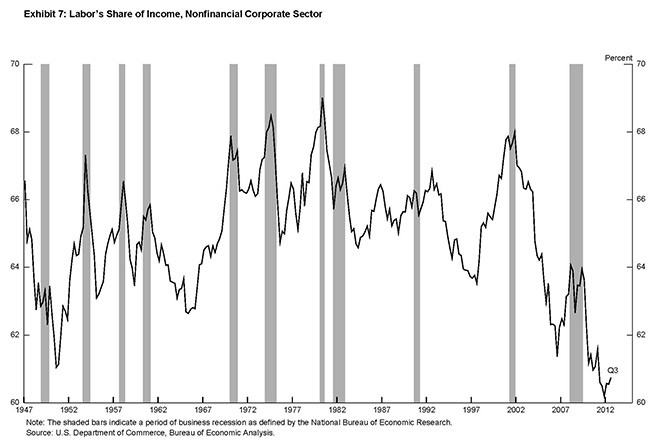
The effects of the recession and the subsequent slow recovery have been harshest on some of the most vulnerable Americans. The poverty rate has risen sharply since the onset of the recession, after a decade in which it had been relatively stable, and stands at 15 percent of the population, significantly above the average of the past three decades.9 Even those today who are fortunate enough to hold jobs have seen their hourly compensation barely keep pace with the cost of living over the past three years, while labor's share of income--as measured by the percent of production by nonfinancial corporations accruing to workers as compensation--remains near the postwar low reached in 2011 (exhibit 7). Compared with the 7.9 percent unemployment rate for all workers, the unemployment rate for African Americans is 13.8 percent. The unemployment rate for those without a high school diploma is 12 percent. For young people--workers 16 to 19 years old--the unemployment rate is 23.4 percent, little changed from the end of the recession. Among African Americans in that age group, 38 percent of those in the labor force can't find a job.
Another gauge of the effect that this slow recovery has had on workers is how long it is taking to find a job. At its worst point in the 1980s, the median length of unemployment for those looking for a job was 12 weeks, but the median since the Great Recession has averaged 20 weeks and now stands at 16 weeks. Three million Americans have been looking for work for one year or more; that's one-fourth of all unemployed workers, which is down from 2011's peak but far larger than was seen before the Great Recession.
These are not just statistics to me. We know that long-term unemployment is devastating to workers and their families. Longer spells of unemployment raise the risk of homelessness and have been a factor contributing to the foreclosure crisis. When you're unemployed for six months or a year, it is hard to qualify for a lease, so even the option of relocating to find a job is often off the table. The toll is simply terrible on the mental and physical health of workers, on their marriages, and on their children.10
Long-term unemployment is also a great concern because it has the potential to itself become a headwind restraining the economy. Individuals out of work for an extended period can become less employable as they lose the specific skills acquired in their previous jobs and also lose the habits needed to hold down any job. Those out of work for a long time also tend to lose touch with former co‑workers in their previous industry or occupation--contacts that can often help an unemployed worker find a job. Long-term unemployment can make any worker progressively less employable, even after the economy strengthens.
A factor contributing to the high level of long-term unemployment in the current recovery is the relatively large proportion of workers who have permanently lost their previous jobs, as opposed to being laid off temporarily. For example, in past recessions, a considerable share of jobs lost in construction has been temporary, but that isn't the case this time. Construction employment fell from its peak of 7.7 million in 2006 to a low of 5.4 million in 2011. Only about 300,000 of those 2.3 million jobs have returned and most won't, at least for many years.
In general, individuals who permanently lose their previous jobs take longer to become reemployed than do those on temporary layoff, are more likely to have to change industries or occupations to find a new job, and earn significantly less when they become reemployed.11
The greater amount of permanent job loss seen in the recent recession also suggests that there might have been an increase in the degree of mismatch between the skills possessed by the unemployed and those demanded by employers. This possibility and the unprecedented level and persistence of long-term unemployment in this recovery have prompted some to ask whether a significant share of unemployment since the recession is due to structural problems in labor markets and not simply a cyclical shortfall in aggregate demand. This question is important for anyone committed to the goal of maximum employment, because it implicitly asks whether the best we can hope for, even in a healthy economy, is an unemployment rate significantly higher than what has been achieved in the past.
For the Federal Reserve, the answer to this question has important implications for monetary policy. If the current, elevated rate of unemployment is largely cyclical, then the straightforward solution is to take action to raise aggregate demand. If unemployment is instead substantially structural, some worry that attempts to raise aggregate demand will have little effect on unemployment and serve only to stoke inflation.
This question is frequently discussed by the FOMC.12 I cannot speak for the Committee or my colleagues, some of whom have publicly related their own conclusions on this topic. However, I see the evidence as consistent with the view that the increase in unemployment since the onset of the Great Recession has been largely cyclical and not structural.
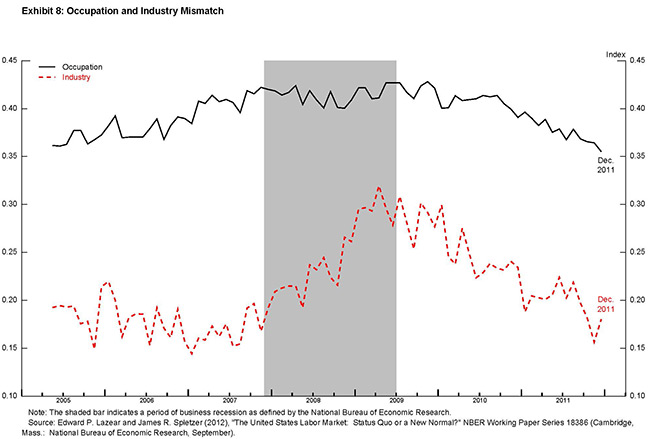
For example, the rise in unemployment during the recession was accompanied by a dramatic decline in job vacancies and was widespread across industry and occupation groups. Job losses in the construction and financial services industries were particularly large--hardly surprising given the collapse in these sectors in 2008 and 2009--but manufacturing and other cyclically sensitive industries were hit hard as well, and employment in these industries has likewise recovered slowly. Moreover, if skills mismatch in the labor market has led to an excess supply of workers in some sectors and a shortage of workers in others, then we would expect to see an atypical amount of variation in the balance between job openings and unemployment across sectors. Based on this insight, researchers Ed Lazear and Jim Spletzer constructed quantitative measures of mismatch across industries and occupations.13 They found that their mismatch indexes were indeed elevated at the end of the Great Recession, as exhibit 8 shows. But these measures have fallen over the course of the recovery to near pre-recession levels. In addition, widespread mismatch between job vacancies and workers across different sectors might be expected to cause wage rates to rise relatively quickly in sectors with many job openings and relatively slowly in sectors with an excess supply of available workers. But work by Jesse Rothstein fails to uncover evidence of such a pattern.14
This and related research suggests to me, first, that a broad-based cyclical shortage of demand is the main cause of today's elevated unemployment rate, and, second, that whatever problems there may be today with labor market functioning are likely to be substantially resolved as the broader economy improves and bolsters the demand for labor.
I don't mean to suggest that there aren't some workers who have been stranded by structural changes in the economy. More can and should be done to help dislocated workers acquire new skills to transition from industries and occupations with fewer opportunities. But making this transition will be much easier in a healthy economy, which is one reason why I am encouraged by the evidence that elevated unemployment is indeed largely cyclical. I will now describe what the Federal Reserve is doing to try to raise demand and create jobs.
I have described the two unconventional policy tools that the FOMC has employed since it reduced the target federal funds rate in 2008 to its effective lower bound. The first is large-scale asset purchases, intended to lower long-term interest rates to encourage borrowing for spending and investment. Between 2008 and mid-2011, the FOMC purchased agency-guaranteed mortgage-backed securities (MBS), agency debt, and Treasury securities totaling $2.3 trillion. In 2011, the FOMC began the maturity extension program, under which it reduced its holdings of short-term Treasury securities and used the proceeds to purchase an equivalent amount of longer-term Treasury securities.
However, as the scheduled endpoint of that program approached, it became clear that the economy remained weak, and the FOMC took a series of steps to provide further impetus to the recovery. In June 2012, the Committee extended its maturity extension program until the end of the year. Then in September, it made a major new commitment to asset purchases. Unlike its past purchase programs, which were fixed in size, this time the FOMC stated its determination to continue the program, provided that inflation remains well contained, until it judges that there has been a substantial improvement in the outlook for the labor market. The Committee currently intends to purchase MBS and Treasury debt at a pace that will add about $85 billion per month of such securities to the Federal Reserve's balance sheet. In determining the size, pace, and composition of these purchases over time, the Committee will also take into account ongoing assessments of their efficacy and costs.
The second unconventional policy tool that the FOMC has used is forward guidance, in the form of more-explicit and more-detailed information about the future path of monetary policy. The longer-term interest rates that most profoundly influence housing demand, capital spending, and asset prices depend on current and expected future levels of short-term interest rates, such as the federal funds rate that has been the Fed's conventional monetary policy tool. Signaling the future path of the federal funds rate can therefore directly affect interest rates today on auto loans, home mortgages, and bonds issued by companies and state and local governments, even when the current level of the federal funds rate cannot be lowered.
The FOMC has substantially expanded its forward guidance in recent years. In 2009, the Committee stated that economic conditions "are likely to warrant exceptionally low levels of the federal funds rate for an extended period."15 In 2011, the FOMC said this period would likely last "at least through mid-2013," and extended this date guidance several times.16
A disadvantage of this calendar-based approach was that it might not be clear whether changes in the date reflect changes in the FOMC's outlook for growth, for inflation, or a shift in the desired stance of policy. In December 2012, the FOMC therefore replaced the date with greater detail on the economic conditions that would warrant maintaining the federal funds rate at its present, exceptionally low level. Specifically, it stated that near-zero rates would likely remain appropriate for a considerable time after the asset purchase program ends and "at least as long as the unemployment rate remains above 6-1/2 percent, inflation between one and two years ahead is projected to be no more than a half percentage point above the Committee's 2 percent longer-run goal, and longer-term inflation expectations continue to be well anchored."17
It deserves emphasis that a 6-1/2 percent unemployment rate and inflation one to two years ahead that is 1/2 percentage point above the Committee's 2 percent objective are thresholds for possible action, not triggers that will necessarily prompt an immediate increase in the FOMC's target rate. In practical terms, it means that the Committee does not expect to raise the federal funds rate as long as unemployment remains above 6‑1/2 percent and inflation one to two years ahead is projected to be less than 1/2 percentage point above its 2 percent objective. When one of these thresholds is crossed, action is possible but not assured.
Moreover, these thresholds for possible action do not reflect any change in the Committee's longer-run goals. With respect to maximum employment, most FOMC participants continue to estimate that the longer-run normal unemployment rate lies in a range of 5.2 to 6 percent, and the Committee continues to believe an inflation rate of 2 percent (as measured by the annual change in the price index for personal consumption expenditures) is most consistent with the Federal Reserve's dual mandate. Indeed, the Committee reaffirmed these longer-run goals, first adopted in January 2012, just last month.18 Of course, our control over the economy is imperfect, and so temporary deviations from the FOMC's specific longer-term goals will sometimes occur. Importantly, these quantitative goals are neither ceilings nor floors for inflation and unemployment, and the Committee will take a balanced approach to returning both measures to their objectives over time.
I believe the policy steps we have taken recently are in accord with this balanced approach. With employment so far from its maximum level and with inflation currently running, and expected to continue to run, at or below the Committee's 2 percent longer-term objective, it is entirely appropriate for progress in attaining maximum employment to take center stage in determining the Committee's policy stance.
While the Committee's longer-term goals remain unchanged, what has changed is that the FOMC is now providing more information about how it expects to pursue its inflation and employment goals. In particular, we will employ our policy tools, as appropriate, to raise aggregate demand and employment in the context of continued price stability, consistent with our balanced approach. That's good news for workers, because I believe that these steps will increase demand, and more demand means more jobs.
It will be a long road back to a healthy job market. It will be years before many workers feel like they have regained the ground lost since 2007. Longer-term trends, such as globalization and technological change, will continue to pose challenges to workers in many industries.
Let me close with some words of encouragement. The job market is improving. The progress has been too slow, but there is progress. My colleagues and I at the Federal Reserve are well aware of the difficulties faced by workers in this slow recovery, and we're actively engaged in continuing efforts to promote a stronger economy, more jobs, and better conditions for all workers.
Thank you for the opportunity to speak to you today.
1. The views expressed here are my own and not necessarily those of my colleagues in the Federal Reserve System. I am indebted to members of the Board staff--John Maggs, Karen Pence, Jeremy Rudd, and William Wascher--who contributed to the preparation of these remarks, and to Board staff members Sejla Karalic and Christopher Nekarda for assistance with the exhibits. Return to text
2. The law calls on the Federal Reserve to "promote effectively the goals of maximum employment, stable prices, and moderate long-term interest rates." See section 2A of the Federal Reserve Act (12 U.S.C. §225a as added by act of Nov. 16, 1977 (91 Stat. 1387) and amended by acts of Oct. 27, 1978 (92 Stat. 1897); Aug. 23, 1988 (102 Stat. 1375); and Dec. 27, 2000 (114 Stat. 3028)). Return to text
3. The average for other postwar recoveries would be even higher if one were to exclude the three-year periods following the 1957-58 and 1980 recessions, which included at least part of subsequent recessions. Return to text
4. The results in the figure are derived from a model that relates GDP growth in recoveries to recession depth and duration. See Greg Howard, Robert Martin, and Beth Anne Wilson (2011), "Are Recoveries from Banking and Financial Crises Really So Different?" International Finance Discussion Papers 1037 (Washington: Board of Governors of the Federal Reserve System, November). Return to text
5. These calculations are based on Federal Reserve Board estimates of fiscal impetus, which measures the boost to aggregate demand from increased government purchases as well as the effects of changes in tax and entitlement policies on consumer and business spending. See Glenn Follette and Byron Lutz (2010), "Fiscal Policy in the United States: Automatic Stabilizers, Discretionary Fiscal Policy Actions, and the Economy," Finance and Economics Discussion Series 2010-43 (Washington: Board of Governors of the Federal Reserve System, June). Return to text
6. See Michael W. McCracken (2011), "Housing's Role in a Recovery (PDF) ," Federal Reserve Bank of St. Louis, Economic Synopses, no. 6 (February), pp. 1-2. Return to text
7. See Board of Governors of the Federal Reserve System, Statistical Release Z.1, "Flow of Funds Accounts of the United States," table B.100, line 49 (Owners' Equity in Household Real Estate). Return to text
8. See Ben S. Bernanke (2012), "Monetary Policy since the Onset of the Crisis," speech delivered at "The Changing Policy Landscape," a symposium sponsored by the Federal Reserve Bank of Kansas City, held in Jackson Hole, Wyo., August 30-September 1. Return to text
9. Mean annual poverty rate for all people, U.S. Bureau of the Census. Return to text
10. See Steven J. Davis and Till Von Wachter (2011), "Recessions and the Costs of Job Loss," Brookings Papers on Economic Activity, Fall, pp.1-72. Return to text
11. See Louis S. Jacobson, Robert J. LaLonde, and Daniel G. Sullivan (1993), "Earnings Losses of Displaced Workers," American Economic Review, vol. 83 (September), pp. 685-709. Return to text
12. See, for example, the minutes of several recent FOMC meetings held on December 11-12, 2012; September 12-13, 2012; and July 31-August 1, 2012: Board of Governors of the Federal Reserve System (2013), "Minutes of the Federal Open Market Committee, December 11-12, 2012," press release, January 3; Board of Governors of the Federal Reserve System (2012), "Minutes of the Federal Open Market Committee, September 12-13, 2012," press release, October 4; and Board of Governors of the Federal Reserve System (2012), "Minutes of the Federal Open Market Committee, July31-August 1, 2012," press release, August 22. Return to text
13. See Edward P. Lazear and James R. Spletzer (2012), "The United States Labor Market: Status Quo or a New Normal?" NBER Working Paper Series 18386 (Cambridge, Mass.: National Bureau of Economic Research, September). See also Ayșegül Șahin, Joseph Song, Giorgio Topa, and Giovanni L. Violante (2012), "Mismatch Unemployment," NBER Working Paper Series 18265 (Cambridge, Mass.: National Bureau of Economic Research, August). Return to text
14. See Jesse Rothstein (2012), "The Labor Market Four Years into the Crisis: Assessing Structural Explanations," Industrial and Labor Relations Review, vol. 65 (July), pp. 467-500. Return to text
15. For example, see Board of Governors of the Federal Reserve System (2009), "FOMC Statement," press release, March 18. Return to text
16. For example, see Board of Governors of the Federal Reserve System (2011), "FOMC Statement," press release, August 9. Return to text
17. See Board of Governors of the Federal Reserve System (2012), "FOMC Statement," press release, December 12. Return to text
18. The FOMC's Statement on Longer-Run Goals and Monetary Policy Strategy (PDF), as amended effective on January 29, 2013, is available on the Board's website. Return to text