Additional Data Concerning the Proposed Methodology for Determining the Base Component of the Interchange Fee Cap
Background
On November 14, 2023, the Board published in the Federal Register a proposal that would (1) update all three components of Regulation II’s interchange fee cap based on the latest data reported to the Board by large debit card issuers, (2) update the interchange fee cap every other year going forward by directly linking the interchange fee cap to data from the Board’s biennial survey of large debit card issuers, and (3) implement a set of technical revisions to the regulation.1
As described in the Federal Register notice, the Board proposes a new methodology for determining the base component of the interchange fee cap. The additional data on this page are being published to assist the public in commenting on the proposed new base component methodology.
The additional data on this page do not pertain to the remaining two of the three components of the interchange fee cap: the ad valorem component and the fraud-prevention adjustment component. The Board proposes to use generally the same methodologies used in the original rulemaking to determine these components.
The data below are based on cost and transaction volume information that covered issuers are required to report to the Board through the Debit Card Issuer Survey. The Board regards the individual organization information provided by each covered issuer on the Debit Card Issuer Survey as confidential (5 U.S.C. § 552(b)(4)). However, aggregate or summary information may be published in a way that does not reveal an individual organization’s confidential information.
Overview of proposed base component methodology
Under the proposal, and as described further in the Federal Register notice, the base component would be the product of the transaction-weighted average of per-transaction base component costs across covered issuers and a fixed multiplier, rounded to the nearest 10th of one cent.3 The fixed multiplier would correspond to a target selected by the Board for a reasonable percentage of covered issuer transactions for which covered issuers should fully recover their base component costs over time, consistent with the Durbin Amendment. The Board proposes a fixed multiplier of 3.7, which targets full-cost recovery for 98.5 percent of covered issuer transactions over time.
As stated in the Federal Register notice, it is possible to derive this formula due to consistent patterns that the Board has observed in the data reported by covered issuers related to per-transaction base component costs since 2009. Specifically, while the transaction-weighted average of per-transaction base component costs across covered issuers has declined significantly since the original Regulation II rulemaking, the shape of the distribution of per-transaction costs across covered issuer transactions has not changed markedly between the data collections.4 This particular shape can be well-characterized by a probability distribution—the Weibull distribution—with a key property: the value of per-transaction base component costs at a target percentile across covered issuer transactions is a multiple of the transaction-weighted average of per-transaction base component costs across covered issuers. The stability of the shape of the distribution over time means that, for any particular cost-recovery target, the Board can identify a fixed multiplier that, when multiplied by the transaction-weighted average of per-transaction base component costs in each year, should yield full-cost recovery for the target percentage of covered issuer transactions over time.
Distribution of per-transaction base component costs across covered issuer transactions
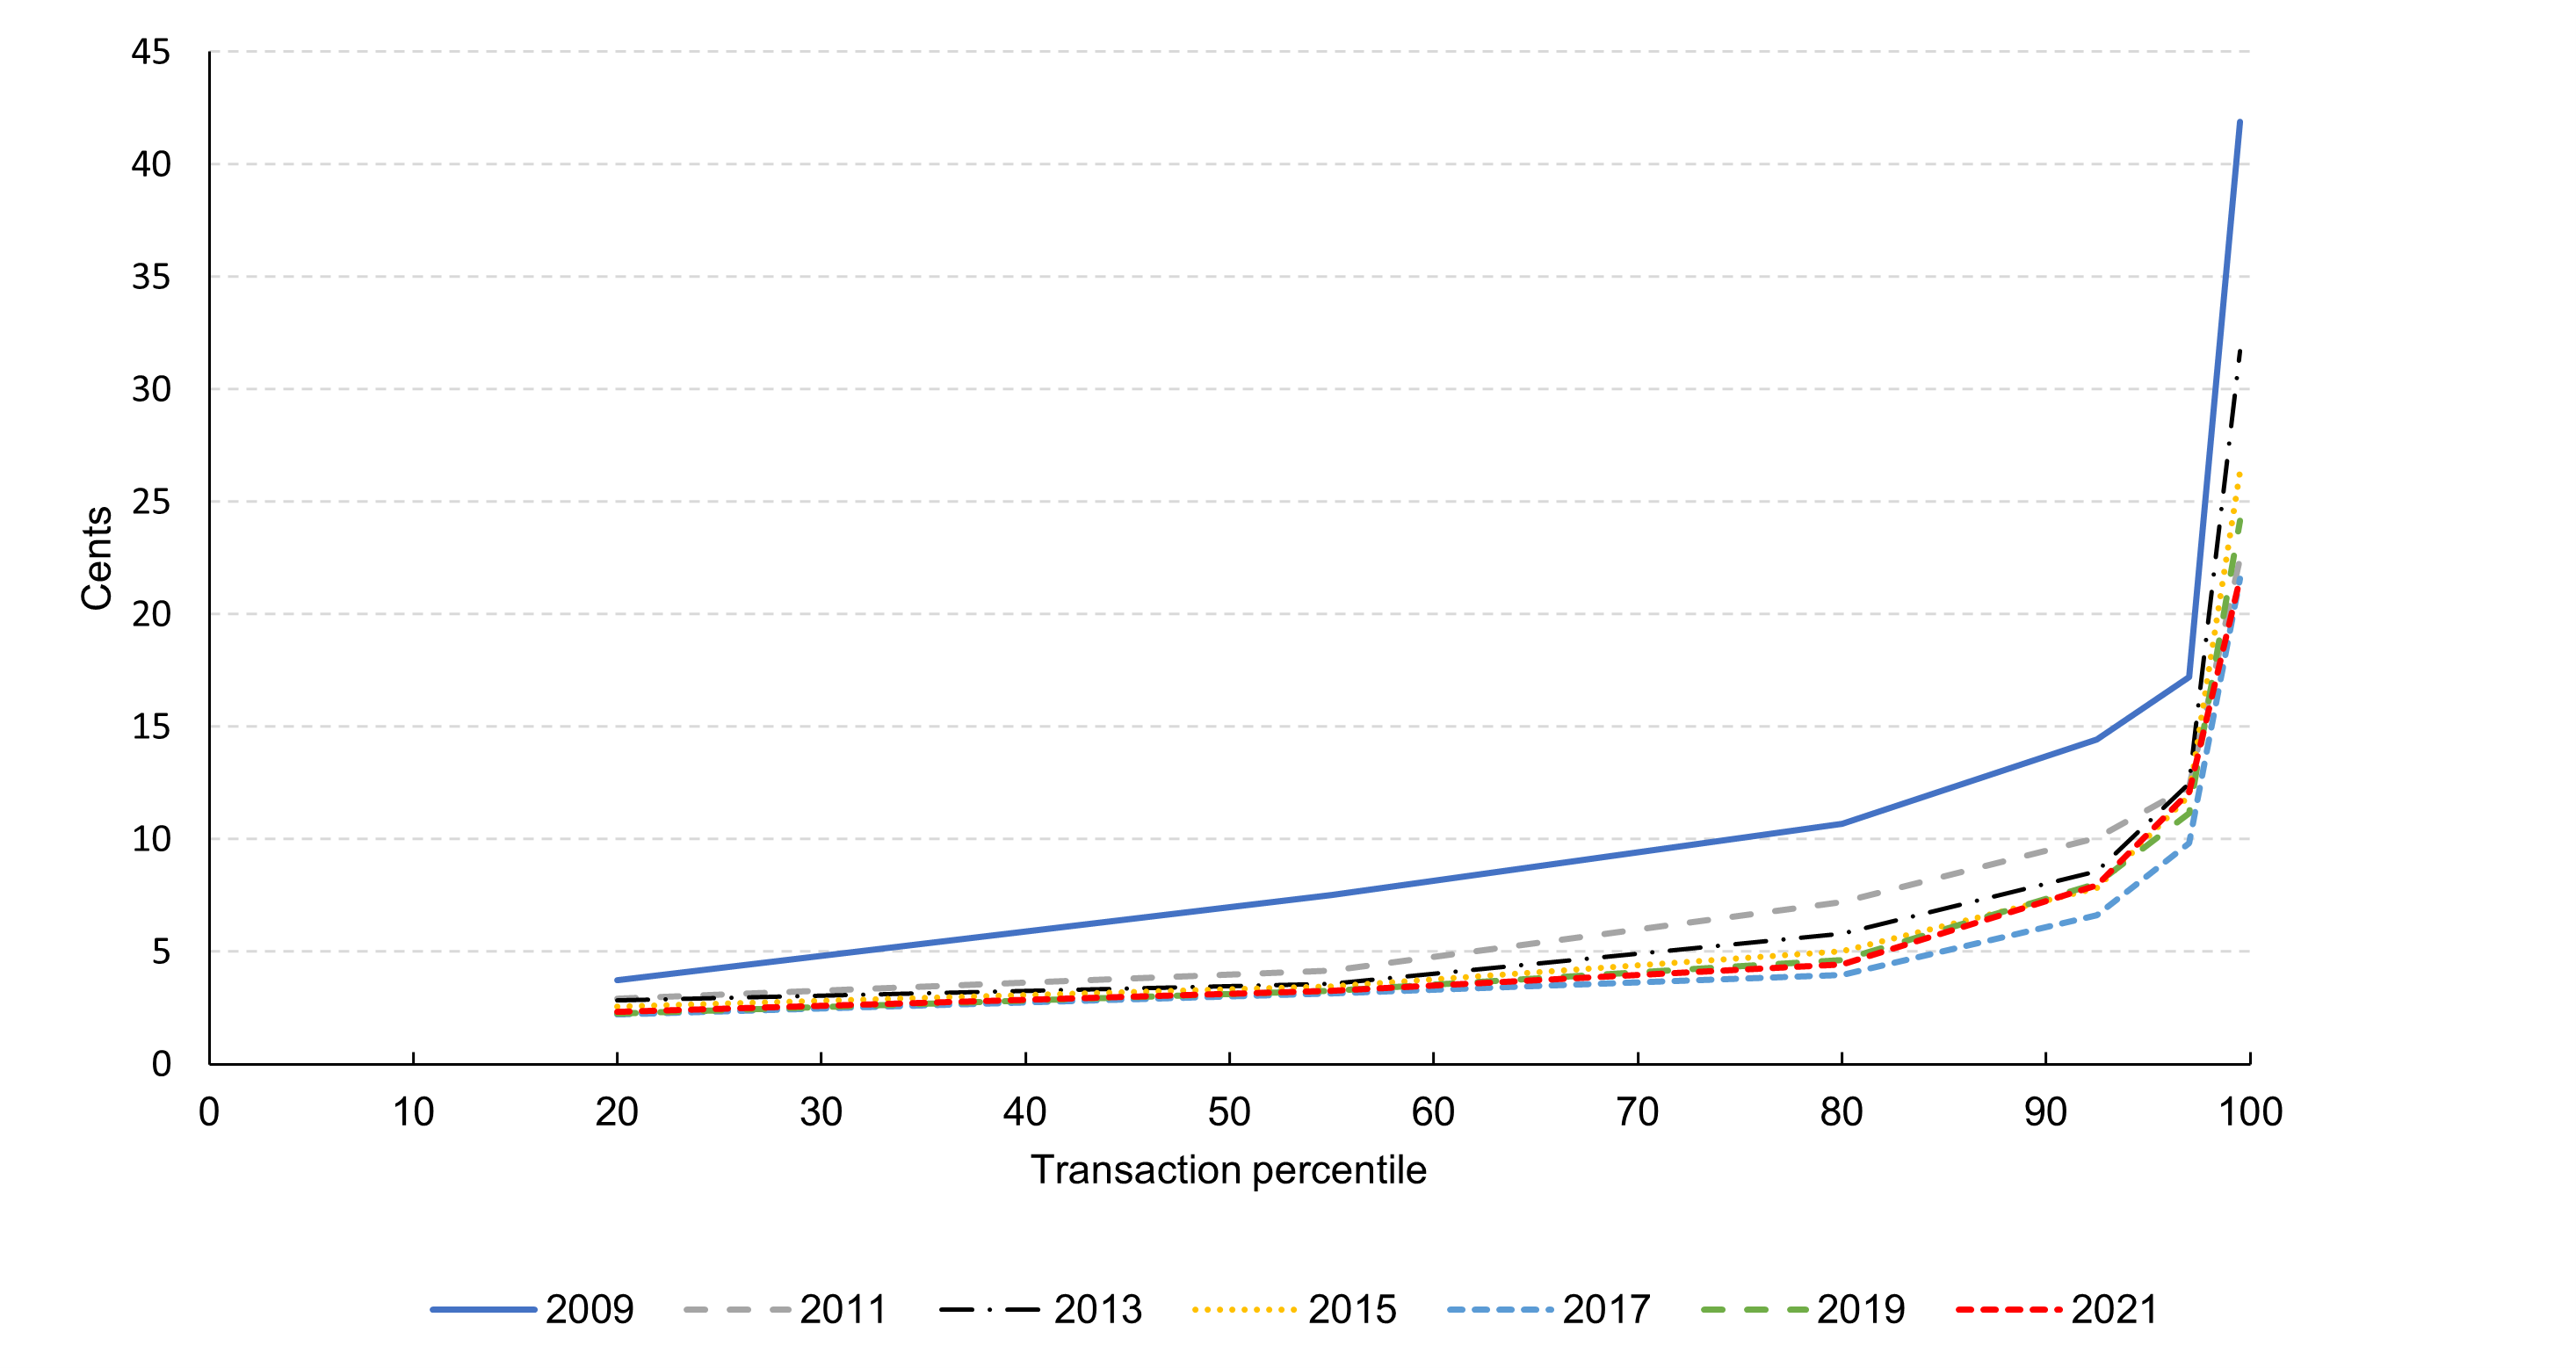
Table 1 below presents summary information about the distribution of per-transaction base component costs across covered issuer transactions based on the data reported to the Board. Specifically, table 1 shows, for each year for which data were reported, the average per-transaction base component costs of covered issuer transactions that fall within various transaction percentile ranges.5 For example, table 1 shows that for transactions performed in 2021, the average per-transaction base component costs of covered issuer transactions that fell between the 95th and 99th transaction percentiles was 12.1 cents.
Table 1, and the corresponding figure 1, illustrate key aspects of the distribution of per-transaction base component costs across covered issuer transactions. First, the shape of the distribution is similar across the data collection years. Second, for each data collection year, the shape of the distribution reflects that per-transaction base component costs are relatively low for a substantial majority of covered issuer transactions and considerably higher for a small number of covered issuer transactions. Finally, the distribution has shifted downward over time, reflecting the decline in the transaction-weighted average of per-transaction base component costs across covered issuers.
| Data collection year | All transactions* | Transaction percentile range | |||||
|---|---|---|---|---|---|---|---|
| 0–40 | 40–70 | 70–90 | 90–95 | 95–99 | 99–100 | ||
| 2009 | 7.7 | 3.7 | 7.5 | 10.7 | 14.4 | 17.2 | 41.9 |
| 2011 | 5.1 | 2.9 | 4.2 | 7.2 | 10.1 | 12.3 | 22.5 |
| 2013 | 4.6 | 2.8 | 3.6 | 5.8 | 8.6 | 12.5 | 31.7 |
| 2015 | 4.2 | 2.6 | 3.5 | 5.0 | 7.8 | 11.9 | 26.4 |
| 2017 | 3.6 | 2.2 | 3.1 | 4.0 | 6.6 | 9.8 | 21.6 |
| 2019 | 3.9 | 2.2 | 3.3 | 4.6 | 8.0 | 11.2 | 24.2 |
| 2021 | 3.9 | 2.3 | 3.2 | 4.4 | 8.0 | 12.1 | 21.6 |
*Transaction-weighted average of per-transaction base component costs across covered issuers
Figure 1: Average per-transaction base component costs of covered issuer transactions, in cents, by transaction percentile range and year
Approximation using the Weibull distribution
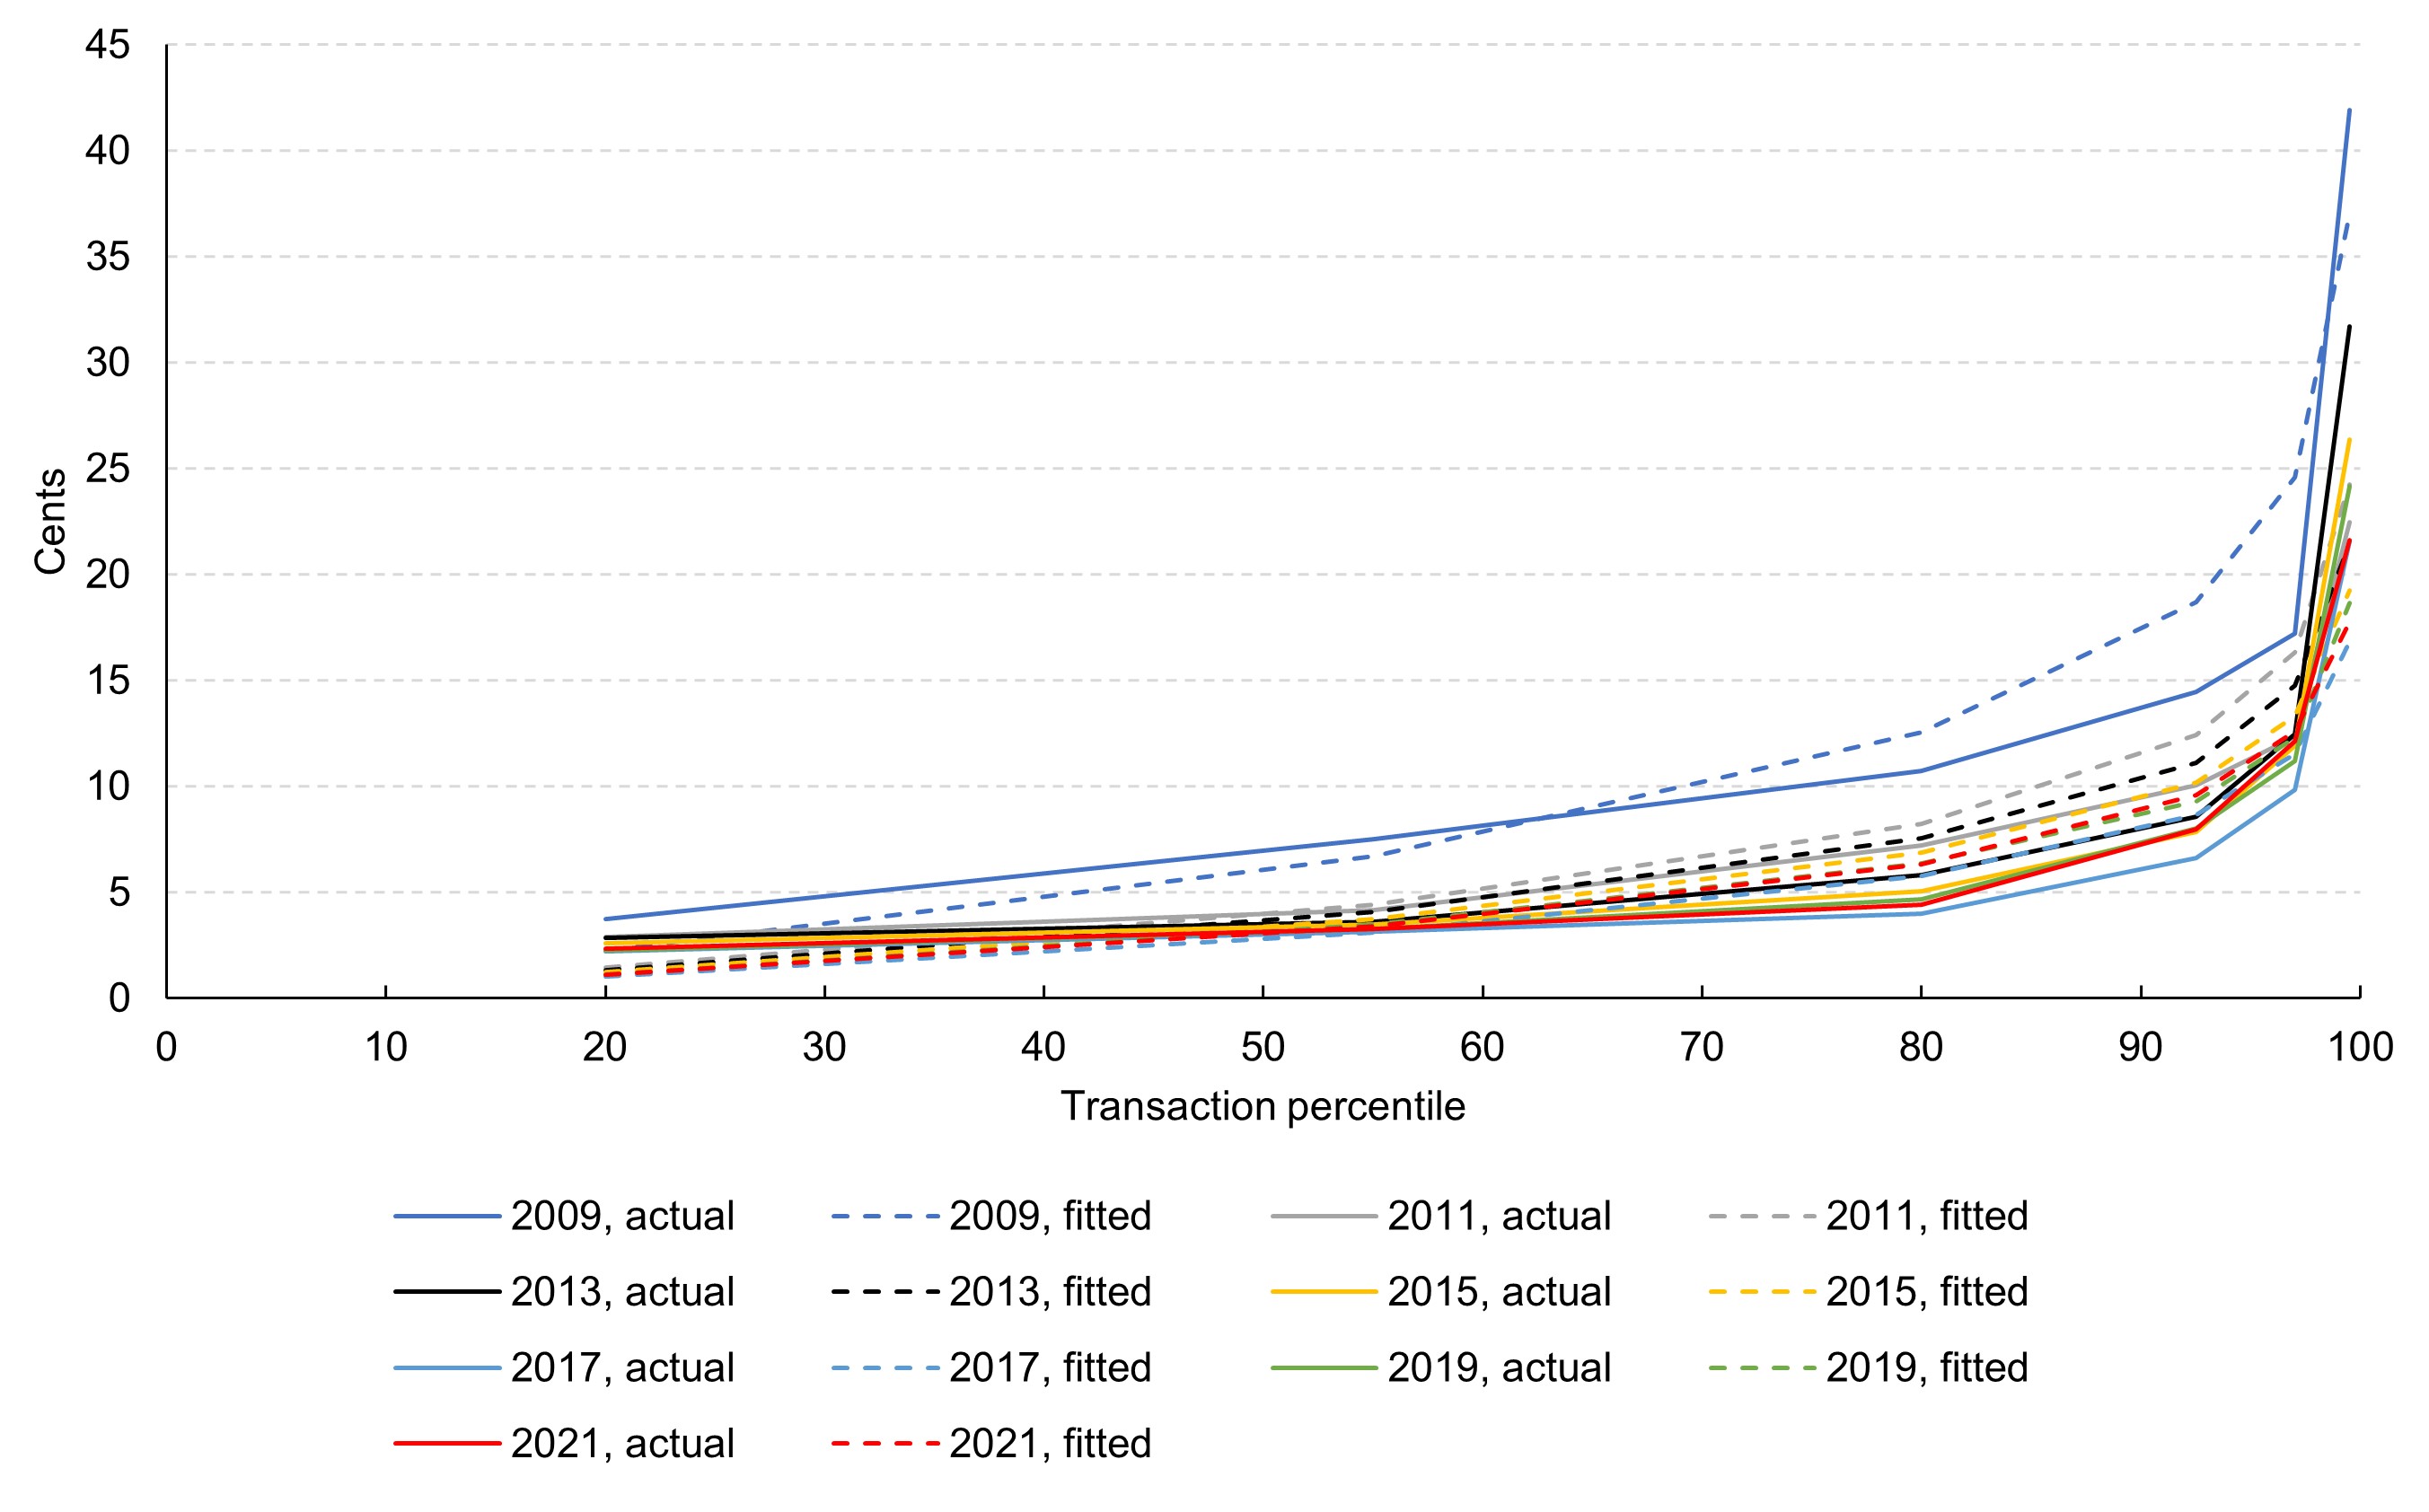
As stated in the Federal Register notice, the Weibull distribution can be used to model key aspects of the data reported to the Board on per-transaction base component costs across covered issuer transactions. First, a Weibull distribution can be fitted to the cumulative data in a way that reflects the stability of the shape exhibited by the data over time.6 Moreover, the shape of the fitted Weibull distribution captures important features of the shape exhibited by the data. In particular, for any given year, the fitted Weibull distribution has a large number of relatively low-cost covered issuer transactions and a small number of high-cost covered issuer transactions. Finally, the fitted Weibull distribution can incorporate changes in the transaction-weighted average of per-transaction base component costs over time.7
Table 2 and figures 2 and 3 (showing transactions performed in 2021 and transactions performed in all years, respectively) illustrate how well the data are approximated using a Weibull distribution. Table 2 repeats the average per-transaction base component costs of covered issuer transactions that fall within various transaction percentile ranges, as reported in table 1. It then shows the average per-transaction base component costs of covered issuer transactions for the same transaction percentile ranges in each year based on the fitted Weibull distribution. A comparison of the actual and fitted values for each transaction percentile range in each year provides information about how well the Weibull distribution models key aspects of the data, both for individual data collection years and over time.
| Data collection year | Distribution | Transaction percentile range | |||||
|---|---|---|---|---|---|---|---|
| 0–40 | 40–70 | 70–90 | 90–95 | 95–99 | 99–100 | ||
| 2009 | actual | 3.7 | 7.5 | 10.7 | 14.4 | 17.2 | 41.9 |
| fitted | 2.2 | 6.7 | 12.5 | 18.7 | 24.6 | 37.0 | |
| 2011 | actual | 2.9 | 4.2 | 7.2 | 10.1 | 12.3 | 22.5 |
| fitted | 1.4 | 4.4 | 8.2 | 12.4 | 16.3 | 24.2 | |
| 2013 | actual | 2.8 | 3.6 | 5.8 | 8.6 | 12.5 | 31.7 |
| fitted | 1.3 | 4.1 | 7.5 | 11.1 | 14.7 | 21.4 | |
| 2015 | actual | 2.6 | 3.5 | 5.0 | 7.8 | 11.9 | 26.4 |
| fitted | 1.2 | 3.7 | 6.9 | 10.1 | 13.3 | 19.2 | |
| 2017 | actual | 2.2 | 3.1 | 4.0 | 6.6 | 9.8 | 21.6 |
| fitted | 1.0 | 3.1 | 5.8 | 8.6 | 11.5 | 16.8 | |
| 2019 | actual | 2.2 | 3.3 | 4.6 | 8.0 | 11.2 | 24.2 |
| fitted | 1.1 | 3.5 | 6.3 | 9.3 | 12.3 | 18.6 | |
| 2021 | actual | 2.3 | 3.2 | 4.4 | 8.0 | 12.1 | 21.6 |
| fitted | 1.1 | 3.4 | 6.3 | 9.6 | 12.6 | 17.8 | |
Figure 2: Average per-transaction base component costs of covered issuer transactions performed in 2021, in cents, by transaction percentile range—actual vs. fitted (Weibull) distribution
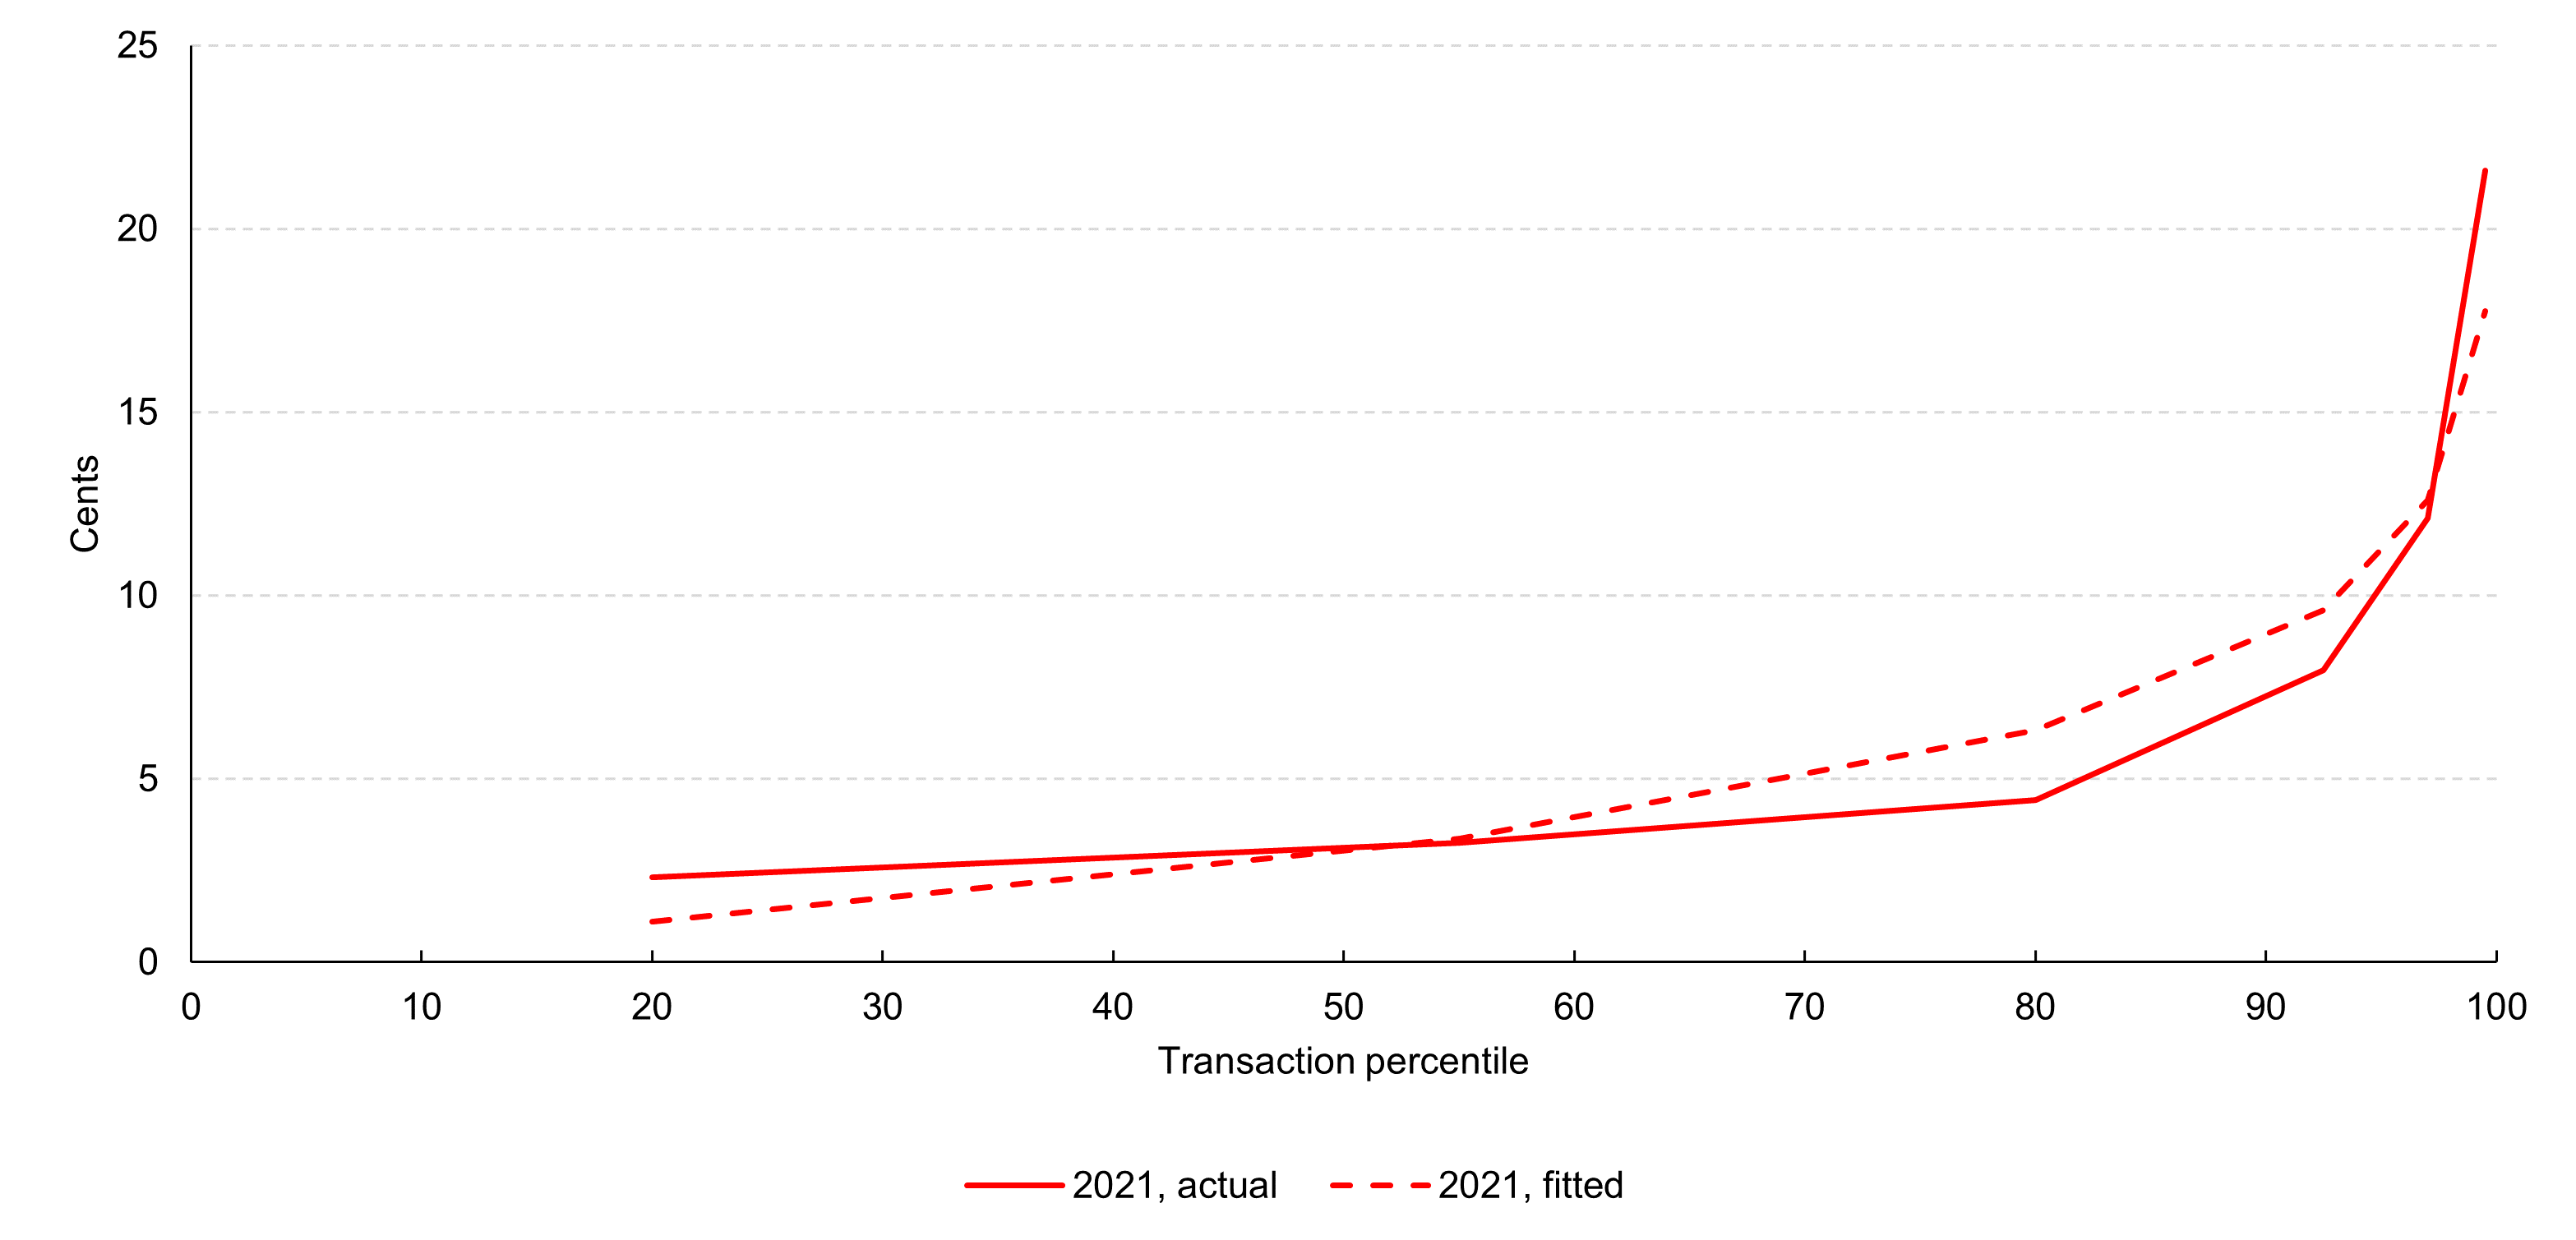
Figure 3: Average per-transaction base component costs of covered issuer transactions, in cents, by transaction percentile range and year—actual vs. fitted (Weibull) distribution
1.See 88 Fed Reg 78100 (November 14, 2023). Return to text.
2. The Board's reports may be found on the Board's website. See Board of Governors of the Federal Reserve System, Regulation II (Debit Card Interchange Fees and Routing): Reports and Data Collections. Return to text.
3. Proposed appendix B to Regulation II would specify which costs reported on the Debit Card Issuer Survey are base component costs, and how the transaction-weighted average of per-transaction base component costs across covered issuers is calculated. Return to text.
4. As described in the Federal Register notice, the Board generates the distribution of per-transaction base component costs across covered issuer transactions as follows. For each covered issuer that reported base component costs, the Board first determines the per-transaction base component costs of the covered issuer by (1) summing the base component costs reported by the covered issuer and (2) dividing this sum by the total number of debit card transactions reported by the covered issuer. The Board then assigns this result to each of the covered issuer's transactions. Finally, the Board arranges the per-transaction base component costs of all covered issuer transactions in ascending order from lowest- to highest-cost covered issuer transaction. Return to text.
5. To avoid revealing issuer-specific information, the cost data on this page are presented for percentile ranges of covered issuer transactions. The percentile ranges were selected to balance the need to maintain confidentiality with respect to issuer-specific data with the aim of illustrating the features of the distribution of per-transaction base component costs across covered issuer transactions over time. Return to text.
6. In particular, the estimation was performed by maximum likelihood where the shape parameter of the Weibull distribution was the same across data collection years. A constant shape parameter was confirmed by a statistical test. Specifically, a likelihood-ratio test was performed comparing the null hypothesis that the data collected over time came from a distribution with a constant shape parameter, and the alternative hypothesis that the data came from a distribution with year-specific shape parameters. This test failed to reject the null hypothesis at the 10 percent significance level, implying that there is not a statistically significant improvement in the fit of the distribution of per-transaction base component costs across covered issuer transactions when the shape parameter is allowed to vary over time, as opposed to being held constant over time. Return to text.
7. In the estimation, the scale parameter of the Weibull distribution was allowed to vary across data collection years to account for changes over time in the transaction-weighted average of per-transaction base component costs across covered issuers. Return to text.