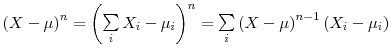
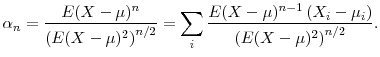
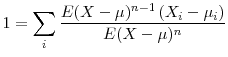
Vacancy Posting, Job Separation and Unemployment Fluctuations*
Keywords: Gross worker flows, job finding rate, employment exit rate, matching function
Abstract:
JEL classifications: E24, E32, J63, J64
1 Introduction
At the beginning of a recession, does unemployment go up because of fewer hirings, more job losses or both? What is the most effective policy to mitigate that increase, a firing tax, a hiring subsidy or a combination of both? And why does unemployment increase faster than if goes down?
The answers to these questions will depend for a large part on the determinants of unemployment fluctuations. In this paper, I study the relative importance of the two main driving forces of cyclical unemployment: vacancy posting, i.e. firms' recruiting efforts, and job separation.1
An extensive literature has studied worker flows over the business cycle, and more recently Shimer (2007) focused on individual workers' transition rates and concluded that unemployment inflows contribute much less to unemployment fluctuations than unemployment outflows.2 This very influential conclusion led to a recent modeling trend that assumes that the job separation rate (JS) is acyclical.3 However, a flow rates decomposition exercise may underestimate the contribution of JS because the job finding probability does not only depend on firms' job openings but also on the number of unemployed workers. For example, if a higher separation rate leads to higher unemployment and to a lower job finding rate (JF), one may attribute the high unemployment to a low JF, even though the true cause was an increase in job separation.
The first contribution of this paper is to address the endogeneity of JF by using a matching function to model the flow of new jobs.4 A matching function is extremely successful empirically and is used in almost all macroeconomic models that introduce equilibrium unemployment through search and matching frictions. By using a measure of vacancy posting to isolate fluctuations in the job finding rate caused solely by changes in firms' job openings, I find that the contribution of the job separation rate to unemployment's variance is close to 40 percent instead of 25 percent using Shimer's (2007) methodology. Thus, not modeling the cyclicality of the job separation rate will lead researchers to understate the volatility of unemployment.
This second contribution of this paper is to extend the method pioneered by Shimer (2007), Elsby, Michaels and Solon (2009) and Fujita and Ramey (Forthcoming) and study the determinants of unemployment's higher-order moments. I find that JS plays an important role with respect to skewness and kurtosis. In particular, the steepness asymmetry of unemployment -the fact that increases are steeper than decreases- is due in large part to the job separation rate, which accounts for more than 60 percent of first-differenced unemployment skewness.5 Further, JS and vacancy posting contribute in roughly equal proportions to unemployment's mild kurtosis. However, this decomposition hides an important difference between the two margins: vacancy posting presents a large negative excess kurtosis but JS presents a positive excess kurtosis. This result suggests that vacancy posting drives unemployment during normal times but that job separation is responsible for rare but violent fluctuations in unemployment. To explore this idea further, I depart from an average decomposition and analyze the relative contributions of JS and vacancy posting at business cycles turning points. I find that job separation is responsible for almost all of the movements in unemployment during the first two quarters after unemployment reaches a low or a high, and that vacancy posting does not become the main contributor until a year later. Thus, ignoring the cyclicality of the job separation margin will lead researchers to downplay the asymmetric behavior of unemployment and understate the breadth and speed of adjustment of unemployment around turning points.
The remainder of the paper is organized as follows: Section 2 reviews Shimer's method, its potential endogeneity bias and presents a way to address it; Section ![]() fits a matching function to the data and assesses the contribution of the job separation rate to unemployment's moments after controlling for the endogeneity of the job finding rate, Section
4 studies the behavior of the hazard rates at business cycles turning points; and Section 5 offers some concluding remarks.
fits a matching function to the data and assesses the contribution of the job separation rate to unemployment's moments after controlling for the endogeneity of the job finding rate, Section
4 studies the behavior of the hazard rates at business cycles turning points; and Section 5 offers some concluding remarks.
2 The contributions of JF and JS
In this section, I briefly review Shimer's (2007) methodology to identify the contributions of JF and JS to unemployment's variance and discuss the possible endogeneity of the job finding rate.
2.1 The variance decomposition approach
Denoting
![]() the unemployment rate at instant
the unemployment rate at instant
![]() with
with
![]() and
and
![]() , Shimer (2007) postulates that during a "period
, Shimer (2007) postulates that during a "period ![]() " of one month
- i.e.
" of one month
- i.e.
![]() - all unemployed workers find a job according to a Poisson process with constant arrival rate
- all unemployed workers find a job according to a Poisson process with constant arrival rate
![]() and all employed workers lose their job according to a Poisson process with constant arrival rate
and all employed workers lose their job according to a Poisson process with constant arrival rate
![]() . As a result, we have the first-order differential equation:
. As a result, we have the first-order differential equation:
By further assuming that the job finding rate is the same for all candidate workers, Shimer (2007) estimates the job finding rate separately by solving the first-order differential equation
 .
.Note however that this result is only an approximation, as the job finding rate may not be constant over
The separation rate can then be estimated by solving (1) over ![]() and finding
and finding
![]() such that the solution
such that the solution
![]() equals
equals ![]() for
for ![]() . Again, this estimation method relies on the assumptions that the job finding rate and the job separation rate are both constant over each time period and independent of unemployment.
. Again, this estimation method relies on the assumptions that the job finding rate and the job separation rate are both constant over each time period and independent of unemployment.
Shimer (2007) then argues that the measured magnitudes of the two hazard rates ensure that at a quarterly frequency, it is reasonable to use the following approximation
Following Elsby, Michaels and Solon (2009) and Fujita and Ramey (Forthcoming), log-linearizing (3) gives
or
2.2 The endogeneity of the job finding rate
A potential bias in Shimer's approach was first emphasized by Fujita and Ramey (Forthcoming) who argue that Shimer's decomposition may understate the true contribution of the job separation rate. For example, if a high separation rate leads to a low job finding rate, one may attribute the low job finding rate to high unemployment, even though the separation rate was the true cause.6
A simple way to think about this endogeneity problem is to consider a search and matching set-up in continuous time. The job finding rate is defined as the ratio of new hires to the stock of unemployed, so that if ![]() denotes the number of new matches at instant
denotes the number of new matches at instant ![]() , unemployed workers find a job according to a Poisson process with time varying arrival rate
, unemployed workers find a job according to a Poisson process with time varying arrival rate
![]() , where
, where ![]() is the number of unemployed. An increase
in the job separation rate will increase unemployment and mechanically lower the job finding rate, and a variance decomposition exercise that does not take into account the link between
is the number of unemployed. An increase
in the job separation rate will increase unemployment and mechanically lower the job finding rate, and a variance decomposition exercise that does not take into account the link between ![]() and
and ![]() will understate the contribution of JS.7
will understate the contribution of JS.7
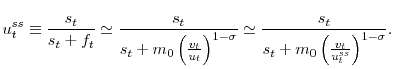
Following the literature and assuming a Cobb-Douglas matching function with constant returns to scale, I can write
![]() such that
such that
 with
with ![]() the number of
job openings. Importantly, this specification is standard and is used in almost all macroeconomic models that introduce equilibrium unemployment through search and matching frictions (see e.g. Pissarides, 2001). Using a measure of vacancy posting, I can then isolate the "exogenous" component of
the job finding rate, i.e. the movements in JF that are due to fluctuations in vacancy posting, not to fluctuations in unemployment.
the number of
job openings. Importantly, this specification is standard and is used in almost all macroeconomic models that introduce equilibrium unemployment through search and matching frictions (see e.g. Pissarides, 2001). Using a measure of vacancy posting, I can then isolate the "exogenous" component of
the job finding rate, i.e. the movements in JF that are due to fluctuations in vacancy posting, not to fluctuations in unemployment.
However, because
 is not constant over
 ![]() , one could worry that Shimer's (2007) method to recover
, one could worry that Shimer's (2007) method to recover
![]() and
and
![]() is not valid anymore because the differential equation satisfied by unemployment changes and takes the form
is not valid anymore because the differential equation satisfied by unemployment changes and takes the form
3 The contributions of vacancy posting and job separation
In this section, I study the contributions of vacancy posting and the job separation rate to unemployment fluctuations. I first argue that
![]() and
and
![]() are a natural set of variables to consider because they capture the decision variables of firms and workers and as such constitute the " primitive" variables that
respond to shocks and determine unemployment. I then estimate a estimate a matching function to capture movements in the job finding rate, and I use the hazard rate decomposition approach to evaluate the contributions of vacancy posting and job separation to unemployment's variance, skewness and
kurtosis.
are a natural set of variables to consider because they capture the decision variables of firms and workers and as such constitute the " primitive" variables that
respond to shocks and determine unemployment. I then estimate a estimate a matching function to capture movements in the job finding rate, and I use the hazard rate decomposition approach to evaluate the contributions of vacancy posting and job separation to unemployment's variance, skewness and
kurtosis.
3.1 Focusing on vacancy posting and JS
While the literature has traditionally studied the properties of job flows and worker flows, it also natural to consider the behavior of
![]() because these variables are the control variables that economic agents (firms and workers) adjust in response to shocks, and that policy can directly influence
(through e.g. a hiring subsidy or a firing tax). Starting with the firm's problem, a firm can adjust its number of workers through two channels: hirings and firings. For example, a firm faced with a positive TFP shock can choose to increase hirings, decrease firings or use a combination of both.
Put differently, hirings and firings are the two control variables of the firm (with respect to employment). However, by focusing on gross worker flows, one cannot rely on the hazard rate decomposition approach to quantitatively estimate the contribution of each margin of adjustment. Fortunately,
for a firm, choosing the number of new hires and fires is isomorphic to choosing the number of job openings (assuming that they ultimately all get filled) and choosing the percentage of the workforce to be shed, i.e. the job separation rate due to layoffs. Turning to the worker's problem, an
employed worker can decide whether to quit and as a result can influence the job separation rate due to quits. As a result, the total job separation rate (defined as the number of layoffs and quits over the number of employed workers) captures both firms and workers decisions.8 In the rest of the paper, I will only report the contributions of the aggregate job separation rate and vacancy posting, but in the Appendix, I present a variance
decomposition exercise that treats separately the three main decision variables of economic agents: vacancy posting, layoffs and quits.
because these variables are the control variables that economic agents (firms and workers) adjust in response to shocks, and that policy can directly influence
(through e.g. a hiring subsidy or a firing tax). Starting with the firm's problem, a firm can adjust its number of workers through two channels: hirings and firings. For example, a firm faced with a positive TFP shock can choose to increase hirings, decrease firings or use a combination of both.
Put differently, hirings and firings are the two control variables of the firm (with respect to employment). However, by focusing on gross worker flows, one cannot rely on the hazard rate decomposition approach to quantitatively estimate the contribution of each margin of adjustment. Fortunately,
for a firm, choosing the number of new hires and fires is isomorphic to choosing the number of job openings (assuming that they ultimately all get filled) and choosing the percentage of the workforce to be shed, i.e. the job separation rate due to layoffs. Turning to the worker's problem, an
employed worker can decide whether to quit and as a result can influence the job separation rate due to quits. As a result, the total job separation rate (defined as the number of layoffs and quits over the number of employed workers) captures both firms and workers decisions.8 In the rest of the paper, I will only report the contributions of the aggregate job separation rate and vacancy posting, but in the Appendix, I present a variance
decomposition exercise that treats separately the three main decision variables of economic agents: vacancy posting, layoffs and quits.
3.2 Modeling JF with a Cobb-Douglas matching function
To model the job finding rate, I estimate a Cobb-Douglas matching function that can capture movements in the monthly job finding rate. Under the assumption that
![]()
![]() over each month
over each month ![]() , I can use Shimer's estimate of the job finding
rate
, I can use Shimer's estimate of the job finding
rate
![]() , and I estimate the following equation
, and I estimate the following equation
after detrending all variables with an HP-filter.9
Seasonally adjusted unemployment ![]() is constructed by the BLS from the Current Population Survey (CPS). More difficult is the choice of a measure for vacancy posting
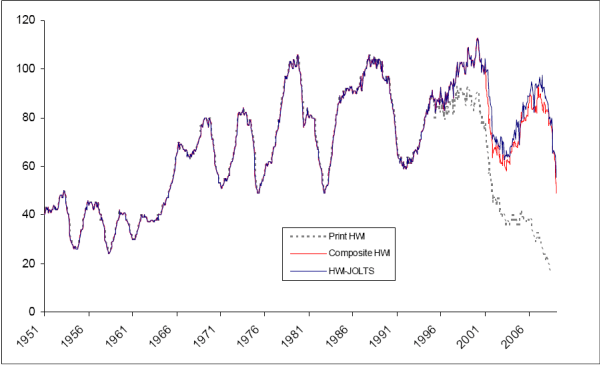
is constructed by the BLS from the Current Population Survey (CPS). More difficult is the choice of a measure for vacancy posting ![]() . There are two standard measures of job openings; the Help-Wanted advertising Index (HWI) and the Job Openings and Labor Turnover Survey (JOLTS). The Help-Wanted Index is constructed by the
Conference Board and measures the number of help-wanted advertisements in 51 major newspapers. This index is only a proxy for vacancy posting but has the advantage of dating back to 1951, thus providing a long time series. However, this "print" HWI index has become increasingly unrepresentative
as advertising over the internet has become more prevalent. In fact, the Conference Board stopped publishing its print HWI in May 2008 and publishes instead since 2005 a measure of on-line help wanted advertising. To build an index that combines information on " print" and "online" advertising,
I follow Fallick's (2008) approach and estimate the share of print help-wanted advertising as the ratio of a trend in the HWI to the value of that trend in 1994, which roughly corresponds to the introduction of the World Wide Web. After 2005, when both the online and print HWI are available, I
calculate the index by weighting the growth rates of the two indexes by the estimated print share.10 JOLTS is produced by the BLS and contains monthly data
on job openings from 16,000 establishments since December 2000. Since JOLTS provides a more direct, and arguably better, measure of vacancy posting than HWI, I construct a composite job openings index using print-online help wanted advertisements until December 2000 and using JOLTS data
thereafter.11 Figure 1 presents the different
measures of vacancy posting.
. There are two standard measures of job openings; the Help-Wanted advertising Index (HWI) and the Job Openings and Labor Turnover Survey (JOLTS). The Help-Wanted Index is constructed by the
Conference Board and measures the number of help-wanted advertisements in 51 major newspapers. This index is only a proxy for vacancy posting but has the advantage of dating back to 1951, thus providing a long time series. However, this "print" HWI index has become increasingly unrepresentative
as advertising over the internet has become more prevalent. In fact, the Conference Board stopped publishing its print HWI in May 2008 and publishes instead since 2005 a measure of on-line help wanted advertising. To build an index that combines information on " print" and "online" advertising,
I follow Fallick's (2008) approach and estimate the share of print help-wanted advertising as the ratio of a trend in the HWI to the value of that trend in 1994, which roughly corresponds to the introduction of the World Wide Web. After 2005, when both the online and print HWI are available, I
calculate the index by weighting the growth rates of the two indexes by the estimated print share.10 JOLTS is produced by the BLS and contains monthly data
on job openings from 16,000 establishments since December 2000. Since JOLTS provides a more direct, and arguably better, measure of vacancy posting than HWI, I construct a composite job openings index using print-online help wanted advertisements until December 2000 and using JOLTS data
thereafter.11 Figure 1 presents the different
measures of vacancy posting.
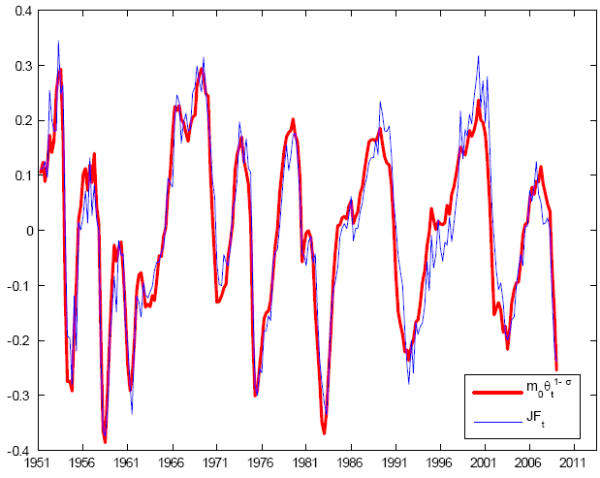
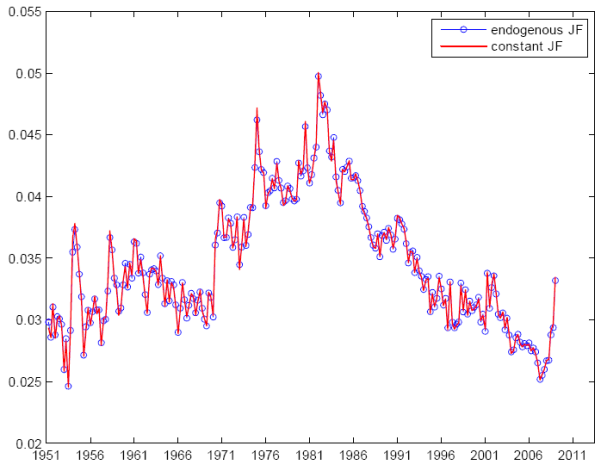
I first estimate (5) with monthly data and using the composite HWI-JOLTS index from 1951:M01 until 2009:M02. All data were previously detrended with an HP filter. Table 1 presents the result. The elasticity ![]() is precisely estimated at 0.59, and apart from JF's high-frequency movements (probably due to measurement errors), a matching function does a very good job at capturing movements in the job finding rate. Indeed, after taking quarterly averages, Figure 2 shows that a matching function tracks the empirical job finding rate very closely. Since JOLTS and HWI are two different dataset, I verify the robustness of the results using only one data source at a time. Further, to make sure that the
results are not biased by the strong low-frequency movements in HWI before 1977 that are unrelated to the labor market, I estimate (5) with the print-online help-wanted index over 1977:M01-2009:M02 only. We can see that the estimated
is precisely estimated at 0.59, and apart from JF's high-frequency movements (probably due to measurement errors), a matching function does a very good job at capturing movements in the job finding rate. Indeed, after taking quarterly averages, Figure 2 shows that a matching function tracks the empirical job finding rate very closely. Since JOLTS and HWI are two different dataset, I verify the robustness of the results using only one data source at a time. Further, to make sure that the
results are not biased by the strong low-frequency movements in HWI before 1977 that are unrelated to the labor market, I estimate (5) with the print-online help-wanted index over 1977:M01-2009:M02 only. We can see that the estimated ![]() is unchanged at 0.59. Finally, I use JOLTS data only over 2000:M12-2009:M02 and find a slightly lower
is unchanged at 0.59. Finally, I use JOLTS data only over 2000:M12-2009:M02 and find a slightly lower
![]() at 0.57. Encouragingly, these estimates lie in the middle of the plausible
range reported by Petrongolo and Pissarides (2001).
at 0.57. Encouragingly, these estimates lie in the middle of the plausible
range reported by Petrongolo and Pissarides (2001).
A legitimate concern with this regression exercise is that equation (5) may be subject to an endogeneity bias. The use of a monthly frequency and the fact that ![]() denotes the beginning of period unemployment rate should minimize the problem, but it is still important to verify that there is no significant bias. To do so, I estimate (5) using lagged values of
denotes the beginning of period unemployment rate should minimize the problem, but it is still important to verify that there is no significant bias. To do so, I estimate (5) using lagged values of
![]() as instruments.12
Encouragingly, Table 1 shows that the endogeneity bias is likely to be small as the coefficient is little changed at 0.58.13
as instruments.12
Encouragingly, Table 1 shows that the endogeneity bias is likely to be small as the coefficient is little changed at 0.58.13
The robustness of the results over different measures of vacancies and over different sample periods is promising and suggests that a matching function provides a good approximation of the job finding rate and can be reasonably used to control for the endogeneity of JF. For the rest of the
paper, I will use the composite HWI-JOLTS measure of vacancy posting with a matching function elasticity
![]() but the results do not rely on this specific choice.
but the results do not rely on this specific choice.
3.3 Variance decomposition
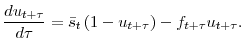
Writing the steady-state approximation for unemployment (3) at a quarterly frequency (as in Shimer, 2007) and modeling the job finding rate with a matching function, I get
where all variables now denote quarterly averages of their monthly counterparts.14
This approximation relies on the implicit assumption that movements in ![]() have an effect on steady-state unemployment (which is the case by definition) as well as on the job finding
rate within the time period, so that the quarterly average of the monthly job finding rate reflects the influence of the job separation rate. Fortunately, in the US, unemployment converges to its steady-state value in about a month (Shimer, 2007), so that the dynamic interactions between JS and JF
(through the matching function) are likely to be reflected in the quarterly (and a fortiori yearly) steady-state decomposition.15 Moreover, I can track the validity of my approach by looking at the contribution of the residual. Indeed, after log-linearizing (6) and using the fact that
have an effect on steady-state unemployment (which is the case by definition) as well as on the job finding
rate within the time period, so that the quarterly average of the monthly job finding rate reflects the influence of the job separation rate. Fortunately, in the US, unemployment converges to its steady-state value in about a month (Shimer, 2007), so that the dynamic interactions between JS and JF
(through the matching function) are likely to be reflected in the quarterly (and a fortiori yearly) steady-state decomposition.15 Moreover, I can track the validity of my approach by looking at the contribution of the residual. Indeed, after log-linearizing (6) and using the fact that
![]() , I can rewrite (4) as
, I can rewrite (4) as
with
Rearranging (7), I have
or
with
I now proceed with the variance decomposition exercise by using the fact that
A back-of-the-envelope calculation can readily give an idea of the revised contribution of the job separation rate when I take into account the endogeneity of JF. With
![]() and
and
![]() , the endogeneity of JF biases the contribution of JS downwards by 60
percent (from
, the endogeneity of JF biases the contribution of JS downwards by 60
percent (from
![]() ). Instead of a contribution of about 25
percent as reported in Shimer (2007), JS would in fact contribute to about 40 percent, a far from negligible amount.16
). Instead of a contribution of about 25
percent as reported in Shimer (2007), JS would in fact contribute to about 40 percent, a far from negligible amount.16
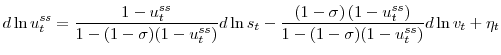
Using the log-deviation from trend
![]() where
where ![]()
![]() and
and ![]()
![]() denote the trend component of
denote the trend component of
![]() and
and ![]() , I can rewrite (8) as
, I can rewrite (8) as

The first column of Table 2 compares the values of the betas over 1951-2008 with and without controlling for the endogeneity of the job finding probability. Controlling for unemployment fluctuations is important as the contribution of the job separation rate increases from 24 percent to 39 percent.17 The successive approximations naturally increase the error component in the log-decomposition, and the contribution of the residual amounts to about 5 percent. To evaluate the bias introduced by a matching function, the middle row of Table 2 presents a variance decomposition exercise between JF and JS but using the matching function to model JF. We can see that the use of a matching function increases the contribution of the residual to 4 percent and correspondingly biases downwards the estimate of JF's contribution. As a result, the contribution of vacancy posting is likely to be underestimated and is probably closer to 60 than 55 percent. Overall, the residual contribution remains small. This confirms that the matching function does a good job at approximating the job finding rate, and that my approach provides a reasonable framework to evaluate the respective contributions of vacancy posting and layoffs/quits.
Using a first-differenced log-decomposition as in Fujita and Ramey (Forthcoming) and using
![]() , I have
, I have
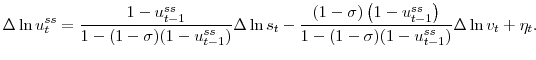
To sum up, controlling for the endogeneity of the job finding rate raises the contribution of JS to unemployment's variance by 60 percent; with a ![]() split between vacancy posting and job separation for a decomposition in level and a
split between vacancy posting and job separation for a decomposition in level and a ![]() split for a decomposition
in first-differences. As a result, modeling the job separation probability as acyclical will lead researchers to understate the volatility of unemployment.18
split for a decomposition
in first-differences. As a result, modeling the job separation probability as acyclical will lead researchers to understate the volatility of unemployment.18
3.4 Higher-order moments
While the literature has focused on unemployment's variance to evaluate the importance of the job separation rate, higher-order moments could paint a different picture. Notably, a stylized fact about unemployment is its asymmetric behavior, and a large literature has documented a non-trivial asymmetry in steepness for the cyclical component of unemployment, i.e. that increases are steeper than decreases.19 To evaluate the respective contributions of job separation and vacancy posting, I extend Fujita and Ramey's (Forthcoming) approach to higher-order moments and notably to the concept of skewness.
Let us denote the mean of ![]() as
as ![]() and its
and its ![]() th moment
th moment
![]() for
for
![]()
Further, let us assume that ![]() can be written as a sum of terms so that
can be written as a sum of terms so that
![]() By noting that
By noting that
 , I have
![]() so that I can write
so that I can write
Dividing (11) by
I can now estimate the contributions of vacancy posting and job separation to the steepness asymmetry of unemployment.20 To do so, I consider the
skewness of first-difference log-unemployment. Table 3 shows that over 1955-2008, first-differenced log-unemployment has a skewness coefficient of 1.2, significant at the 5% level.21 Vacancy posting and JS also present a significant
asymmetry in steepness with coefficients of -0.79 and 0.42. Using the
log-decomposition (9) and using
![]() , I have
, I have
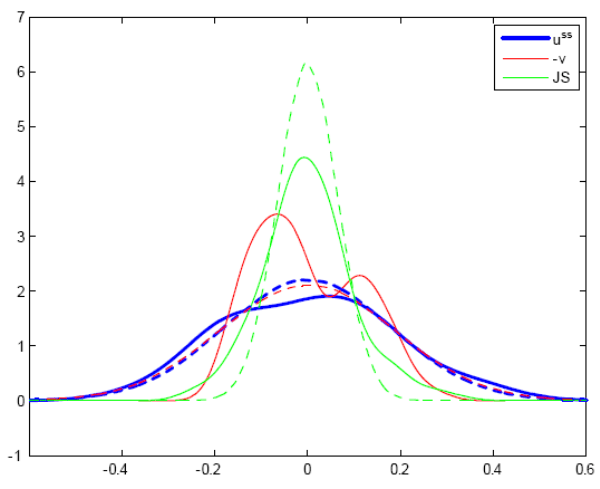
Table 3 presents another new fact pertaining to the fourth moment of unemployment and its hazard rates. While unemployment has a mild (but significant) negative excess kurtosis ( -0.34), vacancy posting and job separation have kurtosis of opposite signs. Vacancies present a large negative excess kurtosis ( -0.94) but JS presents a positive excess kurtosis ( 0.54). Recall that a high kurtosis distribution such as that of JS has a sharper peak and longer, fatter tails, i.e. extreme values are drawn more often than with a normal distribution. This finding is not surprising if we think of job separation as capturing (among other things) bursts of layoffs. On the other hand, a low kurtosis distribution such as that of vacancies has a more rounded peak and shorter thinner tails, i.e. fewer extreme values. To visualize the distribution of steady-state unemployment, vacancy posting and the job separation rate, Figure 3 plots the kernel density estimates of these variables using a Gaussian kernel with optimal bandwidth. The dashed lines represent the corresponding (i.e. mean and variance) normal distributions. While unemployment's distribution is very close to being normal, this is hardly the case for vacancy posting and job separation. Vacancy posting has almost a bimodal distribution with rapidly decreasing tails but the job separation rate has a small mass of points around the mean and very fat tails.
Looking at the contributions of each hazard rate, Table 4 shows that vacancy posting and job separation contribute in roughly equal proportion to unemployment's fourth moment, with a slight
advantage for vacancy posting. Given the lower contribution of JS to unemployment's variance, the mild negative kurtosis of unemployment despite the large negative kurtosis of vacancy posting is consistent with an interpretation of job separation influencing unemployment through rare but violent
episodes of job separation. The contribution of the residual amounts to less than 4 percent, and the second row of Table 4 indicates that the use of a matching function biases the contribution of JF downwards. As a result, the split between job separation and vacancy posting is roughly ![]() . While only indicative, this fourth-moment decomposition suggests that vacancy posting drives unemployment during normal times but that job separation is responsible for rare but violent fluctuations in unemployment.
. While only indicative, this fourth-moment decomposition suggests that vacancy posting drives unemployment during normal times but that job separation is responsible for rare but violent fluctuations in unemployment.
4 The contributions of vacancy posting and job separation at business cycle turning points
The evidence from the kurtosis decomposition exercise suggests that vacancy posting drives unemployment during normal times but that job separation is responsible for rare but violent fluctuations in unemployment. To explore this idea further, I depart from an average decomposition to analyze the relative contributions of the job separation rate and vacancies around the turning points of unemployment fluctuations.
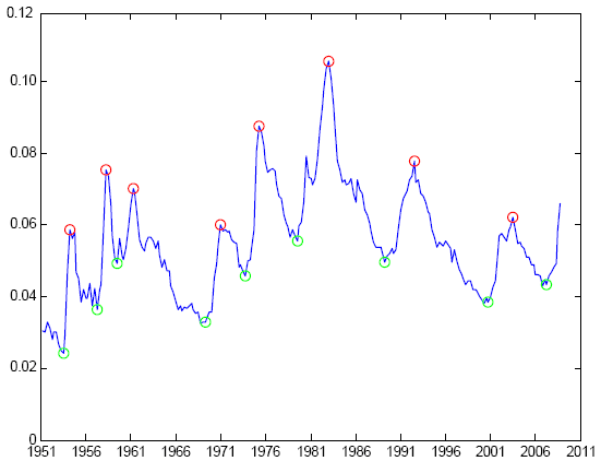
After detrending unemployment using an HP-filter with
![]() , I follow McKay and Reis (2008) and identify highs and lows in unemployment using the algorithm of Bry and Boschan (1971). Figure 4 plots the steady-state unemployment rate with identified turning points.22
, I follow McKay and Reis (2008) and identify highs and lows in unemployment using the algorithm of Bry and Boschan (1971). Figure 4 plots the steady-state unemployment rate with identified turning points.22
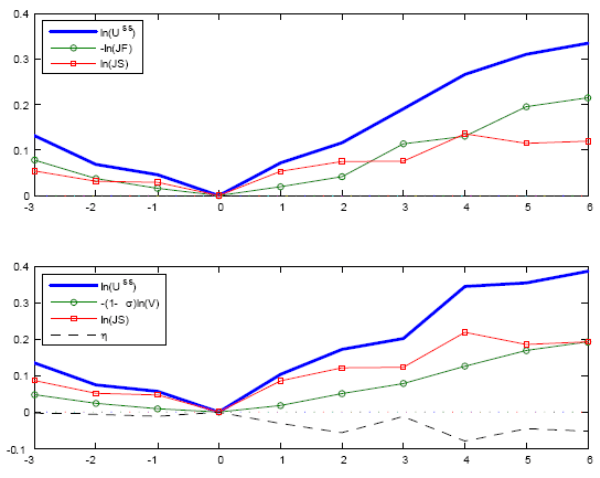
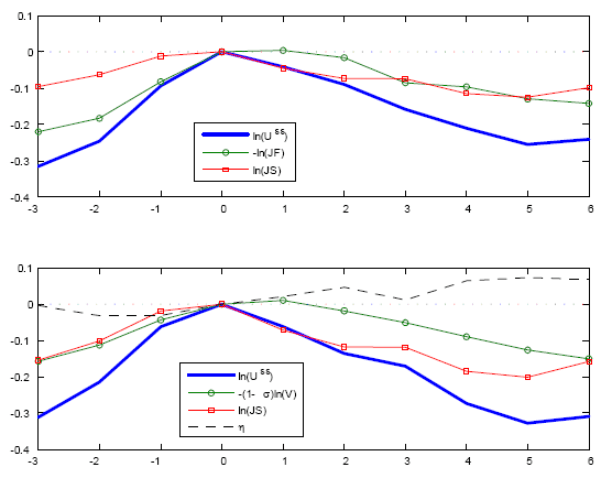
The first rows of Figure 5 and 6 plot the average dynamics of the log-deviation
from trend of steady-state unemployment, the job separation rate, and the job finding rate in a window of 3 and 6 quarters before and after the highs and lows of unemployment.23 As first shown by Elsby et al. (2009) with NBER recessions dates, an interest of this approach is that the log-decomposition (4) allows us to directly observe the relative contributions of JS and JF to unemployment fluctuations. The second rows
of Figure 5 and 6 display the same average dynamics but using the log of vacancy
times
![]() instead of JF.24 From (10), we can directly observe the relative contributions of job separation and vacancy posting as
instead of JF.24 From (10), we can directly observe the relative contributions of job separation and vacancy posting as
![]() corresponds to movements in unemployment caused by changes in vacancy posting.
corresponds to movements in unemployment caused by changes in vacancy posting.
A first observation is that, while the previous section showed that vacancy posting was, on average, the most important contributor of unemployment fluctuations, this is hardly the case at business cycle turning points. Around highs and lows, JS is the prime determinant of movements in unemployment. Without controlling for the endogeneity of JF, the results shown in Figure 6 are in line with Elsby et al's (2009) findings for NBER recessions: once unemployment reaches a low, JS is responsible for most of the initial increase in unemployment, but after two quarters JF becomes the dominant contributor of the increase in unemployment. The same conclusion holds for unemployment highs. However, the second row of Figure 6 shows that when I consider only the "exogenous" component of JF, job separation accounts for more than 50 percent of unemployment movements for as much as 6 quarters after a high or a low, and for almost all of the initial response. Interestingly, this result is consistent with the decomposition of unemployment's fourth moment in the previous section, which suggests that extreme values of unemployment are due to the job separation rate. Looking at the contribution of the residual, the approximation is relatively good three quarters before and after a turning point but deteriorates slightly thereafter. However, assigning all of the residual's contribution to vacancy posting (a worst case scenario for JS) does not change the main conclusion; JS still accounts for more than 50 percent of unemployment movements a year after a high or low.
Two other observations are worth noting. First, the asymmetric nature of unemployment is clearly apparent in Figure 5 and 6 as unemployment increases faster than it decreases. This asymmetry can be linked to the asymmetric response of JS. Vacancy posting reacts slowly, and the slope of vacancy posting is much weaker than that of job separation in the first quarters after a turning point. Second, after unemployment highs, vacancies lag job separation by a quarter. This is in line with Fujita and Ramey (Forthcoming), who find that the job separation rate lags the job finding rate.
An implication of these last findings is that ignoring the job separation margin when modeling unemployment will lead researchers to underestimate the breadth and speed of adjustments in unemployment around turning points.
5 Conclusion
In this paper, I study the relative importance of the two main determinants of unemployment fluctuations: vacancy posting and job separation. By isolating fluctuations in the job finding rate due solely to changes in vacancy posting, I take a first step to address the endogeneity of the job finding rate, and I find that the contribution of the job separation rate to unemployment's variance is close to 40 percent instead of 25 percent using Shimer's (2007) methodology. I also extend Shimer (2007), Elsby et al (2009) and Fujita and Ramey (Forthcoming) variance decomposition exercise to higher-order moments, and I find that job separation contributes to about 60 percent of unemployment steepness asymmetry, a stylized fact of the jobless rate. Finally, while vacancy posting is, on average, the more important contributor of unemployment fluctuations, the opposite is true around business cycle turning points, when job separation is responsible for most of unemployment movements.
These results imply that modeling the job separation margin as acyclical will lead researchers to (i) understate the volatility of unemployment, (ii) seriously downplay the asymmetric behavior of unemployment, and (iii) underestimate the breadth and speed of adjustments in unemployment around business cycle turning points.
A1 The timing of  ,
,  , and
, and 
An important issue when using measures for unemployment, vacancy posting and job finding probability concerns the precise definition of each variable. In particular, while some variables are beginning or end of month values, others are monthly averages.
In the CPS, the BLS surveys the number of unemployed during the reference week, defined as the week including the 12th day of the month. The Help-Wanted Index
![]() measures the total number of advertisements (print or online) from the 14th (
measures the total number of advertisements (print or online) from the 14th (![]() )of the month to the 13th of next month (
)of the month to the 13th of next month (![]() ). JOLTS, on the other hand, indicates the number of job openings
). JOLTS, on the other hand, indicates the number of job openings
![]() on the last day of month
on the last day of month ![]() . Finally, Shimer's (2007) definition of
. Finally, Shimer's (2007) definition of
![]() implies that
implies that
![]() measures the average job finding probability between two unemployment measurement dates, i.e. between the week including the 12th of next month and the week including the 12th
of the current month.
measures the average job finding probability between two unemployment measurement dates, i.e. between the week including the 12th of next month and the week including the 12th
of the current month.
To be as consistent as possible with these measurement dates, the average job finding probability should depend on the average unemployment rate and the average number of posted vacancy between two reference weeks. Since ![]() measures the unemployment rate during the first reference week, the correct measure of unemployment inside the matching function should be
measures the unemployment rate during the first reference week, the correct measure of unemployment inside the matching function should be
![]() . Since
. Since
![]() already corresponds to an average over a period and
already corresponds to an average over a period and
![]() measures the number of job openings at a date roughly in between two reference weeks,
measures the number of job openings at a date roughly in between two reference weeks,
![]() corresponds to
corresponds to
![]() as those two measures would be equal if the number of job openings remained constant in between two reference weeks.
as those two measures would be equal if the number of job openings remained constant in between two reference weeks.
As a result, a more consistent regression would be
after detrending all variables with an HP-filter. Of course, such a regression is clearly subject to an endogeneity bias as
A2 Identifying
 with an endogenous job finding rate
In this appendix, I describe a more rigorous way to recover the job separation rate without the need to assume that
![]()
![]() over
over ![]() . While this approach is quite sensitive to the
parameterization of the matching function and the value of
. While this approach is quite sensitive to the
parameterization of the matching function and the value of ![]() , it allows me to verify that assuming
, it allows me to verify that assuming
![]()
![]() has almost no consequences on the estimation of
has almost no consequences on the estimation of
![]() Instead of assuming that
Instead of assuming that
![]() remains constant over
remains constant over ![]() , I make the weaker assumption that only
, I make the weaker assumption that only
![]() is constant over
is constant over ![]() and equals
and equals ![]() . This assumption is consistent with the definition of
. This assumption is consistent with the definition of
![]() ; the total number of vacancies over
; the total number of vacancies over ![]() (see Appendix A1). The law
of motion for unemployment (1) now takes the form
(see Appendix A1). The law
of motion for unemployment (1) now takes the form
Similarly to Shimer (2007), I then solve this differential equation for different values of
![]() until the solution at time
until the solution at time ![]() equals
equals ![]() . In Figure 7, I compare the estimates of
. In Figure 7, I compare the estimates of ![]() obtained with and without assuming constant hazard rates. As we can see, both estimates are extremely similar suggesting that the approximation
obtained with and without assuming constant hazard rates. As we can see, both estimates are extremely similar suggesting that the approximation
![]()
![]() over
over ![]() is reasonable as it does not lead to any substantial bias
in
is reasonable as it does not lead to any substantial bias
in
![]() .
.
A3 The contributions of layoffs and quits
In this section, I study the separate contributions of layoffs and quits to unemployment's variance by using CPS data from the BLS on the reasons for unemployment (layoffs, quits or labor force entrants) over 1968-2004 as in Elsby et al. (2009). Denoting
![]() ,
, ![]() and
and ![]() the unemployment rates by reason, I have
the unemployment rates by reason, I have
![]() and
and
![]() , with
, with
![]() ,
,
![]() and
and
![]() where
where ![]() is the employment rate and
is the employment rate and
![]() the labor force participation rate. Looking at Elsby et al. (2009) decomposition, we can see that business cycle fluctuations in
the labor force participation rate. Looking at Elsby et al. (2009) decomposition, we can see that business cycle fluctuations in ![]() and
and ![]() are small compared to cyclical fluctuations in the hazard rates, and that fluctuations in
are small compared to cyclical fluctuations in the hazard rates, and that fluctuations in ![]() are small compared to movement in the other inflows rates (see Elsby et al. (2009), Figures 9 & 11). As a result, I can write the following approximation
are small compared to movement in the other inflows rates (see Elsby et al. (2009), Figures 9 & 11). As a result, I can write the following approximation
And using a matching function to model the job finding rate, I can write
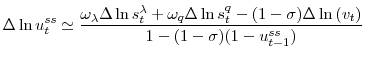
Table 1: Estimating the matching function from Shimer's Job Finding rate
| Dependent variable: Sample | ||||
|---|---|---|---|---|
| Regression | (1)
Composite index: HWI - JOLTS |
(2)
Help-Wanted Index |
(3)
JOLTS |
(4)
Composite index: HWI - JOLTS |
| Estimation | OLS | OLS | OLS | GMM |
| 0.59***
(0.01) |
0.59***
(0.01) |
0.57***
(0.02) |
0.58***
(0.02) |
|
| R2 | 0.81 | 0.81 | 0.73 | - |
Notes: In all regressions, all variables were previously detrended with an HP filter (
Table 2b: Contribution of JF and JS to unemployment variance, Yearly, 1951-2008
| Variance:
|
Variance:
|
Variance:
|
Variance:
|
Variance:
|
Variance:
|
|
|---|---|---|---|---|---|---|
| Matching fct Control Endog: No |
22.2% | 77.9% | -0.1% | 28.4% | 69.4% | 2.2% |
| Matching fct Control Endog: No |
22.9% | 77.2% | 0.1% | 28.4% | 72.2% | 0.2% |
| Matching fct Control Endog: Yes |
37.0% | 64.1% | -1.1% | 45.8% | 56.8% | -2.6% |
Notes: "Matching fct
Table 3: Higher-order moments of unemployment and hazard rates, 1955-2008
| JS | |||
|---|---|---|---|
| Skewness | 1.21**
(0.53) |
-0.79**
(0.24) |
0.42**
(0.09) |
| Kurtosis | 2.66
(1.16) |
2.06**
(0.40) |
3.54**
(1.40) |
Notes: All variables are expressed in log. For skewness, variables are detrended with an HP filter (
Table 4: Contribution of JF and JS to higher-order moments of unemployment, 1955-2008
| Skewness:
|
Skewness:
|
Skewness:
|
Kurtosis:
|
Kurtosis:
|
Kurtosis:
|
|
|---|---|---|---|---|---|---|
| Matching fct Control Endog: No |
38.8% | 60.1% | 1.1% | 27.4% | 73.1% | -0.4% |
| Matching fct Control Endog: No |
38.8% | 63.5% | -2.3% | 27.4% | 69.7% | 3.0% |
| Matching fct Control Endog: Yes |
62.5% | 42.7% | -5.2% | 44.0% | 52.5% | 3.5% |
Notes: "Matching fct