
Consumption Responses to Permanent and Transitory Shocks to House Appreciation1
|
Congressional Budget Office
|
|
Federal Reserve Board
|
Keywords: Life cycle, marginal propensity to consume, house prices
Abstract:
We estimate the marginal propensity to consume (MPC) out of permanent and transitory shocks to house price appreciation. We consider two different models under which those shocks may affect consumption. In the first one, housing is a risky asset. In the second one, housing has a role as a consumption and as an investment good. In both, changes in the rate of house price appreciation may affect nonhousing consumption. Shocks to appreciation rates may happen when increases in future house prices are expected to differ from the current ones because heterogeneity, market failures or errors in expectations. We test the implications of those models empirically using the PSID's imputed total consumption from food consumption and self-reported house values, and base our identification strategy on two sources of variation in the appreciation rate. The first source depends on the fact that home prices are far more cyclical in areas where the supply of housing is relatively inelastic. The second source is households' perceptions about which parts of shocks to appreciation rates are permanent or transitory. We model households' self-reported rate of appreciation as an AR(1) process and use both the Hodrick-Prescott and the Kalman filter to separate households' perceptions about permanent and transitory shocks to appreciation. Our results show that (1) consumption responses to house wealth shocks vary greatly by area and depend upon the area-specific levels of temporal persistence and variance of those shocks; (2) the overall MPC out of those shocks is 3.5%; (3) the MPC out of permanent shocks is between 3.4% and 9.1%; and (4) the MPC out of transitory shocks is between 0.5% and 3.3%.
JEL Classification: E21, R10, D911 Introduction
One of the main implications of the permanent income/life-cycle hypothesis is that households are likely to have smaller changes in consumption when they face transitory unexpected fluctuations to their total resources than when they face permanent unexpected shocks to those resources. Most empirical tests of that implication have focused on the response to income shocks, which are easier to identify than shocks to financial wealth as temporary or permanent.2 In addition, most macroeconomic models assume that the marginal propensity to consume (MPC) out of wealth is constant over time and across households. In this paper we use household-level data to generate separate estimates of the MPC out of permanent and out of transitory shocks to housing wealth appreciation by exploiting geographical differences in the cyclicality of house prices.3
The advantage of using housing wealth to generate our estimates of the MPC out of permanent and transitory shocks is that, unlike shocks to financial assets, the returns to housing differ greatly across households depending on where they live. In areas with significant constraints on the supply of housing, such as in coastal states, a positive demand shock is more likely to result in higher permanent prices, while in areas without such constraints such a price shock would be largely transitory, as supply increases in response to the demand shock. The resulting difference in house price dynamics is observable to both homeowners and econometricians, providing a unique opportunity to identify separately the elasticities of consumption to permanent and to transitory shocks to housing price appreciation.4
The effect of housing wealth on consumption is a vital issue for macroeconomic forecasters. Housing wealth plays a central role in the economy: Families hold almost 70 percent of their assets in the form of housing wealth, and the construction sector represents 35 percent of total gross private domestic investment, not counting the spillovers to other sectors.5 The extent to which significant housing appreciation might support higher consumption during a housing boom and the extent to which consumption might fall when the home values decline, play a vital role in forecasting macroeconomic activity.
We start by examining two different models through which housing wealth may affect consumption, other than through borrowing constraints. The first model considers housing as a risky asset, and shocks to the return of that asset (i.e. shocks to housing appreciation) have an effect on consumption. The second model considers housing as both a consumption good and an investment good and shows that, even for households not bound by borrowing constraints, shocks in the rate of housing price appreciation can also affect consumption when an increase in the house prices today is not expected to be exactly matched by the same increase in the future, resulting in differences in the user cost of housing over time and generating a wealth effect.
Shocks to appreciation rates may happen when increases in future house prices are expected to differ from the current ones because of heterogeneity, market failures or incorrect expectations. If this is the case, the wealth effect of a higher house price in the present would not be canceled out by higher housing expenses in the future. Heterogeneity in house price appreciation across regions, for example, make it feasible to take advantage of an increase in the house price in one region without the need of sacrificing housing consumption when the household expects to move to another region with cheaper houses. Market failures may cause the rents to be disconnected from the house prices, such that when house prices increase the rental price does not, resulting in a wealth effect. And incorrect expectations may cause consumers to think that house prices will keep increasing in such a way that an increase in the house price today would imply an even higher increase in the price tomorrow, generating again a wealth effect.
In the first model housing is considered a risky asset and assumed to be the only asset that agents can hold to insure against income shocks. However, returns are stochastic, adding a source of uncertainty in the household's decision problem. Our numerical simulations show that a household's MPC depends on three key variables: first, the size and nature of the appreciation shocks, that is, whether they are transitory or permanent; second, the persistence of those appreciation shocks, that is, the length of time that a shock to appreciation continue to have an effect; and third, the variance of the shock. We find that permanent shocks have a greater effect on consumption than transitory shocks and that households facing a higher variance of shocks can be expected to have a higher MPC out of both permanent and transitory shocks. A higher MPC out of permanent income shocks is a standard result in the consumption literature. Kimball (1990) found that the MPC is also an increasing function of income variation, because the increased variation increases the slope of the decision rule on consumption. That effect results from a decrease in the agent's "prudence" (that is, the strength of the precautionary saving motive measured as a function of the third derivative of the utility function). The intuition behind this result, as Kimball points out, is that in addition to loosening the budget constraint, the larger income shocks diminish the consumer's prudence in allocating resources and encourage extra consumption. The same intuition applies to our case. A positive wealth shock, which is the extension pursued in this paper, increases the buffer stock of savings and encourages higher consumption.
In the second model, when housing is considered as both a consumption and an investment good, shocks to house prices alone do not generate movements in consumption. This is consistent with some recent papers that question the causal link between changes in housing wealth and consumption. However, when house prices in the future are expected to be higher than house prices today, shocks to the rate of return on housing (i.e. house price appreciation shocks) do affect consumption. In addition, the presence of binding borrowing constraints are sufficient to establish a causal connection between housing wealth and consumption. In this model, the role of housing as collateral to relax household's borrowing constraints is explicitly considered. Even some critics of the existence of a significant housing wealth effect (such as Attanasio et al.) do find some evidence of changes in housing wealth impacting consumption through such a channel. In models without housing as collateral, an increase in house prices today simply increases the cost of housing tomorrow, with no impact on consumption.
Whether house price appreciation shocks affect consumption and whether they have permanent and transitory components are empirical questions. In a world with efficient markets, shocks to house price appreciation would be arbitraged away in the market. But in a market with frictions and heterogeneous consumers and sub-markets like the housing market, those arbitrage possibilities may take time to disappear, and price bubbles might occur, causing the shocks in price appreciation to be perceived as persistent.
In the empirical section, we use data from the Panel Study of Income Dynamics (PSID) to estimate the variation of shocks in housing prices across census divisions in order to test the predictions of the theory, namely, that (i) households in divisions where the shocks to home prices are more persistent over time will have a higher MPC, and (ii) households in divisions with higher volatility of prices will have a higher MPC due to a precautionary saving motive that induces an upward-sloping consumption profile.6 We impute total consumption from the PSID measure of food consumption. Our measure of home prices is the self-reported house value.
We also estimate the MPC out of permanent and transitory shocks to housing appreciation at the household level, to test the classical life-cycle permanent income hypothesis that the response to permanent shocks dominates the response to transitory shocks.7 We use two alternative statistical filters to model the process through which households can determine which part of the house price appreciation is transitory and which is permanent. The first is the Hodrick and Prescott filter (HP) (Hodrick and Prescott ,1997) filter which uses a simple method to determine which part of a series represents the trend and which represents fluctuations around that trend. The second filter we use is a Kalman filter, which represents the process by which households can learn about the rate of appreciation for their own house.
We then estimate the process for house price appreciation and estimate the MPC out of housing wealth. The house price appreciation process consists of two components: (1) a deterministic component that depends on the characteristics of the home, and (2) a shock to house appreciation. Our analysis focuses on the consumption responses to those appreciation shocks.8
Our main empirical results are consistent with our theoretical predictions. First, households in areas that have higher persistence in the shocks or higher variability in those shocks do in fact have a higher MPC out of housing wealth. Second, the consumption responses to permanent shocks in appreciation are higher than those to transitory shocks. Specifically, the point estimate of the MPC out of shocks to housing wealth is 3.5 percent, the the point estimate of the MPC out of permanent shocks to housing wealth is between 3.4 percent and 9.1 percent, and the MPC out of transitory shocks is between 0.5 percent and 3.3 percent, depending on how we measure the permanent and transitory shocks.
Although most papers in the housing literature have estimated an MPC out of housing that is constant across all households, our estimates for the elasticity to permanent shocks to housing wealth are nearer the higher end of the ranges estimated in these papers, and our estimates of the elasticity to temporary shocks are significantly lower. Benjamin, Chinloy, and Jun (2004) estimate an elasticity of consumption to housing wealth of 8 percent. Bostic, Gabriel, and Painter (2009) report a slightly lower estimates of 5.7 percent, using micro data from the Survey of Consumer Finances and the Consumer Expenditure Survey. They also observe that estimates for these elasticities fell from 1989 to 2001. Juster et al. (2006) use the PSID to estimate the effect of household capital gains, including gains in housing wealth, on saving and find that a dollar increase in housing gains decreases saving between 1.3 cents and 3.2 cents over a 5-year period, although their estimates are not statistically significant different from zero.
A frequent challenge for studies of the MPC out of housing wealth is the potential endogeneity between housing values, consumption and unobserved variables in the error term that may contain information about future income or wealth. The concern is that any observed correlation between increasing house prices and increasing consumption is not due to a causal link, but instead to a common factor such as expected future income shocks.9
Several papers have argued recently that once this endogeneity between consumption and housing has been accounted for, the MPC out of housing is no longer significant. Calomiris et al. (2009) take the state-level model from Case, Quigley, and Shiller (2005) and reestimate it both with lagged values of housing wealth, stock wealth, and income using those lagged values as instruments for the contemporaneous changes in the measures. They find that although the MPC out of financial wealth remains significant, the MPC out of housing wealth is no longer significant in this specification.
In a related paper, Attanasio et al. (2009) test the hypothesis that co-movements in consumption and house prices are both driven by income expectations. The authors utilize U.K. household panel data to generate estimates of expected home price changes at the divisional level using divisional measures of earnings growth and the real interest rate. They examine the correlation between the residuals from regressing log consumption on a set of demographic variables including age and the log real house prices for the region interacted with age dummies. The finding that younger households, fewer of which are homeowners, had higher correlations than older households is taken as evidence that the co-movement was not driven by wealth effects and instead represented the impact of income expectations.
Muellbauer (2009) provides a counterargument to several of these papers, in particular Attanasio et al. (2009). He uses quarterly U.K. time-series data to show that, even if households had perfect foresight into future income growth, the MPC out of housing would still be significant. He also shows that the result continues to hold when the perfect-foresight assumption is relaxed. Muellbauer reinterprets Attanasio's results, suggesting that they may reflect the impact of housing's role as collateral in relaxing borrowing constraints.
We explicitly address the concerns regarding possible endogeneity between housing and consumption. First, we use a micro panel dataset containing information on both housing and consumption, as opposed to cross-sectional data (Bover), aggregated regional data (Case, Quigley, and Shiller or Calomiris et al.), or panel consumption data combined with regional house price data (Attanasio et al.). The use of panel data allows us to include a measure of the permanent income of the household, in order to control for the extent to which both housing wealth and consumption are simply responding to differences in expected future income. In addition, this approach allows us to take advantage of the significant variation in shocks to home prices within, rather than only between, markets. This intraregional variation can account for a significant amount of the variation in house prices (see Bourassa et al. (2009) and many others). In addition, although self-reported home values may contain significant biases (see Goodman and Ittner (1992)), it is precisely the household perception of changes in home values that drives household changes in consumption, even if these perceptions prove to be incorrect.
The second significant way in which we attempt to address these concerns regarding endogeneity is by focusing on shocks in the rate of appreciation in housing, and not on shocks to housing wealth. As we show in our theoretical section, a household's consumption may respond to shocks to the appreciation rate of housing, even when shocks in the level of housing wealth would have no effect. As mentioned above, restrictions on land, either physical or via zoning, can result in more inelastic supply and greater variation in the response of appreciation rates to exogenous shocks.10
The paper is divided into six sections. Section 2 develops the theoretical arguments on when changes in house prices may affect consumption. Section 3 describes the data we use. Section 4 describes the way we model the house price appreciation process and households' expectation formation. That section also presents some evidence on the divisional variation in the trend and shocks to house prices. Section 5 presents and discusses our results on the divisional variation in the MPC out of housing wealth and on the differentiated responses to permanent and transitory shocks to housing wealth. Section 6 concludes.
2.1 Housing as a risky asset
We develop a simple model that illustrates two key implications of the life-cycle/permanent-income hypothesis. The first implication is the well-known result that households are likely to have bigger changes in consumption in response to an unexpected permanent shock to wealth than in response to an unexpected transitory shock. The second implication, which is an extension from Kimball (1990), is that higher uncertainty in the return to wealth results in higher marginal propensity to consume out of wealth. The intuition behind this second implication is less obvious than the first. In brief, higher uncertainty increases the motive for buffer stock saving, which in turn increases wealth over the life cycle, resulting in wealthier households having a corresponding higher MPC out of further changes in wealth.
In this initial exploration, we have attempted to keep our theoretical model as simple and straightforward as possible. We have left out many of the unique aspects of housing in this setting (but we retake them later), such as its presence in the utility function, the large transaction costs associated with adjusting the level of housing consumption, the use of housing as collateral, and the household's portfolio allocation between housing and financial wealth. The goal of this paper is, besides exploring the geographical variation in consumption responses, to explore the relative impact of permanent and transitory shocks to wealth. We therefore include a single asset, henceforth referred to as housing wealth, in a model that has risky returns with both permanent and transitory shocks. The nature of the shocks is the only innovation we have made to the canonical infinite-horizon consumption model with idiosyncratic income shocks and a single risky asset, which is the only source of insurance given the incomplete markets structure.
Consumption is determined by identical households that receive income shocks and cannot fully insure against them. Partial insurance is given by housing wealth, which in turn has an uncertain return ![]() . Households solve the following problem:
. Households solve the following problem:
 |
(1) |
where
 |
(2) |
The stochastic income is parameterized as
![]() , where
, where
![]() , and the returns to housing are parameterized as
, and the returns to housing are parameterized as
![]() , where
, where
![]() . Note that in the current version of the model the shocks to income and housing wealth are completely independent. This parameterization of the returns to
housing allows us to analyze a range of different cases, from purely permanent shocks (
. Note that in the current version of the model the shocks to income and housing wealth are completely independent. This parameterization of the returns to
housing allows us to analyze a range of different cases, from purely permanent shocks (![]() ) to purely transitory shocks (
) to purely transitory shocks (![]() ).
).
We can then rewrite the household's optimization problem in a dynamic programming framework, with primes (" ![]() ") denoting next-period variables,
") denoting next-period variables,
| (3) |
The first order condition for consumption provides us with the classic Euler equation:
The optimal consumption rule solution consists of a decision rule for consumption as a function of housing wealth in the current period and the realizations of the shocks to income and to the return to housing wealth.
Income is parameterized following Aiyagari (1994) with ![]() and
and
![]() . We choose widely accepted values for
. We choose widely accepted values for ![]() and
and
![]() , indicating a discount rate per year of 0.96 and a model period of 3 years.
, indicating a discount rate per year of 0.96 and a model period of 3 years.
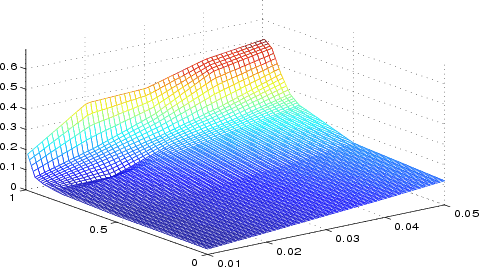
We want to know how the MPC out of housing wealth changes when the persistence parameter and the standard deviation of the shocks change, as well as how consumption responds to permanent and transitory shocks to housing wealth. Table 1 and Figure 1 show the results of the simulations and provide the main implications of the model. The MPC out of housing wealth increases with the persistence and the standard deviation of the shocks. Our simple model thus is able to recreate two key implications of the life-cycle/permanent-income hypothesis we are interested in exploring: permanent shocks to wealth induce higher consumption than transitory shocks, as does a higher variation of shocks.
| Standard deviation (
|
0.01 | 0.02 | 0.03 | 0.04 | 0.05 |
| Persistence ( |
0.0272 | 0.0482 | 0.0706 | 0.0933 | 0.1197 |
| Persistence ( |
0.0316 | 0.0573 | 0.0838 | 0.1139 | 0.1465 |
| Persistence ( |
0.0427 | 0.0807 | 0.1313 | 0.1836 | 0.2398 |
| Persistence ( |
0.0495 | 0.052 | 0.1534 | 0.208 | 0.2779 |
| Persistence ( |
0.0587 | 0.1172 | 0.1828 | 0.2644 | 0.3617 |
| Persistence ( |
0.0791 | 0.162 | 0.2651 | 0.4191 | 0.473 |
| Persistence ( |
0.1804 | 0.3729 | 0.3847 | 0.4669 | 0.505 |
Summarizing, according to the previous model the theoretical predictions are:
- Prediction 1: The MPC increases with the realized level of the shocks.
- Prediction 2: The MPC increases with the persistence of the shocks.
- Prediction 3: The MPC increases with the variation in the shocks.
2.2 Housing as a consumption and as an investment good
This model introduces housing into the utility function, such that households perceive it as an investment and as a consumption good. We also introduce the possibility of borrowing constraints and a price of housing that is different from the numeraire in the model (which represents all other type of consumption). The model is based on Yang (2008) and Li and Yao (2007). We take the notation and the set-up of the problem from Jeske (2005) and follow closely his discussion.
In this model households derive utility from nonhousing consumption ![]() and housing consumption
and housing consumption ![]() . They solve the following problem:
. They solve the following problem:
| (5) |
s.t.
| 0 |
where ![]() is the discount rate,
is the discount rate, ![]() is labor productivity,
is labor productivity, ![]() is the wage rate,
is the wage rate, ![]() is assets at the beginning of the period, and
is assets at the beginning of the period, and ![]() represents other savings.
represents other savings. ![]() represents the portion of the home's value that the
household can borrow against in the market; it may also represent the initial down payment.
represents the portion of the home's value that the
household can borrow against in the market; it may also represent the initial down payment. ![]() is the relative price of housing,
is the relative price of housing, ![]() represents depreciation and
represents depreciation and ![]() represents the lagrange multiplier associated with the borrowing constraint. The first order conditions of
the problem are:
represents the lagrange multiplier associated with the borrowing constraint. The first order conditions of
the problem are:
| (6) | |||
| (7) | |||
| (8) |
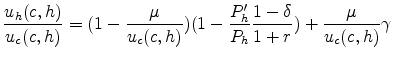
We can combine these to get an intratemporal condition relating housing and nonhousing consumption:
 |
(9) |
In the equations above, one can observe that the borrowing constraint would affect consumption when the lagrange multiplier
On the other hand, increments in prices alone would not affect consumption because an increase in the house prices today implies they will also be higher tomorrow, and because prices enter as a ratio in the user cost of capital component of the equation (8) (this is, in the expression
![]() ), that term does not change. The intuition behind this result is that the wealth effect of a higher house price today is canceled out with the
increase in the cost of housing today and tomorrow, so that households wouldn't change total consumption.
), that term does not change. The intuition behind this result is that the wealth effect of a higher house price today is canceled out with the
increase in the cost of housing today and tomorrow, so that households wouldn't change total consumption.
The conditions under which an increase in house prices do not affect consumption are rarely met. They imply homogeneous consumers and markets, perfectly competitive markets, and correct households expectations. As a result, an increase in the house price today does not necessarily mean an increase of the same amount in the future, even if household expectations about this change are in fact correct. For example, housing markets are heterogeneous and the cost of housing varies enormously from region to region as we will show later. Under those circumstances, by moving to other regions, households could consume the same amount of housing at a lower cost, realizing the wealth gains from the increase in house prices. At the same time, in a world with efficient markets, shocks in house price appreciation would be arbitraged away in the market. But in a market with frictions and heterogeneous consumers and sub-markets like the housing market, those arbitrage possibilities may take time to disappear, and price bubbles might occur, causing the shocks in price appreciation to be perceived as persistent. Because of those reasons, a change in the ratio of prices tomorrow to prices today is likely to happen, in reality affecting total consumption.
3 Data
We use data from the Panel Study of Income Dynamics to analyze the house price process by census division and to calculate the MPC out of total, permanent and transitory shocks to housing appreciation.
The PSID is a longitudinal dataset of a representative sample of U.S. households and the families in which they reside. It started at 1968 with an original focus on the dynamics of poverty, having as a result a disproportionately large number of low-income households in the sample. To accomplish this goal, the survey consists of two independent samples: a cross-sectional national sample drawn by the Survey Research Center consisting of 2,930 interviews, and a national sample of low-income families from the Survey of Economic Opportunity consisting of 1,872 families. In order to obtain a representative sample, each of the individuals has a specific weight in the whole dataset. Since then, individuals belonging to those 4,800 households have been traced by the PSID whether or not they still live in the same household or with the same people. Later additions to the sample are not included in the dataset, specifically the Latino sample included after 1990. We use the data from 1970 to 1995.
Our analysis is limited to an unbalanced subsample of households from the PSID where we observe at least four pairs of subsequent survey years that contain information on both food consumption and self-reported home value. This restriction naturally excludes households that broke-up between survey years. The subsample is limited to households who own their own home, did not move between the two survey years, had two adult members, and had the same number of children in each survey year. We also screen the sample for outliers, excluding observations where the change in consumption or house value was in the upper or lower 1 percent of the sample. The resulting sample consists of 14,831 observations from 2,553 households. As is discussed in more detail below, for purposes of filtering the appreciation shocks to housing, we limit our analysis to households who do not move. The resulting sample consists of 6,959 observations from 1,667 households.
The PSID lacks information on total consumption, so we impute the level of total consumption based on the reported level of food consumption, paying attention to the critique of Attanasio and Weber (1995), who show that food consumption alone is not a good measure of consumption to estimate its
responses to changes in income or other behavioral parameters. We follow Lehnert (2005), who estimates the relationship between total consumption, food away from home, and food at home from the Consumer Expenditure Survey. We use the same coefficients here, so the equation to impute total
consumption is as follow:
![]() .
.
4 The house price appreciation process
House prices vary significantly by division, demonstrating the well-known fact that housing markets are regional (Table 2). Our divisions are New England, Mid-Atlantic, South Atlantic, East South Central, West South Central, East North Central, West North Central, Mountain, and Pacific.
Table 2 shows that the Pacific division has the highest average and median prices, followed by New England, and the West and East South Central divisions have the lowest average and median prices. Prices are most volatile in the Pacific and New England divisions, and least volatile in the West North central division.
In the same table, one can observe that house price appreciation also varies significantly by division. The average nominal house price appreciation between 1975 and 1995 was 6.9 percent, but the median was 3.1 percent and the standard deviation was of 19 percent. This rate of appreciation is slightly higher than that observed by the widely used FHFA repeat-sales house price index, which had an average year-to-year change of 5.7 percent over the same time period. Our results indicate a very skewed house price appreciation across divisions. Once more, the Pacific division reported the highest average appreciation, but the East North Central division had the highest median. The smallest increase in house prices was observed in the Mountain division, and the biggest variation in across house appreciation rates was in the East South Central division.
| Division | Price: Average | Price: Median | Price: Std. dev. | Appreciation: Average | Appreciation: Median | Appreciation: Std. dev. |
| National | 54832 | 40000 | 48775 | 0.0689 | 0.0309 | 0.1938 |
| New England | 75238 | 50000 | 69710 | 0.0617 | 0.0159 | 0.1873 |
| Mid-Atlantic | 55861 | 45000 | 43799 | 0.0756 | 0.0390 | 0.1837 |
| South Atlantic | 53341 | 40000 | 45265 | 0.0641 | 0.0149 | 0.1986 |
| East South Central | 38228 | 30000 | 28132 | 0.0700 | 0.0264 | 0.2224 |
| West South Central | 37414 | 30000 | 27157 | 0.0669 | 0.0000 | 0.2163 |
| East North Central | 47999 | 40000 | 33818 | 0.0663 | 0.0435 | 0.1841 |
| West North Central | 40987 | 37000 | 24644 | 0.0658 | 0.0351 | 0.1944 |
| Mountain | 46588 | 45000 | 25568 | 0.0577 | 0.0119 | 0.1831 |
| Pacific | 88500 | 65000 | 76992 | 0.0809 | 0.0395 | 0.1848 |
4.1 The house price model
We define returns to housing for individual ![]() in time
in time ![]() as
as
![]() , where
, where ![]() is the house price
at time
is the house price
at time ![]() . In this case, returns to housing have a trend
. In this case, returns to housing have a trend
![]() that depends on a vector of house characteristics
that depends on a vector of house characteristics ![]() , and a shock
component denoted by
, and a shock
component denoted by ![]() :
:
The
Shocks to house price appreciation were on average negative, although very small (0.1 percent). New England had on average the most negative shocks to house appreciation, but the variation was highest among households living in the East South Central division (see Table 3).
| Division | Average | Median | Std. dev. |
| National | -0.001 | -0.031 | 0.192 |
| New England | -0.027 | -0.051 | 0.181 |
| Mid-Atlantic | -0.003 | -0.040 | 0.184 |
| South Atlantic | -0.001 | -0.030 | 0.197 |
| East South Central | -0.001 | -0.034 | 0.223 |
| West South Central | 0.018 | -0.015 | 0.216 |
| East North Central | 0.001 | -0.025 | 0.183 |
| West North Central | -0.003 | -0.027 | 0.192 |
| Mountain | -0.004 | -0.028 | 0.179 |
| Pacific | -0.002 | -0.043 | 0.182 |
We further decompose the shock term from equation (10) into permanent and transitory shocks to housing wealth as follows:
| (11) |
where
4.2 A simple decomposition of trend vs. cycle in house prices
We first use a simple filter to separate the permanent and the transitory shocks to house prices, that proposed by Hodrick and Prescott (1997) to separate trends from cycles in the business cycle literature. This filter is widely used in macroeconomics with time-series data, but to our knowledge
this is the first application to panel data. The objective of the filter is to separate the components of the process
![]() , by minimizing the following expression:
, by minimizing the following expression:
![]() , where
, where ![]() is a penalty parameter. The first term penalizes the variance of the transitory component
is a penalty parameter. The first term penalizes the variance of the transitory component
![]() , while the second term penalizes the variations in the growth rate of the trend component. As
, while the second term penalizes the variations in the growth rate of the trend component. As ![]() approaches 0, the trend component becomes equivalent to the original series, whereas
approaches 0, the trend component becomes equivalent to the original series, whereas ![]() approaches infinity,
approaches infinity, ![]() approaches the linear trend. Large values of
approaches the linear trend. Large values of ![]() are commonly used for monthly data (around 100,000).
For annual data, values between 6 and 14 are used. The reason for these choices is that the higher the value of
are commonly used for monthly data (around 100,000).
For annual data, values between 6 and 14 are used. The reason for these choices is that the higher the value of ![]() , the greater the weight in minimizing the variations in the growth rate
of the trend (noisy data).
, the greater the weight in minimizing the variations in the growth rate
of the trend (noisy data).
We use annual data from the PSID and choose a value of 10 for ![]() . We first estimate a hedonic regression for the rate of appreciation of housing based on housing valuations in the
PSID to obtain the component
. We first estimate a hedonic regression for the rate of appreciation of housing based on housing valuations in the
PSID to obtain the component
![]() . We then run the residuals from this regression,
. We then run the residuals from this regression, ![]() , through an HP
filter to separate the individual-level shocks into their permanent and transitory components. Using these measures of transitory and permanent shocks, we calculate the average level and variance by division of the permanent shocks and the variance of the transitory shocks.11
, through an HP
filter to separate the individual-level shocks into their permanent and transitory components. Using these measures of transitory and permanent shocks, we calculate the average level and variance by division of the permanent shocks and the variance of the transitory shocks.11
According to this decomposition (Table 4), the average national permanent shocks to house price appreciation is about 1 percent, with a standard deviation of 7.9 percent. The distribution is very skewed, and the median is only 0.4 percent. On the other hand, the standard deviation of the transitory shocks is 17 percent, much higher than the variance of the permanent shocks. On average, transitory shocks are very small (as they should be), on the order of 0.1 percent, perhaps reflecting some measurement error bias. The division with the highest permanent average shock is the West South Central division, followed by the Pacific division. The West South Central division also has the highest dispersion in permanent shocks, followed again by the Pacific division. The dispersion in the transitory shocks is more even across divisions, although the East South Central division has a slightly higher value than other divisions.
| Division | Permanent ( |
Permanent ( |
Permanent ( |
Transitory( |
Transitory( |
Transitory( |
| National | 0.011 | 0.004 | 0.079 | -0.008 | -0.016 | 0.170 |
| New England | 0.002 | 0.002 | 0.075 | -0.022 | -0.026 | 0.158 |
| Mid-Atlantic | 0.009 | 0.000 | 0.073 | -0.010 | -0.022 | 0.168 |
| South Atlantic | 0.010 | 0.005 | 0.079 | -0.004 | -0.014 | 0.175 |
| East South Central | 0.011 | 0.005 | 0.082 | 0.001 | -0.015 | 0.196 |
| West South Central | 0.025 | 0.015 | 0.093 | -0.001 | -0.015 | 0.188 |
| East North Central | 0.006 | 0.004 | 0.065 | -0.003 | -0.013 | 0.162 |
| West North Central | 0.014 | 0.004 | 0.074 | -0.013 | -0.017 | 0.173 |
| Mountain | 0.010 | 0.002 | 0.085 | -0.007 | -0.017 | 0.155 |
| Pacific | 0.015 | 0.006 | 0.090 | -0.017 | -0.022 | 0.156 |
We next obtain the persistence parameter by regressing the individual permanent shocks on its lags, and the variance of the permanent shocks is given by the expression
![]() . Results are shown in Table 5. At the national level, the persistence parameter is around 0.8 and the standard deviation is 7.9 percent. New England and
the Mid-Atlantic divisions have the highest persistence in house shocks appreciation, and the Mountain division has the lowest. Consistent with previous results, the West South Central division has the highest variation in permanent shocks.
. Results are shown in Table 5. At the national level, the persistence parameter is around 0.8 and the standard deviation is 7.9 percent. New England and
the Mid-Atlantic divisions have the highest persistence in house shocks appreciation, and the Mountain division has the lowest. Consistent with previous results, the West South Central division has the highest variation in permanent shocks.
(
| Division | Persistence ( |
Std. dev.(
|
| National | 0.811 | 0.079 |
| New England | 0.940 | 0.075 |
| Mid-Atlantic | 0.870 | 0.073 |
| South Atlantic | 0.711 | 0.079 |
| East South Central | 0.863 | 0.082 |
| West South Central | 0.785 | 0.093 |
| East North Central | 0.840 | 0.065 |
| West North Central | 0.787 | 0.074 |
| Mountain | 0.704 | 0.085 |
| Pacific | 0.849 | 0.090 |
4.3 A learning process for the trend vs. cycles in house prices
We next model household learning as a process in which households observe their own house prices and know the conditions of the market, but cannot distinguish between the permanent and the transitory component of price shocks. In the process we model, households know the underlying parameters of the house price process from the beginning, learn about the permanent and transitory components of the observed house price over time, and update their beliefs each period to predict the next observation.
In our second model, we parameterize further the shocks to the house price process, in terms of the appreciation rate, as follows:
![\displaystyle \left[ \begin{array}{c} \nu_{i,t}\\ \epsilon_{i,t} \end{array}\right]](img78.gif)
![\displaystyle N\left( 0,\left[\begin{array}{cc} \sigma_{\nu}^2&0\\ 0&\sigma_{\epsilon}^2 \end{array}\right] \right)](img80.gif)
where
We need to know the parameters governing the house price process that are known to the household in order to determine the permanent and transitory components of the shock. In particular, we need to obtain estimates of the variances of the transitory and permanent shocks.
One approach to determining the initial parameter values is to use the permanent and transitory shocks produced by the HP filter. We can directly observe the variance of the HP transitory shocks, and using an AR(1) process we can estimate the persistence and variance of the permanent shocks. This assumes that households could use the entire history of HP-filtered shocks to determine the initial parameter values for the Kalman learning process.
In a second approach, we use a minimum distance (MD) procedure to solve for the variances and the persistence parameter (that is, to solve for the vector
![]() ]). The MD estimation procedure is widely used in the estimation of the income process.12 Following Chamberlain (1984), in a panel of dimension
]). The MD estimation procedure is widely used in the estimation of the income process.12 Following Chamberlain (1984), in a panel of dimension ![]() , with
, with ![]() individuals and
individuals and ![]() periods, this procedure consists in choosing
periods, this procedure consists in choosing
![]() to minimize the distance between the sample mean of the moments
to minimize the distance between the sample mean of the moments ![]() ,
,
![]() and the theoretical moments
and the theoretical moments ![]() :
:
| (15) |
Altonji and Segal (1996) recommend the use of an identity matrix for
The moments conditions we use are the following:
|
(16) |
Using this procedure, we obtain a point estimate for the persistence of the permanent shock to housing prices of
![]() ; we also obtain the variance of the permanent shocks to housing
; we also obtain the variance of the permanent shocks to housing
![]() , and the variance of the transitory shocks to housing
, and the variance of the transitory shocks to housing ![]() .
If we run the same model with the appreciation instead of the level, we get
.
If we run the same model with the appreciation instead of the level, we get
![]() ,
,
![]() and
and
![]() .
.
Having determined the parameter values that describe the house price process, we can turn to the learning process that households face to determine the permanent and transitory shocks to their wealth. The first possible learning process (and the simplest) assumes that households know the price
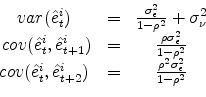
process (12)-(14). In this case households form expectations about the decomposition of the permanent and transitory shocks to house prices with the information they have at time ![]() . Their information set is given by
. Their information set is given by
![]() . Equations (12) and (13) give the measurement equation:
. Equations (12) and (13) give the measurement equation:
| (17) |
which describes the relationship between the observed variable
In matrix form, the measurement equation is given by:
![\displaystyle \left[\rho\quad 1\quad 1\right]\left[\begin{array}{c} h_{i,t-1}\\ \epsilon_{i,t}\\ \nu_{i,t} \end{array}\right]](img111.gif) |
and the transition equation in matrix form is given by:
![\displaystyle \left[\begin{array}{c} h_{i,t} \\ \nu_{i,t}\end{array}\right]](img114.gif) |
![\displaystyle \left[\begin{array}{cc} \rho & 0\ 0&0\end{array}\right]\left[\begin{array}{c} h_{i,t-1} \ \nu_{i,t-1}\end{array}\right]+\left[\begin{array}{cc} 1 & 0\ 0&1\end{array}\right]\left[\begin{array}{c} \epsilon{i,t} \ \nu_{i,t}\end{array}\right]](img115.gif) |
with
![]() and
and
![Q=\left[\begin{array}{cc}\sigma_{\nu}^2&0\\ 0&\sigma_{\epsilon}^2\end{array}\right]](img117.gif) .
.
The optimal estimator of
![]() considers all the information in
considers all the information in ![]() and is given by
and is given by
![]() . The optimal estimator that minimizes the mean squared error is linear and given by
. The optimal estimator that minimizes the mean squared error is linear and given by
| (18) |
where
| (19) |
Table 6 shows the decomposition of the shocks using the Kalman filter using the permanent and transitory shocks produced by the HP filter as initial values. The permanent shocks to house appreciation are smaller than in the case of the HP filter (0.1 percent), and the dispersion is higher for the permanent shocks than for the transitory shocks. However, the West South central division again shows the highest average permanent shocks, and this time the second-highest dispersion of the permanent shocks, and the East South central division has the highest dispersion of the transitory shocks.
| Division | Permanent: Average | Permanent: Median | Permanent: Std. dev. | Transitory: Average | Transitory: Median | Transitory: Std. dev. |
| National | 0.001 | -0.022 | 0.154 | 0.000 | -0.001 | 0.042 |
| New England | -0.019 | -0.045 | 0.147 | -0.003 | -0.002 | 0.039 |
| Mid-Atlantic | 0.000 | -0.030 | 0.150 | -0.001 | -0.001 | 0.041 |
| South Atlantic | 0.002 | -0.022 | 0.155 | -0.001 | -0.001 | 0.043 |
| East South Central | 0.001 | -0.026 | 0.176 | 0.001 | -0.002 | 0.053 |
| West South Central | 0.020 | -0.011 | 0.173 | 0.003 | 0.000 | 0.047 |
| East North Central | 0.002 | -0.016 | 0.144 | 0.000 | -0.001 | 0.040 |
| West North Central | -0.002 | -0.018 | 0.156 | -0.002 | -0.002 | 0.043 |
| Mountain | -0.003 | -0.023 | 0.151 | 0.002 | -0.001 | 0.035 |
| Pacific | -0.001 | -0.035 | 0.152 | -0.001 | -0.002 | 0.040 |
5 Consumption and housing wealth: Empirical issues and identification strategy
We test in this section whether shocks to house appreciation affect nonhousing consumption. As discussed in section 2.2, a shock to housing wealth alone should not necessarily affect nonhousing consumption, because it implies a change in future housing prices as well, leaving the ratio of future to current prices constant, and according to equation (8), only movements in this ratio affect consumption. A shock to house price appreciation should affect consumption because it implies a change in the return on a risky asset, because it affects the ratio of housing to nonhousing consumption and because it relaxes the households borrowing constraints.
We test a version of the Euler equation (4) and (6), where borrowing constraints explicitly affect consumption.13 This is especially important in the case of housing, because one of the main roles housing has in consumption is to serve as collateral.
We can take the first order condition for consumption in equation (4) and derive a log-linearized Euler equation that we can then estimate assuming a CRRA utility function.14 Considering this equation, the model we estimate is:
| (20) |
where
The vector ![]() is included to control for household-specific effects. We include the size of the family, and the age and the age squared of the household's head to control for
household composition. We include a dummy variable for households whose head completed college, and another for households whose head did not complete high school to control for education effects, as well as a dummy variable for black heads of households. The vector
is included to control for household-specific effects. We include the size of the family, and the age and the age squared of the household's head to control for
household composition. We include a dummy variable for households whose head completed college, and another for households whose head did not complete high school to control for education effects, as well as a dummy variable for black heads of households. The vector ![]() also includes a set of variables to control for year and divisional fixed effects. We control for the impact of income changes on consumption by including the change in the log of family income. Theory indicates
that consumption will respond to changes in shocks to permanent income. In fact, some of the criticism by Calomiris et al. and Attanasio et al. is based on the fact that shocks to permanent income should influence both current consumption and house prices in the same manner. In order to control for
those factors, we include a measure of the household's permanent income, following Lehnert (2005), defined as the average change in log income for that household from 1968 to 1997.
also includes a set of variables to control for year and divisional fixed effects. We control for the impact of income changes on consumption by including the change in the log of family income. Theory indicates
that consumption will respond to changes in shocks to permanent income. In fact, some of the criticism by Calomiris et al. and Attanasio et al. is based on the fact that shocks to permanent income should influence both current consumption and house prices in the same manner. In order to control for
those factors, we include a measure of the household's permanent income, following Lehnert (2005), defined as the average change in log income for that household from 1968 to 1997.
The MPC is defined as the estimated elasticity times the average ratio of total consumption to house value:
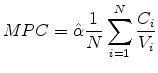 |
(21) |
Our identification strategy uses variation across census divisions in house price appreciation to identify how movements in that variable across households affect consumption changes. Our panel data configuration allows us to control for the effects of correlation between the error terms and to separate a causal effect, given the cross-sectional variation due to geographical location. Importantly, we focus on the shocks to house appreciation and not on house price shocks alone for the reasons mentioned in the theoretical section.
As was mentioned in the introduction, some recent papers (Attanasio et al. (2009), Calomiris et al (2009)) have argued against a causal link between consumption and housing wealth, and instead proposed that the observed correlation between the variables is due to a common third factor such as expected permanent income. This argument relies on the standard Euler equation specification in which changes in consumption should not respond to expected changes in the information set households use to decide consumption. In that sense, a change in housing wealth would imply a change in permanent income, with consequent effects on consumption. Our specification controls for a variable that includes permanent income. Moreover, as Muellbauer (2009) argues, even if the argument by Attanasio et al. and Calomiris et al. is true, the relaxation in the borrowing constraints because of higher house prices would imply higher consumption for some consumers. We test this possibility by running an instrumental variable procedure, instrumenting current shocks to house price appreciation with the lag of those shocks. Although the results are statistically weaker, we obtain a similar quantitative effect with a level of significance of 10%.15
5.1 Divisional variation in the MPC and effect of persistence and variance of wealth shocks in consumption
Table 7 reports estimates of the MPC out of housing wealth by census division. Although this initial exercise makes no attempt to explore the connection between the MPC and the nature of the shocks to housing, it does demonstrate the extent to which the MPC out of housing does vary geographically. Households in New England, the South Atlantic, the Pacific, and the East North Central divisions will consume about 2.5 percent to 3.0 percent of any increase in housing wealth, while households in the West South Central, West North Central, and Mountain states do not seem to significantly adjust their consumption at all in response to changes in home values. Households in the East South Central division have the highest estimated MPC out of housing wealth, at 8.0 percent. We are somewhat suspicions of this estimate, given its significant difference from estimates in other divisions and the fairly small sample size in the division (842 observations, the third smallest). Relatively small sample sizes also prevent us from generating estimates of the MPC out of housing wealth for smaller geographical areas. Attempts to generate state-level estimates resulted in significant elasticities for only 5 of the 35 states in our sample.
It is interesting to note that we observe significantly more dispersion across census divisions among the elasticity estimates than among the estimates of the MPC out of housing wealth. This relates to one of our initial hypotheses. The elasticity of consumption to housing wealth will be higher in areas with more cyclical changes in house prices due to relatively inelastic housing supply. It is precisely these areas that also have higher housing values, and thus lower ratios of consumption to house value. As a result, two of the divisions with the most cyclical house prices (New England and the Pacific) have some of the highest elasticity estimates (5.98 percent and 5.27 percent, respectively) and lowest ratios of consumption to house value (53.2 percent and 47.2 percent, respectively). The result is a certain convergence in our estimates of the MPC out of housing wealth across divisions. As noted before, the East South Central division remains an outlier, with the highest elasticity estimate (9.16 percent) and the highest ratio of consumption to house value (86.7 percent).
| Division | Elasticity | Imputed C/V | MPC |
| New England | 0.0598 * (0.0370) |
0.5318 | 3.17% |
| Mid-Atlantic | 0.0189 (0.0230) |
0.6128 | 1.16% |
| South Atlantic | 0.0388 *** (0.0147) |
0.8134 | 3.16% |
| East South Central | 0.0916 *** (0.0293) |
0.8671 | 7.94% |
| West South Central | 0.0251 (0.0232) |
0.8155 | 2.05% |
| East North Central | 0.0419 ** (0.0209) |
0.6310 | 2.64% |
| West North Central | 0.0148 (0.0218) |
0.6646 | 0.98% |
| Mountain | 0.0210 (0.0453) |
0.9953 | 2.09% |
| Pacific | 0.0527 ** (0.024) |
0.4720 | 2.49% |
The divisional variation in the consumption elasticity of housing wealth allows us to test some of the implications of the model, namely, that the higher the persistence, the higher the consumption elasticity of housing wealth; and that the higher the variance, the higher the consumption elasticity of housing wealth. We perform this test using the elasticity estimates instead of the MPC estimates to take advantage of the greater variation across divisions of the elasticity estimates.
| Persistence | Permanent Variance | Transitory Variance | |
| Including East South Central | 0.5406 | 0.2767 | 0.0572 |
| Excluding East South Central | 0.6855 | 0.7238 | -0.6265 |
Table 8 reports estimates of the correlation between the elasticity estimates in Table 7 and the estimates of the persistence and variances of the appreciation shocks from Tables 4 and 5. These results are roughly consistent with the theoretical model. The degree of persistence in house appreciation shocks is positively correlated with higher consumption elasticities of housing wealth. Divisions with higher degrees of permanent variance also have higher consumption elasticities of housing wealth, consistent with the theoretical implications. The negative correlation between the elasticity estimates and the transitory variance runs counter to our theoretical results, but might represent the role of housing as collateral and the household's fear of a large transitory shock temporarily pushing home equity negative and thus limiting their mobility.
The results based on these divisional estimates of the MPC come with some significant caveats. We base this analysis on a very small sample size, with degrees of freedom of only 7 or 8. As was mentioned above, attempts to increase the sample size by generating elasticity estimates at the state level proved problematic. We are also limited by the number of observations in each division, which results in rather large standard deviations for our elasticity estimates. We were unable to reject the hypothesis that the elasticity estimates across divisions were statistically equal from each other, and were only able to show that the MPC estimates for the East South Central and South Atlantic divisions were statistically significantly different from those for the other divisions. The inability to find statistically significantly differences in the MPC across divisions in part reflects the small sample size for the divisional estimates.
5.2 MPC out of transitory and permanent shocks to housing wealth
Table 9 reports the main results of the paper: (1) The total elasticity is about 5%, is statistically significant different from zero, and corresponds to a MPC out of total wealth of 3.5%, (2) The consumption responses to permanent shocks to house price appreciation are generally higher than those to transitory shocks. In particular, the MPC out of permanent shocks to housing wealth is between 3.5 and 9.2 cents for a 1-dollar shock increase in house price appreciation, and in the case of responses to transitory shocks, the MPC is between 0.5 and 3.7 cents.
The difference between the MPC out of permanent and transitory shocks is by far the greatest when the HP filter is used. This method does not assume any learning process, and the ability to differentiate permanent and transitory shocks over time does not change. When we assume a Kalman learning process and take the parameters for the house price process from the HP filter, transitory shocks have no effect on consumption. When we assume a Kalman learning process with the underlying parameters derived from GMM, households lose their ability to identify the permanent and transitory shocks and treat them the same.16 The MPC obtained using the Kalman filter is very similar in the case of the temporary and permanent shocks and for the total shock. This suggest that households are not able to identify transitory or permanent shocks if we assume that they start with no prior assumptions based on actual observations of the house price process.
Our results in the case of the total shocks are somewhat lower but in line with previous estimates, like those of Benjamin, Chinloy, and Jun (2004) (8%) or Bostic, Gabriel, and Painter (2009) (5.7%). Our estimates for the elasticity to permanent shocks to housing wealth are nearer the higher end of the ranges estimated in previous studies, while our estimate of the elasticity to temporary shocks are significantly lower.
| Elasticity: Total | Elasticity: Permanent | Elasticity: Transitory | MPC: Total | MPC: Permanent | MPC: Transitory | |
| Total Shocks | 0.05099 (0.01487) |
0.035 | ||||
| HP Filter | 0.13323 (0.0597) |
0.04768 (0.01958) |
0.092 | 0.033 | ||
| Kalman filter using parameters from HP filter | 0.04998 (0.02975) |
0.00834 (0.14491) |
0.034 | 0.005 | ||
| Kalman filter using parameters from GMM | 0.05124 (0.02579) |
0.05404 (0.02579) |
0.035 | 0.037 |
6 Conclusions
The goal of this paper was to take advantage of the geographical variation in house price processes to identify how the MPC varies by census division and how it differs between permanent and transitory shocks. We developed some simple theoretical models that show how the MPC is increasing with the degree of persistence and the variance of the house price shocks, and how consumption may respond to housing appreciation shocks. Using food consumption from the PSID, we found empirical evidence to support this theoretical conclusion, and we showed how the MPC out of housing appreciation shocks varies by division. Finally, we estimated the MPC separately out of permanent and transitory shocks to housing wealth appreciation under different learning regimes.
A recent criticism of the finding of a significant MPC out of housing has been the possibility that observed correlations between changes in consumption and housing wealth are not causal, but are in response to some common factor, such as changes in expected future income. We addressed these concerns in a variety of ways, such as including measures of permanent income in the model specification, using instrumental variables to test the robustness of our results, utilizing the great intraregional variation in self-reported individual home values, and focusing on shocks to the appreciation rate of housing and not the level of housing wealth. Our theoretical results show that such appreciation shocks do impact current-period consumption, even if shocks to housing wealth would not, and in the absence of binding collateral constraints.
Our estimates of the elasticity of consumption to housing wealth by division showed significant variation. New England and the Pacific regions have some of the highest estimates of elasticity, while the estimates were insignificant in much of the middle of the country. We also observed a significant positive correlation between estimates of the persistence and permanent variance of the house price processes and the elasticity estimates, consistent with our theoretical results.
We then used two statistical filters to separate the individual shocks to home appreciation in the PSID as a way of modeling households' expectations. We found that the MPC out of permanent shocks was higher than that out of transitory shocks. The gap was greatest for the shocks identified with the HP filter. When we used the parameters from the HP filter to represent a household's prior knowledge for a Kalman filter, we found that the MPC from the transitory shocks was no long significant. When we instead used the GMM method to identify the parameters for the Kalman filter, the MPCs out of the permanent and transitory shocks were close to equal. Estimates of the MPC out of permanent shocks to housing are significant for all specifications and range from 3.4% to 9.2%. The estimates of the MPC out of transitory shocks are more dependent on the assumptions made regarding household's expectations.
Footnotes
 , we can derive the equation
![\displaystyle \Delta log(C_{t+1})=\frac{1}{\gamma}[E_t log(1+r_{t+1})+log (\beta)]+\frac{\gamma}{2}var_t(\Delta log(C_{t+1})-\frac{1}{\gamma}log(1+r_{t+1}))+\epsilon_{t+1}](img135.gif) |
The variance term is proxied in the empirical implementation by changes in income. This is often one of the explanations given for the failure of orthogonality tests in consumption (where changes in income are not correlated with changes in consumption). Return to Text