
The Role of Specific Subjects in Education Production Functions: Evidence from Morning Classes in Chicago Public High Schools
Keywords: Education, absences, course grades, test scores
Abstract:
JEL Classifications: I20, I21, J13
I. Introduction
Initiatives to improve student performance are often targeted in "core" subjects such as math and science, and these areas are typically less susceptible than other subjects are to budget cuts (Cravey, 2009; Jordan, 2008; National Math and Science Initiative, 2008; Van Harken, 2003). Nevertheless, recent evidence suggests that math and science teachers are underpaid relative to their opportunity costs (Chingos and West, 2009). While incentives are sometimes provided for teachers in "critical shortage areas" such as math and science, public school teacher salaries are often set independent of the subject taught (Chicago Public Schools, 2009; Los Angeles Unified School District, 2009; New York Department of Education, 2009a, 2009b). Allocations of school resources across course subjects are controversial, and considerable disagreement exists regarding the relative importance of instruction in technical versus creative skills (Eisner, 2004; Greenspan, 2000; Holt, 1997; Ingersoll and Perda, 2009; Murnane and others, 1991; National Academy of Sciences, 2006; Rochester, 2002; The Winston Group, 2006).
In this paper, we examine one important aspect of this problem - the degree to which student achievement is tied to skills learned in particular classes. More specifically, we measure the marginal effects of classroom attendance in specific subjects on grades and test scores in those subjects. Additionally, we measure the degree to which attendance in one subject has spillover effects onto performance in other subjects.
While many studies find that exogenously increasing schooling raises test scores (Cooper et al., 1996; Hansen, under revision; Hansen, Heckman, and Mullen, 2004; Krashinsky, 2009) and later wages (see Card, 1999 for a review), surprisingly little is known about the role of different course subjects in generating those returns. Some recent studies at the college level find that later earnings were higher for displaced workers who enrolled in technical classes in community college than for those who enrolled in other subjects (Jacobson, LaLonde, and Sullivan, 2005) and that skipping college classes reduces performance in those classes (Dills and Hernández-Julián, 2008; Dobkin, Gil, and Marion, under revision). However, much of the policy debate focuses on the relative importance of different subjects in elementary and secondary education, for which there is little empirical evidence. One recent and notable exception by Dee and Cohodes (2008) examines how having a teacher who is trained or certified in a subject affects eighth graders' performance in that subject. Using data with two subject-specific tests per student and controlling for student fixed effects, the authors find that having a math teacher who is state-certified in math increases math test scores by 0.12 standard deviations and that having a social studies teacher who is state-certified in social studies increases social studies test scores by 0.08 standard deviations. The authors find considerably smaller effects for science and English.
The current study contributes to the literature on subject-specific inputs and performance by examining the effects of exogenous differences in course scheduling in Chicago Public High Schools. After students select the courses that they will take in a semester, the ordering of classes over the day is a computerized and essentially random process that is determined based on scheduling constraints. One common form of absenteeism that is observed in high school is late arrival. For the typical Chicago Public High School student, attendance is roughly six days per year lower in first period classes than in other periods of the day. Hence, a student who has mathematics as a first period class is likely to receive about six fewer days of math instruction per year than an otherwise identical student who has physical education as a first period class. To the extent that missing math classes reduces students' test scores in math, we should expect students who take math in first period to perform worse than average on standardized tests in math, and we would expect similar negative effects of having English or social studies first period on reading test scores.
Unfortunately, our identification strategy does not enable us to disentangle the indirect effects of morning classes on test scores (through the channel of absenteeism) from the direct effects (through the channel of morning grogginess). Nevertheless, we are able to measure the degree to which having a key subject in first period negatively affects performance in that subject, and we are able to estimate the importance of spillover effects onto related subjects as they compare to the own-subject effects. Additionally, if we suppose that the grogginess effect is known to be negative, then we can identify a lower (negative) bound on the effects of absenteeism.
Our data are taken from Chicago Public Schools administrative files and include the ordering of classes over the day, teacher-recorded absences, course titles, grades, scores from standardized tests in math, science, reading, and English, and demographic characteristics for the universe of Chicago Public High School students from 1993-94 to 2005-06.
We find that the effect of having a class in first period increases absences in that subject by three to seven days over the year, and it decreases class performance in that subject by 0.09 to 0.17 grade points on a 4-point grading scale. These results are consistently significant and are stable across specifications and course subjects. The negative effect of first period on course grades may occur because absences and grogginess cause students to learn less than they otherwise would; however, much of the relationship is probably attributable to teachers implicitly or explicitly factoring absences into their grade calculations. Moreover, we find no evidence of cross-subject effects of having a class in first period on class performance in similar subjects or on performance in that same subject in the following year. Hence, any skills that students failed to acquire due to absenteeism and grogginess were specific to that particular class and do not appear to have had negative spillover effects on related classes.
While imprecisely estimated and generally insignificant, we find some moderately-sized negative effects of having a class in first period on the growth in test scores in that subject over the year. We observe negative effects of first period on test score growth for math classes, and we find negative spillover effects of having math in first period on test score growth in science and reading. We observe negative effects of first period foreign language on reading and English (but not on math or science) test score growth. We also observe net negative effects of first period science, English, and social studies on test score growth; however, these effects do not appear to follow a clear subject-specific pattern.
We also observe some negative own-subject and cross-subject effects of first period science, foreign language, and to a lesser extent social studies classes. We obtain mixed results for English classes. Our estimated effects on test scores are comparable to previous quasi-experimental estimates. Hansen (under revision) finds that, among third, fifth, and eighth graders in Colorado, Maryland, and Minnesota, a missed day of school reduces test scores by roughly 0.01 standard deviations, and Jacob and Lefgren (2004) find that attending a remedial summer school has roughly zero effect on Chicago sixth graders' math and reading scores. If we suppose that all of the negative effects that we find of first period math on math test score growth are attributable to missed days of instruction, our estimated effects range from -0.002 to -0.007 standard deviations per day missed, respectively.
II. Empirical Framework
We can model the effects of absenteeism on course grades and test scores in different subjects according to the following structural equation:
| (1) |
, where
The parameters of interest are
![]() , the direct effect of absences in subject
, the direct effect of absences in subject ![]() on performance in that
subject, and
on performance in that
subject, and
![]() , the spillover effects of absences in subject
, the spillover effects of absences in subject ![]() on performance in
subject
on performance in
subject ![]() . Because absences are not randomly assigned across subjects, estimating Equation (1) using ordinary least squares (OLS) will produce biased estimates of these parameters.
. Because absences are not randomly assigned across subjects, estimating Equation (1) using ordinary least squares (OLS) will produce biased estimates of these parameters.
To address this problem, we can model
![]() as an endogenous variable that is determined by the following first-stage equation:
as an endogenous variable that is determined by the following first-stage equation:
| (2) |
, where
![]() is an indicator for whether subject
is an indicator for whether subject ![]() is student
is student ![]() 's first period class in year
's first period class in year ![]() . Because students often arrive to school late,
. Because students often arrive to school late,
![]() is expected to be positive. As a maintained assumption, we require that
is expected to be positive. As a maintained assumption, we require that
![]() is uncorrelated with the unobserved student-, classroom-, or school-level determinants of subject-specific performance described by
is uncorrelated with the unobserved student-, classroom-, or school-level determinants of subject-specific performance described by
![]() . Given this restriction, we could estimate
. Given this restriction, we could estimate
![]() and
and
![]() using two-stage least squares, where Equation (2) is the first-stage equation for absences in each subject
using two-stage least squares, where Equation (2) is the first-stage equation for absences in each subject ![]() . The corresponding reduced-form equation can be expressed as:
. The corresponding reduced-form equation can be expressed as:
| (3) |
One major concern in identifying
![]() and
and
![]() is the exclusion restriction that
is the exclusion restriction that
![]() only affects student achievement through the channel of absenteeism. This assumption will be violated if first period is associated with unusually high rates of
tardiness or morning grogginess - variables that are likely to have their own negative effects on performance - so that instrumental variables estimates of
only affects student achievement through the channel of absenteeism. This assumption will be violated if first period is associated with unusually high rates of
tardiness or morning grogginess - variables that are likely to have their own negative effects on performance - so that instrumental variables estimates of
![]() and
and
![]() would overstate the magnitude of the true effects of absenteeism. Due to this limitation, we do not present two-stage least squares estimates in this study, and we focus
solely on the reduced-form effects of first period classes. Even if first period does have these auxiliary effects, comparing the reduced-form coefficients
would overstate the magnitude of the true effects of absenteeism. Due to this limitation, we do not present two-stage least squares estimates in this study, and we focus
solely on the reduced-form effects of first period classes. Even if first period does have these auxiliary effects, comparing the reduced-form coefficients
![]() and
and
![]() across different subjects can still provide useful evidence on the relative importance of instruction in different subjects. The reduced-form parameters can in this case be
interpreted as the combined effects of first period through these multiple channels.
across different subjects can still provide useful evidence on the relative importance of instruction in different subjects. The reduced-form parameters can in this case be
interpreted as the combined effects of first period through these multiple channels.
III. Data and Sample Characteristics
A. Data Sources
The data for this study cover the universe of students in Chicago Public Schools from 1993-94 to 2005-06. These data have been used to study a variety of topics including high stakes testing (Jacob, 2005; Jacob and Levitt, 2003), school choice (Cullen, Jacob, and Levitt, 2005, 2006), teacher hiring (Aaronson, Barrow, and Sander, 2007), student crime (Jacob and Lefgren, 2003), and remedial summer school (Jacob and Lefgren, 2004, 2009). Our analysis will focus on students in grades 9-12, for which high school transcript data are available. These transcript data include course title and number, absences, period of the day, and a teacher identifier for each class taken. The data also include multiple standardized test scores and a detailed set of descriptive variables about the individual students and the Census blocks in which they live.2
To construct our evaluation sample, we begin with a dataset that includes about six or seven observations per student per semester, one for each course taken. We then take classroom-level averages of the variables of interest. Each classroom is uniquely identified in the data by period of the day, semester, and unique school and teacher identifiers. We classify some courses as advanced, low-level, or bilingual based on their titles.3 Averages for each student characteristic are computed from the students with non-missing values for those variables. Students' letter grades are converted into a four-point numerical scale (4.0 = A). To measure cross-subject effects, variables such as "average absences in math" and "average grade in social studies" are computed for every classroom, regardless of subject. Each student who took at least one math class that semester is counted once in the classroom-level average with absences or grade level equal to that student's personal average across the different math classes taken that semester.4 Year-long absences in each subject are computed as the sum of the fall and spring average absences for that classroom, and year-long grades in each subject are computed as the average of the fall and spring average grades for that classroom. The numbers of classes taken that year in each subject are included as control variables in all of the regressions. Charter, magnet, and vocational schools are dropped from the sample as are classes meeting in period eight or later. The remaining sample includes 82 high schools.5 The standard errors in all of the regressions are clustered at the level of the school and year combination.
The standardized tests that were administered and the grades of students who took them vary from year to year in our sample. Consequently, the sample of classrooms for which test score data are available is smaller than the sample for which absences and course grades are observed. For the
majority of students, 8![]() grade math and reading scores are available from the Iowa Test of Basic Skills (ITBS). For the more recent years, math, science, reading, and English scores are
available from the 9
grade math and reading scores are available from the Iowa Test of Basic Skills (ITBS). For the more recent years, math, science, reading, and English scores are
available from the 9![]() grade EXPLORE and the 10
grade EXPLORE and the 10![]() and 11
and 11![]() grade PLAN exams, both administered in October. Math and reading scores are also available at varying grade levels from the Test of Achievement and Proficiency (TAP) in the earlier years of the
sample and from the American College Test (ACT) in later years, and math, science, reading, and English scores are also available in the later years from the Prairie State Achievement Exam (PSAE). The TAP, PSAE, and ACT are administered in late April and early May. The ACT, EXPLORE, PLAN, and PSAE
are produced by the same company and have similar formats. To compare observations from different years in our sample, all of the test scores are converted into z-scores. For each classroom, the fall and spring test scores in different subjects are computed as the averages of the available scores.
The fractions of scores from each type of test are included as control variables in the regressions.
grade PLAN exams, both administered in October. Math and reading scores are also available at varying grade levels from the Test of Achievement and Proficiency (TAP) in the earlier years of the
sample and from the American College Test (ACT) in later years, and math, science, reading, and English scores are also available in the later years from the Prairie State Achievement Exam (PSAE). The TAP, PSAE, and ACT are administered in late April and early May. The ACT, EXPLORE, PLAN, and PSAE
are produced by the same company and have similar formats. To compare observations from different years in our sample, all of the test scores are converted into z-scores. For each classroom, the fall and spring test scores in different subjects are computed as the averages of the available scores.
The fractions of scores from each type of test are included as control variables in the regressions.
B. Descriptive Statistics
In order for this study to identify the causal effects of first period on absences and on academic performance, the students who have key subjects such as math and English in first period must be otherwise similar to students who take those classes later in the day. One testable implication of this assumption is that the student and classroom characteristics should be similar between classes that meet in first period and those that meet later in the day. In Tables 1 and 2, we present evidence to evaluate this premise.
Table 1 shows separately by period of the day the fraction of classes in each subject. This table is calculated from unweighted classroom-level data, and the fractions in each column sum to one. As Table 1 shows, the breakdown of classes by subject is generally stable over the course of the day, and schools do not appear to systematically schedule academic subjects in low-absence periods.
Next, we examine whether the students or classrooms with mathematics or English in first period are systematically different from other students and classrooms. Table 2 presents means of the control variables for the mathematics and English classrooms in our data, shown separately by period of the day. All of the statistics reported in Table 2 and in later tables are computed from classroom-level data weighted by class size. Math classes are shown in columns (1) to (5) and English classes are shown in columns (6) to (10). Columns (1) and (6) show means for classes that meet in first period, columns (2) and (7) show means for classes that meet in second period, and columns (3) and (8) show means for classes meeting anytime from period three through seven. The t-statistics in columns (4) and (9) test the null hypothesis that the first period and second period means are equal, and the t-statistics in columns (5) and (10) test the null hypothesis that the first period means are equal to the third through seventh period means.
As Table 2 shows, first period math and English classes are fairly similar to math and English classes meeting later in the day. Due to the large number of observations, we reject the null hypothesis of equality across periods of the day for many of the control variables. Nevertheless, most of
these significant differences are very small. The first period math and English classes tend to have somewhat more black students, fewer Hispanic students, and students who are slightly older. One notable difference that is a potential source of bias in the estimation is the difference in
8![]() grade test scores between English classes meeting in first period and those meeting later in the day. As rows 1 and 2 of columns (6) through (8) show, 8
grade test scores between English classes meeting in first period and those meeting later in the day. As rows 1 and 2 of columns (6) through (8) show, 8![]() grade math and reading test scores are 0.05 and 0.03 standard deviations higher, respectively, in English classes meeting in period 2 and in periods 3 through 7 than in English classes meeting in first period. No
such difference is observable for math classes. To address the differences in demographic characteristics and in 8
grade math and reading test scores are 0.05 and 0.03 standard deviations higher, respectively, in English classes meeting in period 2 and in periods 3 through 7 than in English classes meeting in first period. No
such difference is observable for math classes. To address the differences in demographic characteristics and in 8![]() grade test scores, we include all of variables in Table 2 as controls
in the regressions. Nevertheless, the existence of differences in 8
grade test scores, we include all of variables in Table 2 as controls
in the regressions. Nevertheless, the existence of differences in 8![]() grade test scores between English classes meeting in first period and those meeting later in the day raises the
possibility that other unobservable indicators of skill may also be correlated with having English in first period. We attempt to address this problem in our regressions by measuring the effects of first period classes on test score growth (and not test score levels); however, this potential bias
should be noted as a limitation of our research design.
grade test scores between English classes meeting in first period and those meeting later in the day raises the
possibility that other unobservable indicators of skill may also be correlated with having English in first period. We attempt to address this problem in our regressions by measuring the effects of first period classes on test score growth (and not test score levels); however, this potential bias
should be noted as a limitation of our research design.
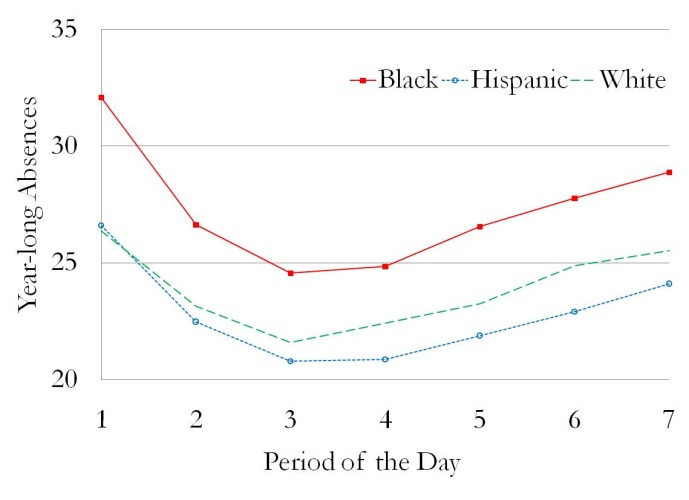
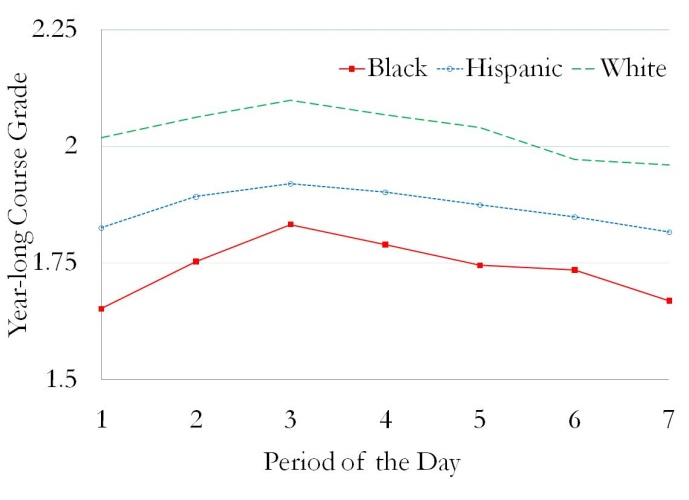
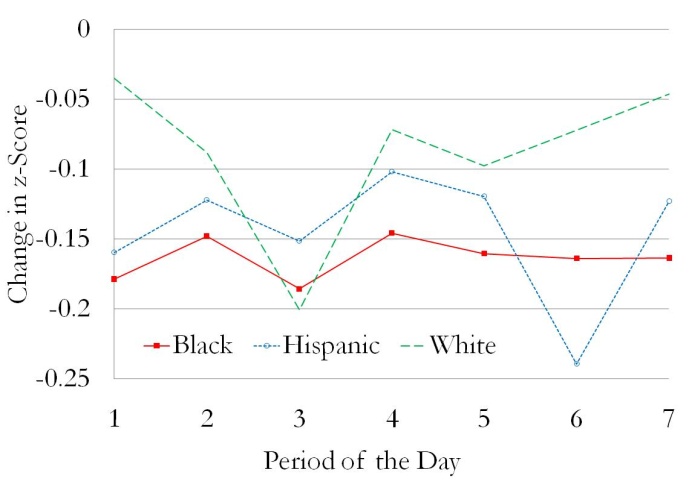
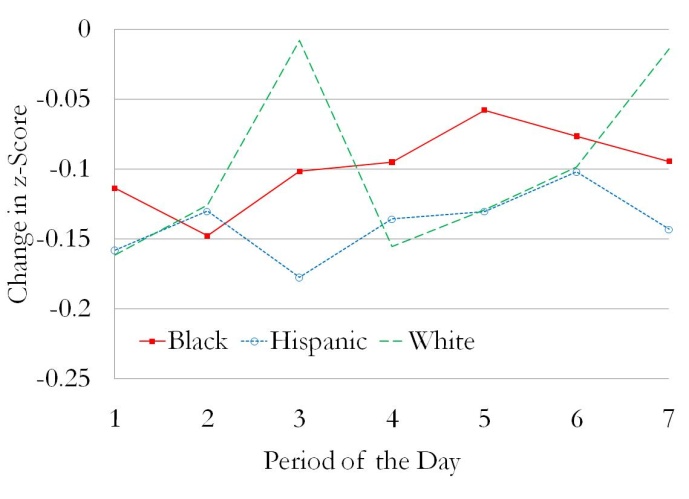
Next, in Figure 1 and in Table 3, we examine the reduced-form effects of having math and English in first period on absences in math and English, course grades, and test scores. Panels A and B of Figure 1 show the relationship between period of the day and the key endogenous variables of our model. These two panels show year-long absences (out of 180 school days) in math and English, respectively, as functions of the period of the day in which that math or English class meets. Panels C and D show the average of fall and spring course grades in math and English as functions of period of the day. Panels E and F show the average change from fall-to-spring in math and reading test scores (measured as the change in z-score), respectively, for math and English classes meeting in different periods of the day. In all six panels, the solid lines with solid squares show the means for black students, the dotted lines with open circles show the means for Hispanic students, and the dashed lines show the means for white students. While not shown on this graph, Asian and Native American students are included in the samples for Tables 1 through 8.
As panels A and B show, absences in math and English are at their highest levels in first period, they decline until reaching their lowest levels in third and fourth period, and then they gradually rise over the remainder of the day. This pattern is most pronounced among black students, for whom yearly absences vary across periods from 25 to 35 for math and from 25 to 32 for English. Nevertheless, the pattern is also detectable among Hispanic and white students, for whom yearly absences in math vary across periods of the day from 21 to 29 for Hispanics and from 22 to 29 for whites and in English from 21 to 27 for Hispanics and from 22 to 26 for whites. As panels C and D show, the reverse pattern can be seen in course grades for all three racial categories, with math and English grades from 0.05 to 0.18 grade points higher in classes meeting in periods three and four than in classes meeting in first period. No clear relationships are apparent in the plots of math test score growth against math period in panel E or of reading test score growth against English period in panel F, in part because the first differenced test score date are less precise than are the levels of absences and course grades.
In Table 3, we examine these reduced-form relationships for all races together. The columns of Table 3 are organized in the same way as in Table 2, with the first five columns showing data from math classes that meet in different periods and the next five columns showing data from English classes that meet in different periods. Panel A shows yearlong absences in math or English among students in that math or English classroom, respectively. Panel B shows average course grades in math, science, English, and social science among students in that math or English classroom. Spring math, science, reading, and English test scores are shown in panel C. Fall test scores for the same subjects are shown in panel D. The spring tests were taken in late April and early May and measure "post-treatment" student ability after nearly two semesters of that year's course schedule. The fall tests were taken in October and measure student ability and measure "pre-treatment" or "during-treatment" student ability before that year's course schedule can be expected to have had much effect.
The results from Table 3 confirm the general findings from Table 2 and Figure 1. As the first five columns of panel A show, having math in first period has a significant positive effect on absences in math, with students in first period math classes exhibiting 6.2 to 6.6 more absences in math per year than students with math in other periods of the day. In the next five columns of panel A, we observe a slightly smaller but significant effect of first period English increasing absences in English by 4.7 to 5.0 days per year.
The results from panel B of Table 3 show a clear and subject-specific relationship between course grades and having a course in first period. As the first five columns of panel B show, average math grades are 0.11 to 0.12 points lower for math classes that meet in first period than for math classes that meet later in the day. We also find that students whose math classes meet first period have science, English, and social studies grades that are 0.02 to 0.05 points higher than those of students whose math classes meet later in the day. This positive effect of first period math on grades in other subjects probably occurs because having math in first period precludes these other subjects from meeting at that time. We observe a similar pattern of effects of first period English classes in columns (6) to (10) of panel B, with a negative effect of -0.08 points on English grades and positive effects from 0.04 to 0.07 points on grades in math, science, and social studies.
As columns (1) to (5) of panel C in Table 3 show, we observe a slight, insignificant negative association between having math in first period and spring test scores in all four subjects. As the first five columns of panel D show, this slight association between ability and first period math was not apparent in fall test scores. The emergence of these slight negative relationships provides some suggestive evidence that having math in first period inhibits learning; this pattern does not appear to be specific to any particular subjects. As columns (6) to (10) of panel C shows, there is a similarly-sized negative relationship between having English in first period and spring test scores, and this relationship is significant in one of the eight comparisons. However, as we see in columns (6) to (10) of panel D, similarly-sized negative relationships are also apparent between first period English and fall test scores, which suggests that the negative associations in panel C are not necessarily causal and are probably due to omitted determinants of student ability that are correlated with first period English.
IV. Discussion of Results
A. Own-Subject Effects of First Period Math and English
In Table 4, we use multivariate regressions to estimate the reduced-form effects of having math or English in first period while controlling for other determinants of student achievement. Within each panel of Table 4, each of the four columns shows results from a different regression in which
the regressor of interest is a dummy for whether the class meets in first period. In columns (1) to (4), the sample is restricted to math classes, and in columns (5) to (8), the sample is restricted to English classes. Panels A and B show first-stage Ordinary Least Squares (OLS) results from
Equation (2), where the dependent variables are year-long absences in math and English, respectively. Panels C through L show reduced-form OLS results from a restricted form of Equation (3), where cross-subject effects are not included and the dependent variables are different measures of student
achievement as listed in the panel headings. The spring and fall math and English grades shown here are the classroom-level averages of the student-specific average grades across all math or English courses taken that semester. All of the regressions in panels A, C, and E control for the average
number of math classes taken by students in the classroom that year or semester, all of the regressions in panels B, D, and F control for the average number of English classes taken, and all of the regressions in panels G to L control for the fraction of students with non-missing test scores and
the fractions taking each type of test. Each regression in columns (1) and (5) includes those controls plus a constant term. In columns (2) and (6), controls are added for all of the student-, classroom-, and neighborhood-level characteristics except for ITBS scores (as listed in rows 3 to 28 of
Table 2). Columns (3) and (7) add school and academic year fixed effects, and columns (4) and (8) add 8![]() grade math and reading ITBS scores as controls. For a small number of classrooms,
the ITBS scores are missing for every student; consequently, the sample sizes in columns (4) and (8) are slightly smaller than in the preceding columns.
grade math and reading ITBS scores as controls. For a small number of classrooms,
the ITBS scores are missing for every student; consequently, the sample sizes in columns (4) and (8) are slightly smaller than in the preceding columns.
As panels A through F of Table 4 show, adding controls has relatively little effect on our estimated effects of first period math on math absences and grades and of first period English on English absences and grades. We find that having math in first period increases year-long math absences by 6.3 to 6.6 days and that having English in first period increases year-long English absences by 4.4 to 4.9 days; both effects are robust to the inclusion of controls and are significant in all four specifications. We find that having math in first period reduces math grades by 0.12 to 0.13 grade points and that having English in first period reduces English grades by 0.08 to 0.11 grade points; these effects are also stable and significant in all specifications.
While the negative effects of first period classes may arise due to a causal effect of absenteeism or grogginess on learning, they may simply reflect a mechanical relationship in which absenteeism or apparent effort factors directly into course grades. To test this theory, we examine test scores as an alternative measure of achievement in panels G through L.
The results in columns (1) and (5) of panels G and H of Table 4 confirm our findings from Table 3 of moderately-sized but insignificant negative effects of having math in first period on spring math scores and of having English in first period on spring reading scores. However, once controls are added to the regressions, we no longer observe these negative relationships. As controls are added to the regressions, the negative coefficient for math shrinks from -0.018 in column (1) to -0.003 in column (4), and the negative coefficient for English rises from -0.017 in column (5) to +0.009 to +0.019 in columns (6) to (8).
The results in panels I and J in Table 4 help to understand the emergence of this positive relationship between first period and spring test scores. Columns (1) and (5) of panels I and J confirm the findings from Table 3 that, when no controls are included, there is roughly zero relationship between having math or English first period on fall math or reading test scores, respectively. As controls are added to the regressions, however, positive relationships appear, with the coefficients for math ranging between +0.008 and +0.014 in columns (2) to (4) and coefficients for English ranging between +0.015 and +0.028 in columns (6) to (8). Hence, while adding controls to the regressions produces a positive between having a class in first period and spring test scores in that subject, that positive relationship can also be observed in October, before we would expect to see any effects of that year's course schedule.
One plausible explanation for these positive relationships appearing when controls are added is that some time-invariant omitted variable is correlated both with having math or English in first period and with test scores but is uncorrelated with the controls in the regression.6 If such a time-invariant omitted variable exists, then the bias can be avoided by using the growth in test scores from fall-to-spring as the dependent variable in the regression. First-difference regressions of this form are presented in panels K and L of Table 4; the sample sizes are smaller than in the previous panels due to the limited availability of fall and spring test scores for the same grades and years. The coefficients from these regressions are insignificant but fairly stable across specifications and indicate that having math in first period reduces fall-to-spring math test score growth by 0.008 to 0.028 standard deviations and that having English in first period reduces fall-to-spring reading test score growth by 0.015 to 0.022 standard deviations.
B. Cross-Subject Effects of First-Period Classes
Next, we examine the hypothesis that having a class in first period affects absences and student achievement in related subjects. Table 5 presents first-stage results from an expanded form of Equation (2) in which having first period in one subject can affect absences in another subject. Each
column in Table 5 shows coefficients from a different regression. The sample includes all classrooms in the data, regardless of subject. The dependent variables in these regressions are average absences in different subjects. Some classrooms have missing values for absences in a specific subject
because no student in the class takes that subject; consequently, the sample size varies across the different columns. The regressors of interest are the course subject indicators interacted with an indicator for whether a given class meets in first period. Each regression includes the full set of
controls minus previous 8![]() grade test scores, as in columns (3) and (7) of Table 4, and these controls are interacted with the course subject indicators. The own-subject effects of having
a class in first period on absences in that subject appear in bold along the diagonal. Because the control variables are interacted with the course subject indicators, the coefficient of 4.458 for the effect of first period English on English absences is the same as in column (7) of panel B in
Table 4, and the coefficient of 6.352 for the effect of first period math on math absences is the same as in column (3) of panel A in Table 4.
grade test scores, as in columns (3) and (7) of Table 4, and these controls are interacted with the course subject indicators. The own-subject effects of having
a class in first period on absences in that subject appear in bold along the diagonal. Because the control variables are interacted with the course subject indicators, the coefficient of 4.458 for the effect of first period English on English absences is the same as in column (7) of panel B in
Table 4, and the coefficient of 6.352 for the effect of first period math on math absences is the same as in column (3) of panel A in Table 4.
Along the diagonal of Table 5, we see that having a given subject in first period significantly increases absences in that subject by 3.4 to 6.7 days per year, with effects of 3.4 to 5.1 for English, Art, Music, & Physical Education (P.E.), and Shop, Vocational, & Other, and effects of 6.2 to 6.7 for the remaining subjects. We observe moderately-sized negative cross-subject effects, with two coefficients of -0.06 and -0.61 and the remainder being significant and ranging from -1.00 to -1.98. The cross-subject effects that are smallest are those for foreign language, business, and shop, vocational, and other courses, all of which tend to be offered less frequently (as can be seen in Table 1). Hence, having a given subject in first period tends to reduce absences in every other subject by one to two days per year, probably because having one subject in first period precludes any other subject from being a first period class.
Table 6 presents reduced-form results from Equation (3), where the dependent variables are year-long course grades in different subjects. The specifications and format are the same as in Table 5 except for the change in the dependent variables. The results along the diagonal are similar to our findings from Table 3 and indicate that scheduling a class in first period significantly reduces average grades in that subject by 0.09 to 0.17 grade points. We also find cross-subject effects that are significant in 41 and marginally significant in three of the 57 cases, with generally positive coefficients ranging from -0.02 to 0.07, which suggests that having a subject in first period generally improves course grades in other subjects. As with the absence results in Table 5, these cross-subject effects tend to be somewhat smaller for first period business and first period shop, vocational, and other courses that are offered relatively infrequently. Hence, like the cross-subject effects in Table 5, these effects probably occur because having first period in one subject prevents other subjects from being first period.
Table 7 presents additional results from Equation (3); however, the dependent variables in the four columns are the fall-to-spring changes in test scores for math, science, reading and English. The average numbers of courses taken in each subject are removed as control variables and replaced with the fractions of students with non-missing test scores and the fractions taking the different types of tests. The specifications and format are otherwise the same as in Tables 5 and 6. Because English and social studies courses may affect test score growth in both reading and English, the four pairwise combinations (English and reading, English and English, social studies and reading, and social studies and English) are all shown in bold.
The coefficients are less significant than in the previous tables, with only four significant and two marginally significant coefficients out of the 32 estimates. Unlike with Tables 5 and 6, the own-subject effects are roughly the same signs and magnitudes as the cross-subject effects. As with Table 6, the cross-subject effects of first period may occur due to some combination of mechanisms including the effect of preventing other classes from being first period and true spillovers in learning. Strangely, we observe a large and stable negative effect of having shop, vocational, or other in first period on all test scores. The reason for this negative effect is unclear; however, as Table 1 showed, shop and vocational courses are taught slightly more frequently in first period than later in the day, and this negative effect may appear because the types of shop and vocational courses taught in first period are different from those taught later in the day.7
With the exception of this last category of classes, having math class in first period appears to be more harmful to test score growth than having any other subject in first period. The direct effects of first period math on math test score growth are negative but insignificant. We also observe moderately-large negative spillover effects of having math in first period on test score growth in science and reading. While imprecise, the remaining estimates suggest that having first period science or foreign language is harmful to learning and that having social studies in first period has somewhat smaller negative effects. We observe mixed results for first period English and business and positive effects of having art, music, or P.E. in first period.
If we suppose that the direct effects of first period (through the channel of grogginess) are known to be negative, then we can obtain a (negative) lower bound on the effect of missing a class in a given subject on test scores. This bound is constructed by dividing the effects that we estimate in Table 7 of first period on test scores by the effects that we estimate in Table 5 of first period on absences. Because the fall tests are taken in October and the spring tests are taken in late April, an adjustment is necessary to convert this ratio into a per-day measure of the effects of absenteeism. Roughly 120 days elapse between the October and April exams, whereas the school year lasts 180 days. Hence, some of the absences that are measured in the transcript data will have occurred before the fall exam and some will have occurred after the spring exam. If we assume that absences are uniformly distributed over the year, then we can adjust for this discrepancy by multiplying the ratios of coefficients by 1.5.
Dividing the bold coefficients in Table 7 by the corresponding first-stage effects on absences from Table 5 and multiplying by 1.5, we find that a single absence in math reduces math test score growth by 0.006 standard deviations (i.e., (-0.027/6.352)*1.5=-0.0064). We find a positive effect of a single absence in science on science test score growth of 0.003 standard deviations. We find mixed effects on reading and English exam growth from a missed English class: an absence in English reduces reading score growth by 0.008 standard deviations while English exam growth increases by a much smaller 0.002 standard deviations. These positive effects may occur because having English or science first period prevents another class from being first period, or they may simply reflect the imprecision of the estimates. Finally, we also find mixed effects of +0.004 standard deviations in reading test score growth and -0.005 standard deviations in English test score growth per missed social studies class.
If we suppose that missing the most useful class of the day reduces test score growth by roughly 0.006 standard deviations, and that many classes have roughly zero effect, our estimated effects of absences are comparable to Hansen's (under revision) estimate that a weather-induced missed day of school reduces test scores in Colorado, Maryland, and Minnesota by 0.003 to 0.039 standard deviations, with an average estimate around 0.0127.8 Our estimates are somewhat large, however, relative to Jacob and Lefgren's (2004) finding that summer school has no detectable effect on Chicago sixth graders' test performance. One likely explanation for the differences in these various estimates is that the true effect of classroom attendance is heterogeneous. The students in Chicago Public Schools are slightly older and come from considerably poorer and less-educated families than do the students in the Colorado, Maryland, and Minnesota school districts examined by Hansen, and the returns to schooling could be negatively correlated with age and poverty. Additionally, by examining the effects of snow days, Hansen identifies the effect of the average day of school, whereas students may selectively skip classes that are less important, and unmotivated students skip at higher rates, so that the return to a typical day missed is probably lower than the return to the average day. Alternatively, Jacob and Lefgren (2004), by estimating the effects of being held back for summer school, identify the returns to attendance for a particularly unmotivated set of students. Moreover, as Jacob and Lefgren discuss, the negative psychological effect of holding students back may partially counteract the positive effects of classroom attendance in their study.
C. Long-Term Effects of First Period
Our final set of results examine the reduced-form effects of having a course in first period on performance in future classes in that same subject. To the extent that the own-subject effects of first period on course grades reflect actual learning, we should expect these effects to persist and to improve students' performance in the same subject in future years.
Table 8 presents our estimates of the long-term and short-term effects of first-period classes on math and foreign language course grades. Each of the four columns shows results from a different regression; the control variables are the same as in Table 6. In column (1), the sample is restricted to Geometry classrooms, and the students in the classroom-level means include only those who took geometry that year and Algebra I in an earlier year. The dependent variable in column (1) is the yearly average course grade in Geometry, and the regressors of interest include an indicator variable for whether that geometry class is first period as well as the fraction of students in that geometry class for whom Algebra I was first period. Column (2) presents a regression with the same specification but with Geometry replaced with Algebra II. In columns (3) and (4), the dependent variables are yearly course grades in French II and Spanish II, respectively. In each case, the regressors of interest include an indicator for whether the second-level course meets in first period as well as the fraction of students for whom the introductory course met in first period.
The results in columns (1) and (2) suggest that the effect of first-period on course grades is indeed a short-lived phenomenon, probably attributable to teachers factoring absences into their grade calculations. We observe significant negative effects of having Geometry in first period on Geometry grades and of having Algebra II in first period on Algebra II grades, thus confirming our results from Table 6. However, we observe small and precisely-estimated positive effects of having Algebra I in first period on both Geometry and Algebra II grades. Hence, the negative effect of first period math on math grades does not have a lasting effect on student performance in a related math course in the following year. Our estimates for French and Spanish classes are imprecise, probably due to the small sample sizes, and we are consequently not able to draw clear inferences from the results in columns (3) and (4).
VI. Conclusion
This study exploits quasi-random variation in the ordering of courses over the day to estimate the degree to which the returns to classroom attendance vary across course subject and the degree to which attending class in one subject has spillover effects onto learning in other subjects. We find that having a class in first period reduces grades in that course and has little effect on long-term grades or grades in related subjects. We also find suggestive evidence of moderate-sized own-subject and cross-subject effects on test scores, particularly for math classes.
References
Aaronson, Daniel, Lisa Barrow, and William Sander. 2007. "Teachers and Student Achievement in the Chicago Public High Schools." Journal of Labor Economics, 25(1), 95-135.
Card, David. 1999. "The Causal Effect of Education on Earnings." In Orley Ashenfelter and David Card, eds., Handbook of Labor Economics. Volume 3, Number 3, pp. 1801-63. Amsterdam: Elsevier Science.
Chicago Public Schools. 2009. "Why Teach at CPS?" Department of Human Resources. Available at: http://www.cps-humanresources.org/careers/salary.htm
Chingos, Matt and Marty West. 2009. "Are Classroom Effectiveness and Subject Expertise Valued Outside of Teaching?" Unpublished manuscript.
Cooper, Harris, Barbara Nye, Kelly Charlton, James Lindsay, and Scott Greathouse. 1996. "The Effects of Summer Vacation on Achievement Test Scores: A Narrative and Meta-Analytic Review." Review of Educational Research, 66(3), pp. 227-68. 1996.
Cravey, Beth Reese. 2009. "Art, Music Teachers Among Clay School Cuts Sought." The Florida Times-Union. 27 February.
Cullen, Julia B., Brian A. Jacob, and Steven Levitt. 2005. "The Impact of School Choice on Student Outcomes: An Analysis of the Chicago Public Schools." Journal of Public Economics, 89(5-6): 729-60.
Cullen, Julia B., Brian A. Jacob, and Steven Levitt. 2006. "The Effect of School Choice on Student Outcomes: Evidence from Randomized Lotteries." Econometrica, 74(5): 1191-230.
Dee, Thomas S. and Sarah R. Cohodes. 2008. "Out-of-Field Teachers and Student Achievement: Evidence from Matched-Pairs Comparisons." Public Finance Review, 36(1), pp. 7-32.
Dills, Angela K. and Rey Hernández-Julián. 2008. "Course Scheduling and Academic Performance." Economics of Education Review, 27(6), pp. 646-54.
Dobkin, Carlos, Ricard Gil, and Justin Marion. Under revision. "Causes and Consequences of Skipping Class in College." Economics of Education Review.
Eisner, Elliot W. 2004. The Arts and the Creation of Mind. New Haven, CT: Yale University Press.
Greenspan, Alan. 2000. "The Economic Importance of Improving Math-Science Education." Testimony before the Committee on Education and the Workforce, U.S. House of Representatives. September 21. http://www.federalreserve.gov/boarddocs/testimony/2000/20000921.htm
Griliches, Zvi. 1979. "Sibling Models and Data in Econometrics: Beginnings of a Survey." Journal of Political Economy, 87(5 part 2), pp. S37-64.
Hansen, Benjamin. Under Revision. "School Year Length and Student Performance: Quasi-Experimental Evidence." Economics of Education Review.
Hansen, Karsten T., James J. Heckman, and Kathleen J. Mullen. 2004. "The Effect of Schooling and Ability on Achievement Test Scores." Journal of Econometrics, 121(1-2), pp. 39-98.
Holt, David. 1997. Primary Arts Education: Contemporary Issues. New York: Routledge Press.
Ingersoll, Richard M. and David Perda. 2009. "The Mathematics and Science Teacher Shortage: Fact and Myth." Unpublished manuscript.
Jacob, Brian A. 2005. "Accountability, Incentives and Behavior: Evidence from School Reform in Chicago." Journal of Public Economics, 89(5-6): 761-96.
Jacob, Brian A. and Lars Lefgren. 2003. "Are Idle Hands the Devil's Workshop? Incapacitation, Concentration, and Juvenile Crime." American Economic Review, 93(5), pp. 1560-77.
Jacob, Brian A. and Lars Lefgren. 2004. "Remedial Education and Student Achievement: A Regression-Discontinuity Analysis." Review of Economics and Statistics, 86(1), pp. 226-44.
Jacob, Brian A. and Lars Lefgren. 2009. "The Effect of Grade Retention on High School Completion." American Economic Journal: Applied Economics, 1(3), pp. 33-58.
Jacob, Brian A. and Steven Levitt. 2003. "Rotten Apples: An Investigation of the Prevalence and Predictors of Teacher Cheating." Quarterly Journal of Economics, 118(3): 843-77.
Jacobson, Louis S., Robert LaLonde, and Daniel G. Sullivan. 2005. "Estimating the Returns to Community College on Displaced Workers." Journal of Econometrics, 125(1-2), pp. 271-304.
Jordan, Jennifer D. 2008. "Arts Education Threatened by Budget Cuts, Say Teachers." Providence Journal, 2 November. http://www.projo.com/education/content/arts_education_11-02-08_2MC4S53_v24.3592d12.html
Krashinsky, Harry. 2009. "How Would One Extra Year of High School Affect Wages? Evidence from a Unique Policy Experiment." Unpublished manuscript.
Los Angeles Unified School District. 2009. "2009-2010 Preparation Salary (T) Table." Available at: http://www.teachinla.com/Research/documents/salarytables/ttable.pdf
Murnane, Richard J. and others. 1991. Who Will Teach? Policies That Matter. Cambridge, MA: Harvard University Press.
National Academy of Sciences. 2006. "Rising Above the Gathering Storm: Energizing and Employing America for a Brighter Economic Future." Washington, DC: National Academies Press.
National Math and Science Initiative. 2009. "National Math and Science Initiative Home." http://www.nationalmathandscience.org/
New York City Department of Education. 2009a. "New York City Teacher Salary." Available at: http://schools.nyc.gov/TeachNYC/SalaryBenefits/Salary/default.htm
New York City Department of Education. 2009b. "Scholarships, Incentives, and Special Programs." Available at: http://www.teachnycprograms.net/
Riggins, Thomas. 2009. "Music Education and the Schools." Political Affairs Magazine Editors Blog. February 13. http://paeditorsblog.blogspot.com/2009/02/music-education-and-schools.html
Rochester, J. Martin. 2002. Class Warfare: Besieged Schools, Bewildered Parents, Betrayed Kids, and the Attack on Excellence. New York: Encounter Books.
Schmidt, Rebecca Anne. 2008. "Passing Rates in Early Period Courses: The 2005-2006 School Year." Department of Applied Research, Chicago Public Schools Office of Research, Evaluation, and Accountability.
Van Harken, Joseph. 2003. "Budgets Cut Student Experience." CNN, 20 August. http://www.cnn.com/2003/EDUCATION/08/13/sprj.sch.cuts/
The Winston Group. 2006. "Math and Science Education and United States Competitiveness: Does the Public Care?" Study conducted for the American Council on Education. Available at: http://www.solutionsforourfuture.org/site/DocServer/Global_Competitiveness_Executive_Summary.pdf?docID=641
Panel A: Math Absences by Math Period
Panel B: English Absences by English Period
Panel C: Math Grade by Math Period
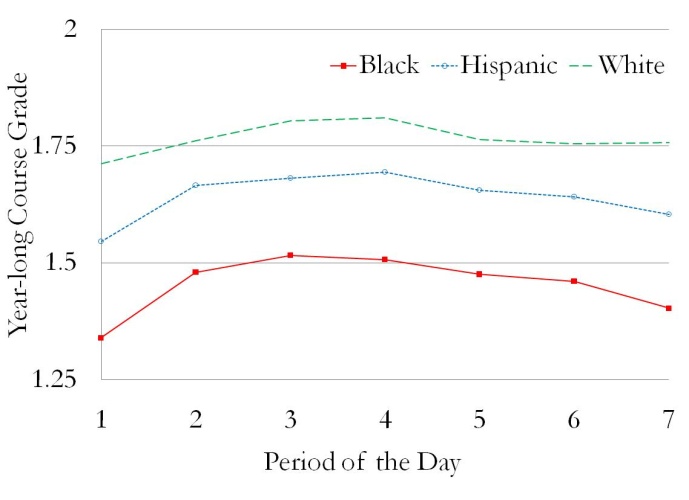
Panel D: English Grade by English Period
Panel E: Math Test Score Growth by Math Period
Panel F: Reading Test Score Growth by English Period
| Course Subject | 1st Pd. | 2nd Pd. | 3rd Pd. | 4th Pd. | 5th Pd. | 6th Pd. | 7th Pd. |
| Mathematics | 0.14 | 0.14 | 0.14 | 0.15 | 0.14 | 0.14 | 0.14 |
| Science | 0.12 | 0.12 | 0.12 | 0.12 | 0.12 | 0.12 | 0.13 |
| English | 0.21 | 0.20 | 0.19 | 0.19 | 0.19 | 0.19 | 0.19 |
| Social Studies | 0.14 | 0.15 | 0.14 | 0.15 | 0.14 | 0.15 | 0.14 |
| Foreign Language | 0.06 | 0.06 | 0.06 | 0.06 | 0.06 | 0.06 | 0.06 |
| Business | 0.06 | 0.06 | 0.06 | 0.06 | 0.06 | 0.06 | 0.06 |
| Art/Music, PE | 0.20 | 0.21 | 0.23 | 0.22 | 0.22 | 0.21 | 0.21 |
| Shop | 0.05 | 0.04 | 0.04 | 0.03 | 0.04 | 0.04 | 0.04 |
| Vocational | 0.03 | 0.02 | 0.02 | 0.02 | 0.02 | 0.02 | 0.02 |
| Other | 0.01 | 0.00 | 0.01 | 0.00 | 0.00 | 0.00 | 0.00 |
Source : Chicago Public Schools High School Transcripts Data, 1993/94-2005/06.
Notes : Unweighted means from classroom by semester-level data are shown. Charter, magnet, and
vocational schools are dropped from the sample, as are classes meeting in periods eight or later.
Course subject is identified from the course number. Supplementary tutoring courses are reclassified
| (1) Math is Pd. 1 | (2) Math is Pd. 2 | (3) Math is Pd. 3-7 | (4) T-Test: 1 vs. 2 | (5) T-Test: 1 vs. 3-7 | (6) English is Pd. 1 | (7) English is Pd. 2 | (8) English is Pd. 3-7 | (9) T-Test: 1 vs. 2 | (10) T-Test: 1 vs. 3-7 | |
| 1. Student Characteristics: Math ITBS Z-Score (8th Grade) | 0.06 | 0.06 | 0.08 | 0.10 | -1.03 | -0.02 | 0.01 | 0.03 | -2.36** | -4.03** |
| 2. Student Characteristics: Reading ITBS Z-Score (8th Grade) | 0.03 | 0.04 | 0.04 | -0.27 | -0.70 | -0.04 | -0.02 | -0.01 | -1.64 | -3.11** |
| 3. Student Characteristics: Male | 0.48 | 0.49 | 0.49 | -1.81* | -2.44** | 0.48 | 0.48 | 0.49 | -1.86* | -2.53** |
| 4. Student Characteristics: White | 0.09 | 0.09 | 0.10 | 0.27 | -3.92** | 0.09 | 0.09 | 0.10 | -1.31 | -4.08** |
| 5. Student Characteristics: Black | 0.56 | 0.55 | 0.51 | 1.23 | 6.45** | 0.55 | 0.54 | 0.51 | 1.59 | 5.85** |
| 7. Student Characteristics: Asian | 0.03 | 0.04 | 0.04 | -0.83 | -3.31 | 0.03 | 0.04 | 0.04 | -2.71** | -3.52** |
| 8. Student Characteristics: Hispanic | 0.31 | 0.32 | 0.35 | -1.35 | -4.94** | 0.32 | 0.33 | 0.35 | -0.90 | -4.71** |
| 9. Student Characteristics: American Indian | 0.00 | 0.00 | 0.00 | -0.27 | 0.31 | 0.00 | 0.00 | 0.00 | -0.49 | -1.29 |
| 10. Student Characteristics: Free Lunch Eligible | 0.81 | 0.81 | 0.81 | 0.53 | 1.10 | 0.81 | 0.81 | 0.81 | 0.32 | 0.36 |
| 11. Student Characteristics: Special Education | 0.14 | 0.14 | 0.14 | -1.77* | -0.91 | 0.15 | 0.15 | 0.14 | 0.18 | 3.32** |
| 12. Student Characteristics: Lives with Biol. Student Characteristics: Parent | 0.91 | 0.91 | 0.92 | -0.72 | -3.20** | 0.91 | 0.91 | 0.92 | -3.33** | -6.51** |
| 13. Student Characteristics: Enrolled in Bilingual Ed | 0.37 | 0.37 | 0.41 | -0.83 | -5.77** | 0.38 | 0.38 | 0.41 | -0.59 | -4.59** |
| 14. Student Characteristics: Age | 15.49 | 15.41 | 15.38 | 4.77** | 6.45** | 15.76 | 15.66 | 15.60 | 6.15** | 10.43** |
| 15. Student Characteristics: Grade 9 | 0.35 | 0.38 | 0.40 | -3.64** | -6.66** | 0.32 | 0.35 | 0.37 | -4.30** | -7.85** |
| 16. Student Characteristics: Grade 10 | 0.31 | 0.31 | 0.30 | -1.21 | 0.91 | 0.24 | 0.25 | 0.25 | -2.37** | -2.17** |
| 17. Student Characteristics: Grade 11 | 0.23 | 0.21 | 0.21 | 3.40** | 4.81** | 0.22 | 0.20 | 0.20 | 4.68** | 5.78** |
| 18. Student Characteristics: Grade12 | 0.11 | 0.10 | 0.09 | 3.99** | 4.93** | 0.22 | 0.20 | 0.18 | 3.07** | 8.56** |
| 19. Classroom Characteristics: Advanced Classroom | 0.08 | 0.07 | 0.07 | 2.38** | 2.65** | 0.03 | 0.02 | 0.02 | 4.11** | 6.95** |
| 20. Classroom Characteristics: Low-level Classroom | 0.06 | 0.07 | 0.07 | -2.00** | -3.69** | 0.03 | 0.04 | 0.04 | -2.14** | -4.61** |
| 21. Classroom Characteristics: Bilingual Classroom | 0.01 | 0.01 | 0.01 | 1.95* | 0.19 | 0.07 | 0.05 | 0.06 | 4.79** | 3.79** |
| 22. Classroom Characteristics: Class Size | 23.30 | 23.64 | 23.46 | -2.72** | -1.52 | 23.29 | 23.66 | 23.44 | -3.39** | -1.49 |
| 23. Neighborhood Characteristics: Mean Education | 11.87 | 11.92 | 11.91 | -3.09** | -1.96** | 11.84 | 11.88 | 11.88 | -3.46** | -2.51** |
| 24. Neighborhood Characteristics: Percent in Poverty | 0.25 | 0.25 | 0.24 | 1.73** | 4.89 | 0.25 | 0.25 | 0.24 | 2.51** | 6.70** |
| 25. Neighborhood Characteristics: Median Family Income | 31,565 | 32,035 | 32,329 | -2.33** | -4.01** | 31,611 | 32,372 | 32,779 | -4.00** | -6.54** |
| 26. Neighborhood Characteristics: % Latino | 0.25 | 0.25 | 0.27 | 0.51 | -2.90** | 0.26 | 0.26 | 0.27 | 0.33 | -3.14** |
| 27. Neighborhood Characteristics: % Black | 0.51 | 0.50 | 0.46 | 1.38 | 6.62** | 0.50 | 0.49 | 0.46 | 1.72* | 6.37** |
| 28. Neighborhood Characteristics: High School Graduate | 0.64 | 0.64 | 0.64 | -3.32 | -0.40 | 0.63 | 0.64 | 0.64 | -4.42** | -2.43** |
| 29. Neighborhood Characteristics: College Graduate | 0.14 | 0.15 | 0.15 | -2.97** | -3.44** | 0.14 | 0.14 | 0.15 | -4.77** | -5.28** |
| Sample Size | 4,417 | 5,168 | 21,498 | 9,585 | 25,915 | 7,075 | 7,601 | 30,283 | 14,676 | 37,358 |
| Clusters | 740 | 753 | 750 | 755 |
Notes : See notes to Table 1. The data are organized into a classroom by semester panel and are weighted by class size. Only math classrooms are included in the sample in
columns (1) to (5), and only English classrooms are included in the sample in columns (6) to (10). ITBS indicates students' scores on the Iowa Test of Basic Skills. The
classroom-level data are constructed by taking the average among those students in the classroom who have non-missing values for each variable. Standard errors are clustered at
the interaction of school and academic year for the t-tests. ** and * indicate 5% and 10% significance, respectively.
| (1) Math is Pd. 1 | (2) Math is Pd. 2 | (3) Math is Pd. 3-7 | (4) T-Test: 1 vs. 2 | (5) T-Test: 1 vs. 3-7 | (6) English is Pd. 1 | (7) English is Pd. 2 | (8) English is Pd. 3-7 | (9) T-Test: 1 vs. 2 | (10) T-Test: 1 vs. 3-7 | |
| Absences | 31.70 | 25.55 | 25.06 | 17.40** | 16.94** | 29.46 | 24.72 | 24.51 | 15.93** | 17.26** |
| Obs (classrooms) | 4,417 | 5,168 | 21,498 | 9,585 | 25,915 | 7,075 | 7,601 | 30,283 | 14,676 | 37,358 |
| Clusters (school-by-year) |
740 | 753 | 750 | 755 |
![]() In panels C and D, the sample size varies across tests. The sample size reported in columns (1) to (5) is the sample size for the math test, and the sample size reported
In panels C and D, the sample size varies across tests. The sample size reported in columns (1) to (5) is the sample size for the math test, and the sample size reported
in columns (6) to (10) is the sample size for the reading test. For panel C, the total number of math classrooms (added across columns (1) to (3)) with non-missing
observations is 20,892 for math scores, 5,239 for science scores, 23,885 for reading scores, and 5,247 for English scores; the total number of English classrooms (added
across columns (6) to (8)) with non-missing observations is 27,015 for math scores, 6,942 for science scores, 31,073 for reading scores, and 6,947 for English scores.
For panel D, the total number of math classrooms (added across columns (1) to (3)) with non-missing observations is 8,919 for math scores, 8,914 for science scores,
8,915 for reading scores, and 8,918 for English scores; the total number of English classrooms (added across columns (6) to (8)) with non-missing observations is
13,742 for math scores, 13,735 for science scores, 13,740 for reading scores, and 13,741 for English scores.
| (1) Math is Pd. 1 | (2) Math is Pd. 2 | (3) Math is Pd. 3-7 | (4) T-Test: 1 vs. 2 | (5) T-Test: 1 vs. 3-7 | (6) English is Pd. 1 | (7) English is Pd. 2 | (8) English is Pd. 3-7 | (9) T-Test: 1 vs. 2 | (10) T-Test: 1 vs. 3-7 | |
| Math | 1.43 | 1.54 | 1.55 | -8.96** | -11.39** | 1.57 | 1.53 | 1.52 | 3.43** | 5.99** |
| Science | 1.69 | 1.65 | 1.66 | 2.54** | 2.07** | 1.71 | 1.67 | 1.65 | 3.49** | 6.35** |
| English | 1.81 | 1.75 | 1.77 | 4.22** | 3.67** | 1.73 | 1.81 | 1.81 | -7.83** | -9.45** |
| Social Studies | 1.83 | 1.78 | 1.79 | 3.78** | 3.68** | 1.86 | 1.81 | 1.79 | 4.67** | 7.65** |
| Obs (classrooms) | 4,417 | 5,168 | 21,498 | 9,585 | 25,915 | 7,075 | 7,601 | 30,283 | 14,676 | 37,358 |
| Clusters (school-by-year) |
740 | 753 | 750 | 755 |
![]() In panels C and D, the sample size varies across tests. The sample size reported in columns (1) to (5) is the sample size for the math test, and the sample size reported
In panels C and D, the sample size varies across tests. The sample size reported in columns (1) to (5) is the sample size for the math test, and the sample size reported
in columns (6) to (10) is the sample size for the reading test. For panel C, the total number of math classrooms (added across columns (1) to (3)) with non-missing
observations is 20,892 for math scores, 5,239 for science scores, 23,885 for reading scores, and 5,247 for English scores; the total number of English classrooms (added
across columns (6) to (8)) with non-missing observations is 27,015 for math scores, 6,942 for science scores, 31,073 for reading scores, and 6,947 for English scores.
For panel D, the total number of math classrooms (added across columns (1) to (3)) with non-missing observations is 8,919 for math scores, 8,914 for science scores,
8,915 for reading scores, and 8,918 for English scores; the total number of English classrooms (added across columns (6) to (8)) with non-missing observations is
13,742 for math scores, 13,735 for science scores, 13,740 for reading scores, and 13,741 for English scores.
| (1) Math is Pd. 1 | (2) Math is Pd. 2 | (3) Math is Pd. 3-7 | (4) T-Test: 1 vs. 2 | (5) T-Test: 1 vs. 3-7 | (6) English is Pd. 1 | (7) English is Pd. 2 | (8) English is Pd. 3-7 | (9) T-Test: 1 vs. 2 | (10) T-Test: 1 vs. 3-7 | |
| Math | -0.04 | -0.03 | -0.01 | -0.16 | -1.34 | -0.11 | -0.09 | -0.08 | -1.57 | -2.32** |
| Science | -0.07 | -0.05 | -0.05 | -0.62 | -0.71 | -0.09 | -0.11 | -0.07 | 0.75 | -0.58 |
| Reading | -0.07 | -0.05 | -0.05 | -0.88 | -1.31 | -0.13 | -0.12 | -0.11 | -0.75 | -1.44 |
| Writing | -0.04 | -0.04 | -0.05 | 0.11 | 0.43 | -0.10 | -0.12 | -0.08 | 0.78 | -0.82 |
| Obs (classrooms) | 2,936 | 3,492 | 14,464 | 6,428 | 17,400 | 4,846 | 5,206 | 21,021 | 10,052 | 25,867 |
| Clusters (school-by-year) |
651 | 666 | 714 | 723 |
![]() In panels C and D, the sample size varies across tests. The sample size reported in columns (1) to (5) is the sample size for the math test, and the sample size reported
In panels C and D, the sample size varies across tests. The sample size reported in columns (1) to (5) is the sample size for the math test, and the sample size reported
in columns (6) to (10) is the sample size for the reading test. For panel C, the total number of math classrooms (added across columns (1) to (3)) with non-missing
observations is 20,892 for math scores, 5,239 for science scores, 23,885 for reading scores, and 5,247 for English scores; the total number of English classrooms (added
across columns (6) to (8)) with non-missing observations is 27,015 for math scores, 6,942 for science scores, 31,073 for reading scores, and 6,947 for English scores.
For panel D, the total number of math classrooms (added across columns (1) to (3)) with non-missing observations is 8,919 for math scores, 8,914 for science scores,
8,915 for reading scores, and 8,918 for English scores; the total number of English classrooms (added across columns (6) to (8)) with non-missing observations is
13,742 for math scores, 13,735 for science scores, 13,740 for reading scores, and 13,741 for English scores.
| (1) Math is Pd. 1 | (2) Math is Pd. 2 | (3) Math is Pd. 3-7 | (4) T-Test: 1 vs. 2 | (5) T-Test: 1 vs. 3-7 | (6) English is Pd. 1 | (7) English is Pd. 2 | (8) English is Pd. 3-7 | (9) T-Test: 1 vs. 2 | (10) T-Test: 1 vs. 3-7 | |
| Math | 0.05 | 0.04 | 0.05 | 0.26 | -0.22 | -0.04 | -0.04 | -0.02 | -0.05 | -1.78* |
| Science | 0.04 | 0.02 | 0.03 | 0.88 | 0.57 | -0.06 | -0.05 | -0.03 | -0.62 | -2.16** |
| Reading | 0.02 | 0.01 | 0.02 | 0.56 | 0.22 | -0.04 | -0.05 | -0.04 | 0.54 | 0.06 |
| Writing | 0.02 | 0.02 | 0.02 | 0.21 | -0.03 | -0.06 | -0.06 | -0.04 | 0.12 | -1.18 |
| Obs (classrooms) | 1,277 | 1,493 | 6,149 | 2,770 | 7,426 | 1,999 | 2,339 | 9,402 | 4,338 | 11,401 |
| Clusters (school-by-year) |
248 | 252 | 253 | 254 |
![]() In panels C and D, the sample size varies across tests. The sample size reported in columns (1) to (5) is the sample size for the math test, and the sample size reported
In panels C and D, the sample size varies across tests. The sample size reported in columns (1) to (5) is the sample size for the math test, and the sample size reported
in columns (6) to (10) is the sample size for the reading test. For panel C, the total number of math classrooms (added across columns (1) to (3)) with non-missing
observations is 20,892 for math scores, 5,239 for science scores, 23,885 for reading scores, and 5,247 for English scores; the total number of English classrooms (added
across columns (6) to (8)) with non-missing observations is 27,015 for math scores, 6,942 for science scores, 31,073 for reading scores, and 6,947 for English scores.
For panel D, the total number of math classrooms (added across columns (1) to (3)) with non-missing observations is 8,919 for math scores, 8,914 for science scores,
8,915 for reading scores, and 8,918 for English scores; the total number of English classrooms (added across columns (6) to (8)) with non-missing observations is
13,742 for math scores, 13,735 for science scores, 13,740 for reading scores, and 13,741 for English scores.
| (1) | (2) | (3) | (4) | |
| Panel A: Absences in Math, First Period | 6.555 | 6.296 | 6.352 | 6.415 |
| Panel A: Absences in Math, First Period Standard Errors | (0.372)** | (0.323)** | (0.298)** | (0.291)** |
| Panel A: Absences in Math, |
0.02 | 0.26 | 0.41 | 0.43 |
| Panel A: Absences in Math, Obs (Classrooms) | 31,143 | 31,143 | 31,143 | 28,715 |
| Panel A: Absences in Math, Clusters (School Years) | 753 | 753 | 753 | 753 |
| Panel C: Spring Math Grade, First Period | -0.120 | -0.128 | -0.125 | -0.124 |
| Panel C: Spring Math Grade, First Period Standard Errors | (0.010)** | (0.008)** | (0.008)** | (0.008)** |
| Panel C: Spring Math Grade, |
0.00 | 0.24 | 0.31 | 0.35 |
| Panel C: Spring Math Grade, Obs (Classrooms) | 31,083 | 31,083 | 31,083 | 28,662 |
| Panel C: Spring Math Grade, Clusters (School Years) | 753 | 753 | 753 | 753 |
| Panel E: Fall Math Grade, First Period | -0.120 | -0.127 | -0.121 | -0.121 |
| Panel E: Fall Math Grade, First Period Standard Errors | (0.011)** | (0.009)** | (0.008)** | (0.008)** |
| Panel E: Fall Math Grade, |
0.00 | 0.27 | 0.35 | 0.38 |
| Panel E: Fall Math Grade, Obs (Classrooms) | 31,081 | 31,081 | 31,081 | 28,653 |
| Panel E: Fall Math Grade, Clusters (School Years) | 753 | 753 | 753 | 753 |
| Panel G: Spring Math Exam, First Period | -0.018 | -0.007 | -0.013 | -0.003 |
| Panel G: Spring Math Exam, First Period Standard Errors | (0.015) | (0.011) | (0.010) | (0.009) |
| Panel G: Spring Math Exam, |
0.00 | 0.47 | 0.61 | 0.73 |
| Panel G: Spring Math Exam, Obs (Classrooms) | 20,918 | 20,918 | 20,918 | 19,220 |
| Panel G: Spring Math Exam, Clusters (School Years) | 667 | 667 | 667 | 667 |
| Panel I: Fall Math Exam, First Period | 0.004 | 0.010 | 0.014 | 0.008 |
| Panel I: Fall Math Exam, First Period Standard Errors | (0.020) | (0.014) | (0.013) | (0.010) |
| Panel I: Fall Math Exam, |
0.00 | 0.64 | 0.70 | 0.82 |
| Panel I: Fall Math Exam, Obs (Classrooms) | 8,959 | 8,959 | 8,959 | 8,817 |
| Panel I: Fall Math Exam, Clusters (School Years) | 252 | 252 | 252 | 252 |
| Panel K: Fall-to-Spring Difference in Math Exams, First Period | -0.008 | -0.023 | -0.027 | -0.028 |
| Panel K: Fall-to-Spring Difference in Math Exams, First Period Standard Errors | (0.019) | (0.019) | (0.019) | (0.019) |
| Panel K: Fall-to-Spring Difference in Math Exams, |
0.00 | 0.04 | 0.08 | 0.08 |
| Panel K: Fall-to-Spring Difference in Math Exams, Obs (Classrooms) | 4,231 | 4,231 | 4,231 | 4,203 |
| Panel K: Fall-to-Spring Difference in Math Exams, Clusters (School Years) | 228 | 228 | 228 | 228 |
| Student Controls | Yes | Yes | Yes | |
| Classroom Controls | Yes | Yes | Yes | |
| Neighborhood Controls | Yes | Yes | Yes | |
| School& Year FE | Yes | Yes | ||
| Previous Test Scores | Yes |
Notes : See notes to Tables 1 to 3 and Figure 1. Within each panel, each column shows results from a different ordinary least squares regression using data at the
classroom-by-semester level and weighted by class size. The sample for columns (1) to (4) only includes math classrooms, and the sample for columns (5) to (8)
only includes English classrooms. Standard errors adjust for clustering at the level of the school by academic year interaction. All of the regressions in panels A,
C, and E control for the average number of math classes taken by students in the classroom that year or semester, and all of the regressions in panels B, D, and F
control for the average number of English classes taken. The regressions in panels G through L control for the fraction of students in the classroom with nonmissing
test scores and the fractions taking each kind of test. Student, Classroom, and Neighborhood Controls are listed in Table 2. aStudent controls exclude the
ITBS scores, which enter separately as "Previous 8th Grade Test Scores". ** and * indicate 5% and 10% significance, respectively.
| (5) | (6) | (7) | (8) | |
| Panel B: Absences in English, First Period | 4.905 | 4.401 | 4.458 | 4.594 |
| Panel B: Absences in English, First Period Standard Errors | (0.278)** | (0.242)** | (0.210)** | (0.214)** |
| Panel B: Absences in English, |
0.01 | 0.28 | 0.44 | 0.44 |
| Panel B: Absences in English, Obs (Classrooms) | 44,990 | 44,990 | 44,990 | 40,260 |
| Panel B: Absences in English, Clusters (School Years) | 755 | 755 | 755 | 755 |
| Panel D: Spring English Grade, First Period | -0.081 | -0.089 | -0.093 | -0.101 |
| Panel D: Spring English Grade, First Period Standard Errors | (0.008)** | (0.007)** | (0.007)** | (0.007)** |
| Panel D: Spring English Grade, |
0.00 | 0.30 | 0.35 | 0.38 |
| Panel D: Spring English Grade, Obs (Classrooms) | 44,959 | 44,959 | 44,959 | 40,234 |
| Panel D: Spring English Grade, Clusters (School Years) | 755 | 755 | 755 | 755 |
| Panel F: Fall English Grade, First Period | -0.096 | -0.099 | -0.102 | -0.106 |
| Panel F: Fall English Grade, First Period Standard Errors | (0.009)** | (0.008)** | (0.007)** | (0.007)** |
| Panel F: Fall English Grade, |
0.00 | 0.29 | 0.34 | 0.38 |
| Panel F: Fall English Grade, Obs (Classrooms) | 44,985 | 44,985 | 44,985 | 40,286 |
| Panel F: Fall English Grade, Clusters (School Years) | 755 | 755 | 755 | 755 |
| Panel H: Spring Reading Exam, First Period | -0.017 | 0.017 | 0.019 | 0.009 |
| Panel H: Spring Reading Exam, First Period Standard Errors | (0.013) | (0.009)* | (0.008)** | (0.007)** |
| Panel H: Spring Reading Exam, |
0.00 | 0.48 | 0.57 | 0.67 |
| Panel H: Spring Reading Exam, Obs (Classrooms) | 31,073 | 31,073 | 31,073 | 27,786 |
| Panel H: Spring Reading Exam, Clusters (School Years) | 723 | 723 | 723 | 723 |
| Panel J: Fall Reading Exam, First Period | 0.001 | 0.015 | 0.028 | 0.023 |
| Panel J: Fall Reading Exam, First Period Standard Errors | (0.015) | (0.011) | (0.011)** | (0.009)** |
| Panel J: Fall Reading Exam, |
0.00 | 0.54 | 0.59 | 0.70 |
| Panel J: Fall Reading Exam, Obs (Classrooms) | 13,859 | 13,859 | 13,859 | 13,509 |
| Panel J: Fall Reading Exam, Clusters (School Years) | 254 | 254 | 254 | 254 |
| Panel L: Fall-to-Spring Difference in Reading Exams, First Period | -0.016 | -0.015 | -0.022 | -0.021 |
| Panel L: Fall-to-Spring Difference in Reading Exams, First Period Standard Errors | (0.022) | (0.022) | (0.021) | (0.022) |
| Panel L: Fall-to-Spring Difference in Reading Exams, |
0.00 | 0.02 | 0.06 | 0.06 |
| Panel L: Fall-to-Spring Difference in Reading Exams, Obs (Classrooms) | 5,436 | 5,436 | 5,436 | 5,394 |
| Panel L: Fall-to-Spring Difference in Reading Exams, Clusters (School Years) | 229 | 229 | 229 | 229 |
| Student Controls | Yes | Yes | Yes | |
| Classroom Controls | Yes | Yes | Yes | |
| Neighborhood Controls | Yes | Yes | Yes | |
| School & Year FE | Yes | Yes | ||
| Previous Test Scores | Yes |
Notes : See notes to Tables 1 to 3 and Figure 1. Within each panel, each column shows results from a different ordinary least squares regression using data at the
classroom-by-semester level and weighted by class size. The sample for columns (1) to (4) only includes math classrooms, and the sample for columns (5) to (8)
only includes English classrooms. Standard errors adjust for clustering at the level of the school by academic year interaction. All of the regressions in panels A,
C, and E control for the average number of math classes taken by students in the classroom that year or semester, and all of the regressions in panels B, D, and F
control for the average number of English classes taken. The regressions in panels G through L control for the fraction of students in the classroom with nonmissing
test scores and the fractions taking each kind of test. Student, Classroom, and Neighborhood Controls are listed in Table 2. aStudent controls exclude the
ITBS scores, which enter separately as "Previous 8th Grade Test Scores". ** and * indicate 5% and 10% significance, respectively.
| First Pd. Class is . . . | (1) Total Abs. in Math | (2) Total Abs. in Science | (3) Total Abs. in English | (4) Total Abs. in Soc. Studies | (5) Total Abs. in For. Lang. | (6) Total Abs. in Business | (7) Total Abs. in Art, Music, PE | (8) Total Abs. in Nonacademic |
| Math | 6.352 | -1.629 | -1.829 | -1.697 | -1.379 | -1.796 | -1.376 | -1.039 |
| Math (standard error) | (0.298)** | (0.179)** | (0.164)** | (0.166)** | (0.278)** | (0.277)** | (0.156)** | (0.284)** |
| Science | -1.798 | 6.604 | -1.942 | -1.698 | -1.646 | -1.619 | -1.548 | -1.381 |
| Science (standard error) | (0.174)** | (0.296)** | (0.157)** | (0.161)** | (0.275)** | (0.311)** | (0.150)** | (0.309)** |
| English | -1.978 | -1.949 | 4.458 | -1.891 | -1.603 | -1.424 | -1.495 | -1.668 |
| English (standard error) | (0.151)** | (0.151)** | (0.210)** | (0.139)** | (0.204)** | (0.201)** | (0.128)** | (0.207)** |
| Social Studies | -1.473 | -1.825 | -1.634 | 6.170 | -1.306 | -1.481 | -1.492 | -1.296 |
| Social Studies (standard error) | (0.166)** | (0.179)** | (0.150)** | (0.251)** | (0.253)** | (0.255)** | (0.140)** | (0.260)** |
| Foreign Language | -1.213 | -1.226 | -1.344 | -1.027 | 6.669 | -1.428 | -1.002 | -1.142 |
| Foreign Language (standard error) | (0.198)** | (0.213)** | (0.174)** | (0.184)** | (0.318)** | (0.379)** | (0.170)** | (0.339)** |
| Business | -1.123 | -1.206 | -1.133 | -1.026 | -1.499 | 6.278 | -0.612 | -1.047 |
| Business (standard error) | (0.247)** | (0.269)** | (0.218)** | (0.229)** | (0.396)** | (0.321)** | (0.204)** | (0.453)** |
| Art, Music, PE | -1.444 | -1.463 | -1.579 | -1.496 | -1.581 | -1.361 | 3.367 | -1.022 |
| Art, Music, PE (standard error) | (0.146)** | (0.156)** | (0.130)** | (0.136)** | (0.237)** | (0.213)** | (0.186)** | (0.237)** |
| Non-academic | -1.498 | -1.187 | -1.162 | -1.025 | -0.064 | -1.474 | -1.115 | 5.073 |
| Non-academic (standard error) | (0.288)** | (0.335)** | (0.249)** | (0.259)** | (0.488) | (0.469)** | (0.253)** | (0.366)** |
| 0.44 | 0.41 | 0.49 | 0.45 | 0.23 | 0.28 | 0.50 | 0.26 | |
| Classrooms | 208,176 | 206,513 | 209,873 | 208,083 | 169,594 | 170,719 | 209,220 | 166,626 |
| Clusters | 754 | 755 | 755 | 755 | 729 | 728 | 754 | 718 |
Notes: See notes to Tables 1 to 4 and Figure 1. Each column shows results from a separate regression where the outcome variable measures average absences in a given subject
among students in that class. The level of observation is the classroom-by-semester. Unlike with Tables 2 to 4, however, classrooms in all subjects are included in the data.
Each regression includes controls for the average number of courses taken in that subject by students in that classroom and the full set of controls except for 8th-grade test
scores, as in columns (3) and (7) of Table 4, and all of the controls are interacted with dummies for course subject. The regressors of interest are course subject dummies
interacted with "class is first period." ** indicates statistical significance at the 5% level.
| First Pd. Class is . . . | (1) Math Grade | (2) Science Grade | (3) English Grade | (4) Soc. Studies Grade | (5) Foreign Lang. Grade | (6) Business Grade | (7) Art, Music, PE Grade | (8) Nonacademic Grade |
| Math | -0.122 | 0.019 | 0.033 | 0.026 | 0.034 | 0.040 | 0.043 | 0.044 |
| Math (standard error) | (0.008)** | (0.008)** | (0.007)** | (0.008)** | (0.012)** | (0.012)** | (0.007)** | (0.014)** |
| Science | 0.035 | -0.134 | 0.047 | 0.045 | 0.039 | 0.065 | 0.055 | 0.019 |
| Science (standard error) | (0.007)** | (0.008)** | (0.007)** | (0.008)** | (0.013)** | (0.015)** | (0.008)** | (0.015) |
| English | 0.040 | 0.044 | -0.094 | 0.056 | 0.044 | 0.032 | 0.051 | 0.051 |
| English (standard error) | (0.006)** | (0.006)** | (0.007)** | (0.006)** | (0.010)** | (0.011)** | (0.006)** | (0.011)** |
| Social Studies | 0.019 | 0.025 | 0.031 | -0.146 | 0.022 | 0.035 | 0.053 | 0.047 |
| Social Studies (standard error) | (0.007)** | (0.007)** | (0.006)** | (0.008)** | (0.012)* | (0.013)** | (0.007)** | (0.014)** |
| Foreign Language | 0.023 | 0.013 | 0.042 | 0.029 | -0.167 | 0.074 | 0.031 | 0.033 |
| Foreign Language (standard error) | (0.009)** | (0.010) | (0.009)** | (0.010)** | (0.011)** | (0.020)** | (0.010)** | (0.020)* |
| Business | -0.001 | 0.018 | 0.013 | 0.007 | 0.034 | -0.164 | 0.025 | 0.002 |
| Business (standard error) | (0.011) | (0.013) | (0.009) | (0.010) | (0.019)* | (0.013)** | (0.010)** | (0.025) |
| Art, Music, PE | 0.034 | 0.030 | 0.042 | 0.038 | 0.040 | 0.043 | -0.114 | 0.022 |
| Art, Music, PE (standard error) | (0.006)** | (0.006)** | (0.005)** | (0.006)** | (0.011)** | (0.011)** | (0.006)** | (0.011)** |
| Non-academic | 0.025 | 0.012 | 0.014 | 0.017 | -0.019 | 0.015 | 0.052 | -0.155 |
| Non-academic (standard error) | (0.011)** | (0.013) | (0.009) | (0.011) | (0.021) | (0.023) | (0.011)** | (0.011)** |
| 0.38 | 0.36 | 0.45 | 0.42 | 0.28 | 0.29 | 0.55 | 0.25 | |
| Classrooms | 208,176 | 206,513 | 209,873 | 208,083 | 169,594 | 170,719 | 209,220 | 166,626 |
| Clusters | 754 | 755 | 755 | 755 | 729 | 728 | 754 | 718 |
Notes : See notes to Tables 1 to 5 and Figure 1. Specifications are the same as in Table 5, but with course grades rather than course absences as the dependent variables. ** and *
indicate 5% and 10% significance, respectively.
| First Period Class is . . . | (1) Dependent Variable is Change in Classroom's Average z-Score from Fall to Spring, Math Difference | (2)Science Difference | (3)Reading Difference | (4)English Difference |
| Math | -0.027 | -0.038 | -0.059 | 0.009 |
| Math (standard error) | (0.019) | (0.023) | (0.023)** | (0.020) |
| Science | -0.028 | 0.013 | -0.022 | -0.033 |
| Science (standard error) | (0.021) | (0.023) | (0.025) | (0.024) |
| English | -0.029 | 0.032 | -0.023 | 0.006 |
| English (standard error) | (0.019) | (0.020) | (0.022) | (0.021) |
| Social Studies | -0.016 | -0.010 | 0.017 | -0.019 |
| Social Studies (standard error) | (0.023) | (0.024) | (0.024) | (0.020) |
| Foreign Language | -0.011 | -0.002 | -0.033 | -0.035 |
| Foreign Language (standard error) | (0.020) | (0.022) | (0.020) | (0.020)* |
| Business | 0.010 | -0.007 | 0.026 | 0.011 |
| Business (standard error) | (0.038) | (0.037) | (0.037) | (0.037) |
| Art, Music, PE | 0.050 | 0.014 | 0.044 | 0.033 |
| Art, Music, PE (standard error) | (0.024)** | (0.023) | (0.020)** | (0.022) |
| Non-academic | -0.046 | -0.047 | -0.073 | -0.056 |
| Non-academic (standard error) | (0.031) | (0.034) | (0.035)** | (0.033)* |
| 0.07 | 0.06 | 0.07 | 0.07 | |
| Classrooms | 33,415 | 33,380 | 33,388 | 33,414 |
| Clusters | 229 | 229 | 229 | 229 |
Notes : See notes to Tables 1 to 6 and Figure 1. Specifications are the same as in Tables 5 and 6, but
with change in test scores as the dependent variables and the controls for the average number of
classes taken in that subject replaced with the fraction with non-missing test scores and the fractions
taking each type of test. ** and * indicate 5% and 10% significance, respectively.
| (1) Geometry | (2) Algebra II | (3) French II | (4) Spanish II | |
| Geometry is First Period | -0.168 | |||
| Geometry is First Period (standard error) | (0.038)** | |||
| Algebra II is First Period | -0.124 | |||
| Algebra II is First Period (standard error) | (0.047)** | |||
| Algebra I was First Period | 0.013 | 0.021 | ||
| Algebra I was First Period (standard error) | (0.015) | (0.020) | ||
| French II is First Period | 0.220 | |||
| French II is First Period (standard error) | (0.264) | |||
| French I was First Period | 0.181 | |||
| French I was First Period (standard error) | (0.225) | |||
| Spanish II is First Period | -0.121 | |||
| Spanish II is First Period (standard error) | (0.166) | |||
| Spanish I was First Period | -0.107 | |||
| Spanish I was First Period (standard error) | (0.119) | |||
| 0.33 | 0.25 | 0.63 | 0.37 | |
| N | 7,690 | 6,995 | 211 | 602 |
| Clusters | 706 | 697 | 74 | 146 |
Notes : See notes to Tables 1 to 7 and Figure 1. The specifications are the same as in Table 6;
however, the students for the classroom averages are restricted to those who have taken specific
course sequences involving at least one semester of an introductory course (Algebra I, French I, or
Spanish I), and at least one semester of a later course that builds on that material (Geometry or
Algebra II, French II, or Spanish II). In each column, the sample of classrooms is restricted to those
with the course title listed in the column heading. The regressors of interest include indicators for
whether the more advanced class (Geometry or Algebra II, French II, or Spanish II) was first period
and classroom-level averages of whether each student's introductory class was first period. **
indicates statistical significance at the 5% level.