Litigation Risk, Strategic Disclosure
and the Underpricing of Initial Public Offerings
Keywords: Initial public offerings, disclosure, litigation, securities underwriting
Abstract:
I Introduction
When proposed by Tinic (1988) and Hughes & Thakor (1992) as a potential explanation for underpricing in initial public offerings (IPOs), litigation risk seemed both intuitively plausible and economically relevant.1 Section 11 of the Securities Act of 1933 gives investors the right to sue issuers and underwriters for declines in value below the offer price due to material omissions in the prospectus.2 Given the inherent uncertainty of an IPO, and the potential reputational losses associated with litigation, issuers and underwriters concerned about lawsuits may attempt to hedge litigation risk by underpricing.
Drake & Vetsuypens (1993), in the first empirical paper to study the effect of litigation risk, examine differences in initial returns between IPOs that are sued and those that are not and find no evidence that underpricing reduces the incidence of a lawsuit. Lowry & Shu (2002), however, take into account the endogeneity of initial returns and lawsuit incidence and find support for both an insurance and a deterrence effect as predicted by litigation risk theories. Despite this recent support, some researchers remain skeptical. Ritter & Welch (2002), in their review article, state "In our opinion, leaving money on the table appears to be a cost-ineffective way of avoiding lawsuits." This paper proposes an enriched litigation risk framework that can reconcile these disparate views.
The underlying assumption in existing studies of litigation risk is that stock market losses alone are sufficient to extract legal penalties. In reality, two conditions must be met. First, investors must have suffered damages in the form of investment losses. Second, investors must be able to produce evidence of a material omission in the firm's disclosure that existed at the time of their initial investment. Importantly, in our enriched litigation framework, plaintiffs must establish evidence of both losses and poor disclosure (an "and" not an "or" condition). In order to reduce litigation risk, therefore, issuers need to hedge only one of these conditions. This can be done by either underpricing (to reduce damages) or by enhancing disclosure (to reduce the probability of a material omission).
Our approach differs from prior studies of litigation risk in IPOs in that we examine both the firm's disclosure and pricing strategy. We hypothesize that disclosure and underpricing are substitute hedges against liability risk. In our enriched litigation framework, underpricing should be high only when a firm has a potential material omission (and vice versa). In other words, not all issuing firms will choose to use underpricing as a hedge. Therefore, the effect of underpricing in reducing incidences of litigation will be concentrated only in firms with a high probability of a material omission.
One reason why this enriched litigation risk framework has not yet been tested is that a "material omission" in a firm's prospectus is difficult to measure. With the advent of textual analysis, determining a firm's disclosure strategy is now feasible. We determine the likelihood of a material omission by examining how the issuing firm reacts to the arrival of new information during the offering period. In particular, we examine the intensity of revisions to the issuer's prospectus text over the same time interval as information gathering activities, such as bookbuilding and road shows, are being conducted. These activities often result in information material enough to generate large price revisions from the initial filing range to the final IPO price. The typical issuer files an initial prospectus and two to three revisions during the roughly three month period between the initial filing and the IPO date, giving us considerable power to assess any changes in disclosure over time.
We construct a proxy for the likelihood of a material omission in the prospectus using two conditions: (A) the extent to which the IPO price is revised since the initial filing estimate and (B) whether the initial prospectus is not substantially revised during the offering period. Condition (A) reveals the potential materiality of the new price-relevant information that arrived during the bookbuilding process. If condition A is sufficiently large, condition (B) reveals that this new information did not result in a change in the prospectus and hence, was not disclosed.
Specifically, we predict that the substitution effect of pricing for disclosure is increasing in the probability of a material omission. In this context, larger price revisions indicate that the new information is particularly relevant in determining the firm's offer price, and hence, we consider it more "material". As a result, an issuer who chooses not to revise their disclosure following a large price revision is particularly prone to successful litigation should the stock price decline ex-post.3
We find strong support for a substitution of pricing for disclosure as a hedge against litigation risk. The strongest substitution effect occurs when the proprietary value of the revealed information is likely to be high, i.e. in IPOs with positive price-relevant information generated during the offering period. The economic magnitude of these initial returns are substantial and are even larger still for issuers with high ex ante litigation risk.4 Thus, litigation risk plays an important role in the partial adjustment phenomenon and may explain why the underpricing of IPOs with positive information "seems too large to be explained as equilibrium compensation for revealing favorable information"(Ritter & Welch (2002)).5
The traditional interpretation of the litigation risk theory is that high underpricing can deter all lawsuits by reducing damages. But underpricing applies only to IPO purchasers and therefore, cannot deter lawsuits brought by aftermarket purchasers. In our enriched litigation framework, we propose and test an alternative view of the deterrence effect of initial returns. We show that the deterrence effect of underpricing is in reducing the probability that IPO investors will bring a lawsuit under Section 11.
We find that the primary benefit of deterring a Section 11 lawsuit is to reduce the likelihood of the underwriter being named in the suit and suffering reputational damage and subsequent market share losses.6 The risk of being named in a lawsuit and losing market share can explain why underwriters are willing to underprice substantially even when positive information is revealed.
Unlike initial returns, we show that enhanced disclosure can deter all lawsuits because it applies equally to both IPO investors and aftermarket purchasers. However, disclosure may be a more costlier mechanism to hedge litigation risk than underpricing if the new information has high proprietary value to the issuing firm.
Our findings contribute to the ongoing debate regarding the role of voluntary disclosure in shareholder litigation (e.g. Francis et al. (1994), Evans & Sridhar (2002), Field et al. (2005), Rogers & Buskirk (2009) and Lowry (2009)). While much of this literature has found that bad information is withheld and good information is disclosed (for example, Skinner (1994), Skinner (1997), and Healy & Palepu (2001)) we find the opposite to be true. We suggest that this is likely due to differences in incentives (Kothari et al. (2009)) and the regulatory environment surrounding the IPO process.
Finally, our paper adds to a growing body of work that uses word content analysis to analyze the informativeness of written disclosure. In the context of managing litigation risk, Nelson & Pritchard (2008), Mohan (2007) and Rogers et al. (2010) find that certain word usage is related to the probability of being sued. Hanley & Hoberg (2010) examine the information content of IPO initial prospectuses and its effect on pricing. Hoberg & Phillips (2010) use text similarity analysis to test theories of merger incidence and outcomes. Loughran & McDonald (2008) show that firms using Plain English have greater small investor participation and shareholder-friendly corporate governance. In other contexts, papers such as Antweiler & Frank (2004), Tetlock (2007), Tetlock et al. (2008), Li (2006), Boukus & Rosenberg (2006), and Loughran & McDonald (2010) find word content to be informative in predicting stock price movements.
The remainder of the paper is organized as follows: A brief discussion of the incentive to withhold or disclose information learned during bookbuilding is present in Section II. The data, word vector construction method and summary statistics are in Section III. Our method of classifying disclosure strategy is discussed in Section IV. The relation of disclosure strategy and litigation risk to initial returns (the insurance effect) is in Section V. How disclosure strategy and initial returns affect the probability of a lawsuit (the deterrence effect) is in Section VI. The economic consequence of lawsuits for underwriters is explored in Section VII. The paper concludes in Section VIII.
II Disclosure Incentives During the Offering Process
After receiving and addressing comments from the SEC on the initial prospectus, the underwriter and issuer begin the bookbuilding process. During the road show, the issuer conveys information regarding the future prospects of the firm (to be limited to the information in the prospectus) and investors provide feedback on the proposed offer price via indications of interest on the proposed price range.7
The issuing firm must decide whether to revise the offer price and disclose the information learned during the offering process. If the issuing firm is concerned about potential litigation, it will choose a combination of disclosure and underpricing that jointly minimize the two conditions for a lawsuit to be brought: a material omission in the prospectus and damages in the form of investment losses. Increased disclosure will lower the likelihood of a material omission while underpricing can reduce the damages of IPO investors and influence whether the lawsuit is brought under Section 11.
Both of these mechanisms, however, are costly. Underpricing leaves money on the table (Loughran & Ritter (2002)) while enhanced disclosure could reveal proprietary or strategic information to rivals (Darrough & Stoughton (1990), Bhattacharya & Chiesa (1995), and Maksimovic & Pichler (2001)). Whether the firm places greater emphasis on enhanced disclosure or underpricing is likely related to the type of information revealed during the offering process.
Issuing firms that receive bad information from investors have initial offer prices that are too high. In order to generate sufficient demand for the IPO, these firms will need to revise their offer prices downward. By reducing the offer price, the issuing firm may not have sufficient flexibility (for example to meet its capital raising goals) to hedge against litigation risk using initial returns. Hence, underpricing could be expensive as insurance against a lawsuit.8 Instead, IPOs with bad information revealed may decide to increase disclosure to mitigate liability.
Since bad information was revealed to the issuing firm by investors, it would be especially risky to withhold such information from the offering document.9 If the information is revealed shortly after the IPO, both conditions for a lawsuit are immediately met: investors will experience damages when the stock price declines following the announcement, and there will be evidence of a material omission. Since bad information has potentially low proprietary value to rivals and is unlikely to be concealed for long, there is little benefit and much cost in withholding negative information.10
Issuing firms that receive good information have initial offer prices which are too low. Because these IPOs have additional flexibility in pricing, they can easily substitute initial returns for disclosure to mitigate potential litigation risk.11 If disclosure is costly, then underpricing may be a more cost effective mechanism to hedge litigation risk.
Disclosure could be costly because it could reveal proprietary information to rivals. Consider the following extreme example: an IPO firm in industry X learns from investors during bookbuilding that its product can be potentially modified to solve a costly problem in industry Y. The IPO firm might wish to withhold this information because disclosing it might alert its industry X rivals. However, it is possible that existing firms in industry Y might solve the problem on their own. If existing firms in industry Y beat the IPO firm to the solution, the IPO firm's investment would be lost and its ex-post value will decline. Plaintiffs could argue that the issuing firm should have disclosed both the good information (new opportunities in industry Y) and the associated risk factor (industry Y solves the problem before the issuing firm can act). Thus, from a strategic disclosure perspective, neither can be disclosed in the IPO prospectus without essentially revealing the full information to rivals.
Another relevant factor is that the information learned during the offering process might be intangible or non-specific. For example, the issuing firm may only know that investors have valued their offering substantially above the expected offer price but may not be able to determine whether this is due to information about the issuing firm, market conditions, or even exuberance about the stock.12 In this case, it would be difficult to use disclosure as a hedge against litigation because the issuer's ability to disclose the information in a legally meaningful way is compromised. Thus, the issuer may prefer to use underpricing to reduce its liability risk rather than disclosure.
Our finding that IPO firms are more likely to withhold good information and disclose bad information is opposite some findings in the literature regarding non-IPO firms, which tend to conceal bad information and disclose good information. The above discussion highlights the complex interactions between incentives, regulation and the legal environment that is unique to the IPO process, which may account for this difference. Because information asymmetry is highest when a firm goes public, specific protections have been put into place to protect IPO investors, including an SEC review and legal recourse for material omissions in the prospectus. Further, the involvement of an underwriter, who can be named along with the issuer in a lawsuit, further affects the decision of the issuer to disclose or withhold information. Finally, unlike seasoned firms, IPO issuers have some control over pricing decisions which can be used to mitigate the litigation risk associated with the disclosure strategy.
A Sample and Word Vector Construction
Our initial list and characteristics of all U.S. IPOs issued between January 1, 1996 and October 31, 2005 is from the Securities Data Company (SDC) U.S. New Issues Database.13 We eliminate ADRs, unit issues, REITs, closed-end funds, financial firms, and firms with offer prices less than five dollars. A CRSP permno must also be available for an observation to remain in the sample, and the IPO must also have a valid founding date, as identified in the Field-Ritter dataset, as used in Field & Karpoff (2002) and Loughran & Ritter (2004).14 These initial exclusions reduce the sample to 2,112 IPOs.
For each IPO passing these initial screens, we use a web crawling algorithm to download the initial prospectus, and all subsequent amendments. In order for an IPO to remain in our sample, it must have available SEC Edgar filings online, which must also be machine readable. In order to satisfy our definition of machine readable, a Table of Contents pagination algorithm must be able to detect, and accurately identify, the start and end of the entire prospectus.15 This additional screen eliminates 69 IPOs, leaving us with 2,043 machine readable IPOs. Because these 69 IPOs are a small fraction of our sample, and because most are also small firms that file using an SB-2 (larger firms generally file an S-1), we do not believe that omitting these firms is problematic.
Our estimation of each IPO's initial prospectus similarity to past sued IPOs requires prospectus information from other IPOs that were sued in the past year. In order to have sufficient data for the estimation of this key variable, we further restrict the sample to IPOs that were issued on or after January 1, 1997. IPOs issued prior to that date (from 1996) are used only to compute starting values for this variable, and are otherwise discarded. This requirement reduces our sample to 1,623 IPOs which have a total combined document count (initial prospectus plus amendments) of 8,199.
Our algorithm to read each prospectus is written in a combination of PERL and APL. Once a document is downloaded and paginated, our algorithm's next step is to purge the document of attachments, headers, and exhibits so that we can focus on the prospectus itself. This is achieved using a three prong approach that ensures a high degree of accuracy: (1) we use the pagination implied by the Table of Contents to identify the beginning and end of the document, (2) we examine the placement of the "additional information" statement and the placement of accounting statements (exhibits) to confirm accuracy,16 and (3) we hand check the algorithm's accuracy for most documents and include exception handling where necessary.
For each IPO ![]() , we store the text of the prospectus in separate word vectors, which we define as
, we store the text of the prospectus in separate word vectors, which we define as ![]() . These vectors are based on word roots rather than actual words, and we also exclude certain types of words such as common words and/or articles. (For additional information on the word vector construction, see Appendix 1.) Note that all word vectors have the same length
(5,803) as they are based on the same global word list of 5,803 word roots. Each element of the vector is first populated by the count of the number of times the word is used in the given document. Because we use the cosine similarity method to normalize vectors prior to using them in calculations,
our final variables are based on relative word frequencies and not nominal word counts (consistent with other studies).
. These vectors are based on word roots rather than actual words, and we also exclude certain types of words such as common words and/or articles. (For additional information on the word vector construction, see Appendix 1.) Note that all word vectors have the same length
(5,803) as they are based on the same global word list of 5,803 word roots. Each element of the vector is first populated by the count of the number of times the word is used in the given document. Because we use the cosine similarity method to normalize vectors prior to using them in calculations,
our final variables are based on relative word frequencies and not nominal word counts (consistent with other studies).
B IPO and Lawsuit Variables
We compute a number of variables that are common to the existing IPO literature. ![]() is underwriter's price adjustment from the filing date to the IPO date, and
is underwriter's price adjustment from the filing date to the IPO date, and ![]() (initial return) is the market's price adjustment from
(initial return) is the market's price adjustment from ![]() to
to ![]() . Investors who purchase shares at the IPO price,
. Investors who purchase shares at the IPO price, ![]() , can realize returns equal to
, can realize returns equal to
![]() by selling their shares at the closing price on the first day of public trading.
by selling their shares at the closing price on the first day of public trading.
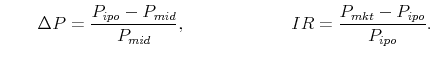
![]() ,
, ![]() , and
, and ![]() are the filing date midpoint, the IPO price, and the aftermarket trading price, respectively.
are the filing date midpoint, the IPO price, and the aftermarket trading price, respectively.
We also control for the following variables identified in the existing IPO literature:
 P+: The positive component of
  equal to
![\max[{\Delta}P,0]](img11.gif) . This variable controls for the partial adjustment phenomenon documented in Hanley (1993) and was first used in Lowry & Schwert (2002).
. This variable controls for the partial adjustment phenomenon documented in Hanley (1993) and was first used in Lowry & Schwert (2002).- P-: The negative component of equal to
![\min[{\Delta}P,0]](img12.gif) .
. - Firm Age: IPO year minus the firm's founding date, where founding dates are obtained from the Field-Ritter dataset, as used in Field & Karpoff (2002) and Loughran & Ritter (2004).
- Lead UW $ Market Share: Lead underwriter's dollar market share in the past calendar year as calculated by Megginson & Weiss (1991).
- Law $ Market Share: The dollar market share of legal counsel in the past calendar year and a separate variable is constructed for the lead underwriter's legal counsel and the issuer firm's legal counsel.
- VC Dummy: Dummy variable equal to one if the firm is VC-backed, and zero otherwise as in Barry et al. (1990).
- Nasdaq Return: We construct two measures of this variable. Our first is the NASDAQ return for the 30 trading days preceding the filing date. Our second is the NASDAQ return for the 30 trading days preceding the issue date. Logue (1973) first examined whether past market returns can predict future underpricing, and this measure has been used more recently by Loughran & Ritter (2002).
- IPO Size: We construct two measures of this variable. Our first is the natural logarithm of the original filing amount. Our second is the natural logarithm of the offering amount.
- Tech Dummy: Dummy variable equal to one if a firm resides in a technology industry as identified in Loughran & Ritter (2004).
- Risk: Equal to (1/
 ) as in Bradley & Jordan (2002).
 - Volatility: Firm risk using the matching method in Lowry & Shu (2002).
- Informative Content and Standard Content: The amount of informative and standard content in the initial prospectus from Hanley & Hoberg (2010).
- Carter/Manaster Rank: Underwriter rankings by Carter & Manaster (1990) and Carter et al. (1998) as updated by Loughran & Ritter (2004).
- Fraction Secondary Shares: Percent of secondary shares or shares sold by insiders.
Table I presents summary statistics on the various measures we employ in this paper. Panel A has information on the price variables, and our sample is similar to other studies that include the bubble period of 1999 and 2000. On average, this sample of IPOs has an
average initial return of 38% with a much lower median of 15%. The average change in the offer price from the first initial price range midpoint to the final offer price is 5.0%. ![]() P+, the
positive component of offer price changes, averages 12% while
P+, the
positive component of offer price changes, averages 12% while ![]() P-, the negative component of offer price changes, averages -7%.
P-, the negative component of offer price changes, averages -7%.
Panel B displays statistics for IPO characteristics. The mean IPO files an offer amount of approximately $214 million. The average age of the firm is almost 14 years but the median is significantly smaller at 7 years. Fifty percent of the IPOs have venture capital backing and 46% are classified as tech firms as defined in Loughran & Ritter (2004). The average market share of the underwriter in the year prior to the offer is 3.0%. Consistent with Lowry & Schwert (2002), IPOs are brought to market when prior returns are high, with an average return in the thirty days prior to filing of approximately 5%.
Panel C presents summary statistics describing the prospectus and revision variables. The average document has a total of almost 10,000 root words. Since the number of possible unique root words is 5,803, an average number of root words for the document as a whole of almost 10,000 means that some root words appear more frequently. The average issuer files four amendments to the initial prospectus for a total of five prospectus filings.
We collect information on all class action lawsuits for up to three years after the IPO date from Stanford Law School's Securities Class Action Clearinghouse. We require that the lawsuit be disclosure-based (material omission) which results in 165 IPOs with a class action lawsuit that meets our criteria. Our class action lawsuit dummy is one if an IPO is sued based on this sample of lawsuits.17
Unlike prior studies of litigation in IPOs, we include both Section 11 and Section 10b-5 lawsuits. Including both types of lawsuits is important because IPO shareholders are likely to be members of the lawsuit class and the underwriter named in the lawsuit only if it is brought under Section 11. Because we hypothesize that the deterrence effect of underpricing may be limited to excluding IPO investors from the class but not preventing aftermarket purchasers from initiating a lawsuit, we need to distinguish between the types of lawsuits in order to ascertain the types of investors and participants involved in the litigation. Overall, 10% of IPOs in our sample are subsequently involved in a shareholder lawsuit, and roughly half of these lawsuits are Section 11 lawsuits. Thus, our sample of lawsuits is broader than Lowry & Shu (2002) who concentrate only on Section 11 lawsuits.
Table II presents summary statistics, by year, describing lawsuit characteristics. Not surprising, the largest number of lawsuits occur for IPOs that were issued at the height of the technology bubble. As a percentage, however, the highest percentage of lawsuits occurs in IPOs issued in 2001.
Settlements yield roughly 8-10% of sued IPO proceeds.18 For IPOs issued in 1998, however, settlements are 23% of all IPO proceeds and 38% of the proceeds for the subsample of IPOs that were sued.
The average length of time between the IPO date and the initiation of the lawsuit is approximately 1 1/2 years, a bit longer than in Lowry & Shu (2002). This is because our sample includes both Section 11 and Section 10b-5 lawsuits. If we restrict the sample to Section 11 lawsuits, only, the median number of days between IPO and filing of lawsuit is similar to Lowry & Shu (2002).
IV Classification of Disclosure Strategy
Our measure of disclosure is based on classifying how intensely an issuer revises its prospectus during bookbuilding. We suggest that the greater is the revision intensity, the higher is the issuer's disclosure of new information learned after the filing of the initial prospectus. The issuer's revision intensity incorporates both the time series of prospectus amendments and the severity of the revisions to the initial prospectus and each amendment.
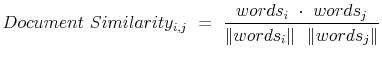
Consistent with Hanley & Hoberg (2010) and Hoberg & Phillips (2010), we measure how similar document content is using the cosine similarity method. Its opposite, one minus the document similarity, is how dissimilar or distant is the content between two documents. This method is also widely used in studies of information processing (see Kwon & Lee (2003) for more information), and its name is due to its measuring the angle between two word vectors on a unit sphere (see Appendix 1 for more details).
In order to characterize revision intensity , we must first expand our notation. Let
![]() denote the word usage in IPO
denote the word usage in IPO ![]() 's initial prospectus, and
's initial prospectus, and
![]() is analogously defined for IPO
is analogously defined for IPO ![]() 's
's ![]() -th prospectus. An IPO with
-th prospectus. An IPO with ![]() total filings (including the initial prospectus and all amendments with the exception
of the final prospectus filed after the IPO date) is thus described by the series of vectors {
total filings (including the initial prospectus and all amendments with the exception
of the final prospectus filed after the IPO date) is thus described by the series of vectors {
![]() , ...,
, ...,
![]() }. We denote the series of
}. We denote the series of ![]() document distances (which is simply one
minus document similarity) summarizing the time series of revisions from the initial prospectus to the final version as {
document distances (which is simply one
minus document similarity) summarizing the time series of revisions from the initial prospectus to the final version as {![]() , ...,
, ..., ![]() }. Since distance is measured using two adjacent pairs of documents in a given time series,
}. Since distance is measured using two adjacent pairs of documents in a given time series, ![]() is the document distance
between IPO
is the document distance
between IPO ![]() 's
's ![]() th filing and its
th filing and its ![]() th filing.
th filing.
Table III presents a summary of prospectus and amendment filing patterns. As can be seen in Panel A, the majority of IPOs in the sample have an initial prospectus and at least three amendments. The total distance from the previous amendment which is measured
as ![]() , is highest for the first revision after the initial prospectus. By the second and third amendment, approximately 94% of change in content has occurred.
, is highest for the first revision after the initial prospectus. By the second and third amendment, approximately 94% of change in content has occurred.
After the filing of the initial prospectus with the SEC, there are two primary reasons for a substantial prospectus revision:19 1) regulators request revisions through the comment letter process and 2) the issuer can decide to revise the prospectus voluntarily. We refer to the former type as "RD-revisions" (regulation-driven) and the latter type as "ID-revisions" (issuer-driven). This dichotomy is important because our primary hypothesis relates to the voluntary, rather than involuntary or potentially SEC-driven, component of disclosure during the IPO process.20 Conversations with practitioners indicate that the first major revision (usually appearing as the first or second amendment to the initial filing) is the primary RD-revision in the U.S. That is, the SEC generally comments on every IPO, and their requests are usually factored in by issuers in amendments filed soon after the initial prospectus.21
We define the major RD-revision in each IPO's time series as the largest revision among the first two revisions (where ![]() =
=
![]() ).22 Because issuers
generally address SEC comments prior to distributing the prospectus to prospective investors, the variable
).22 Because issuers
generally address SEC comments prior to distributing the prospectus to prospective investors, the variable ![]() which focuses on the first two revisions, likely captures the issuer's response
to these comment letters. We omit this revision from our series of ID-revisions as our hypothesis only relates to voluntary revisions based upon information generated during bookbuilding. Because each series is likely to contain a large firm-specific revision effect, we scale the series of
ID-revisions by
which focuses on the first two revisions, likely captures the issuer's response
to these comment letters. We omit this revision from our series of ID-revisions as our hypothesis only relates to voluntary revisions based upon information generated during bookbuilding. Because each series is likely to contain a large firm-specific revision effect, we scale the series of
ID-revisions by ![]() . This controls for firm characteristics and writing style in the measurement of specific ID-revisions.23 We denote ID-revisions for each IPO
. This controls for firm characteristics and writing style in the measurement of specific ID-revisions.23 We denote ID-revisions for each IPO ![]() 's
's ![]() -th time series pair of amendments (not including the RD-revision) as:
-th time series pair of amendments (not including the RD-revision) as:
 |
(2) |
with a maximum of N-2 possible ![]() s.
s.
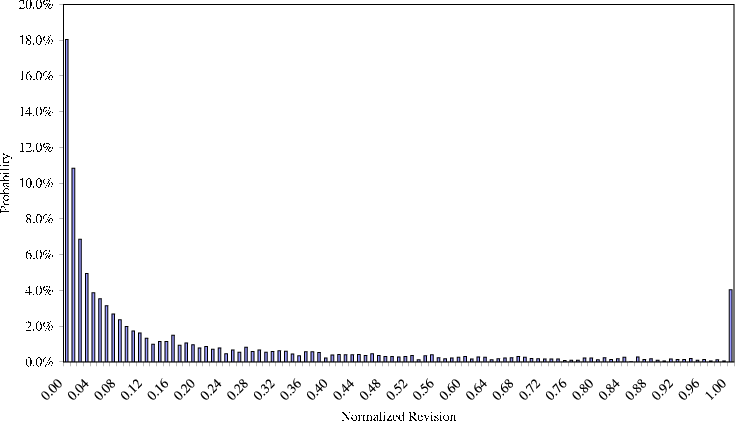
As can be seen from Figure 1, there is a significant amount of clustering close to zero for the value of any individual ![]() . For example, a large number of revisions are near zero, but the median normalized revision is between .05 and .06. In order to control for this clustering, we classify whether an issuer is a "low" revisor or "high" revisor using a
dummy variable. The low revisor dummy takes the value of one if at least two-thirds of the given IPO's ID-revisions are below the median among all ID-revisions for all IPOs issued in the same year. The high revisor dummy is equal to one minus the low revisor dummy. The value of two-thirds is based
upon Table III in which many IPOs in our sample have at least three revisions.24 Table IV
presents summary statistics on the revisor dummy and the interaction terms. Approximately 38% of the sample is classified as a low revisor.
. For example, a large number of revisions are near zero, but the median normalized revision is between .05 and .06. In order to control for this clustering, we classify whether an issuer is a "low" revisor or "high" revisor using a
dummy variable. The low revisor dummy takes the value of one if at least two-thirds of the given IPO's ID-revisions are below the median among all ID-revisions for all IPOs issued in the same year. The high revisor dummy is equal to one minus the low revisor dummy. The value of two-thirds is based
upon Table III in which many IPOs in our sample have at least three revisions.24 Table IV
presents summary statistics on the revisor dummy and the interaction terms. Approximately 38% of the sample is classified as a low revisor.
The main idea behind the revisor dummy is to identify issuers that do or do not revise their prospectus as they learn new information during bookbuilding. An issuer that files mainly price change only amendments, for example, will have ID-revisions below the median size, and will, thus, be categorized as a low revisor. A key idea is that an issuer that has a large price adjustment, but is also a low revisor, is likely to have a material omission in the prospectus as they did not disclose the information underlying the price change.
Returning to Table III, interesting differences in the revision patterns of high and low revisors are shown in Panels B and C. Low revisors have higher content revisions on the first amendment but converge much quicker to a final document than high revisors. By the fourth amendment after the initial prospectus, low revisors have almost completely converged to the final amendment. In contrast, high revisors take until the sixth amendment to reach the same degree of convergence.
From a statistical standpoint, the ![]() -stat of the difference in means of the cumulative convergence by the second filing between high and low revisors is 16.36. The
-stat of the difference in means of the cumulative convergence by the second filing between high and low revisors is 16.36. The ![]() -stats on the differences in convergence from the third to sixth filings are 14.76 (third), 8.95 (fourth), 6.13 (fifth), and 3.88 (sixth). These statistics suggest a marked difference in prospectus
revision strategy between our classifications of high and low revisors.
-stats on the differences in convergence from the third to sixth filings are 14.76 (third), 8.95 (fourth), 6.13 (fifth), and 3.88 (sixth). These statistics suggest a marked difference in prospectus
revision strategy between our classifications of high and low revisors.
Table V examines differences in IPO characteristics based on whether the issuer is a low or high revisor. The table presents evidence of the strong relationship between disclosure strategy, ![]() P, initial returns, and litigation outcomes. IPOs that are low revisors, those that are hypothesized to withhold information learned during bookbuilding, have significantly higher initial returns and are more likely to have positive changes in the offer
price. Low revisors have an average initial return of 46.6% compared to 32.6% for high revisors and low revisors also have a higher likelihood of a future lawsuit.
P, initial returns, and litigation outcomes. IPOs that are low revisors, those that are hypothesized to withhold information learned during bookbuilding, have significantly higher initial returns and are more likely to have positive changes in the offer
price. Low revisors have an average initial return of 46.6% compared to 32.6% for high revisors and low revisors also have a higher likelihood of a future lawsuit.
Firms with
![]() have a statistically higher proportion of high revisors than low revisors which supports our initial conjecture that firms with negative information generated during
bookbuilding have little incentive to withhold information. In contrast, firms with
have a statistically higher proportion of high revisors than low revisors which supports our initial conjecture that firms with negative information generated during
bookbuilding have little incentive to withhold information. In contrast, firms with
![]() have a higher proportion of low revisors than high revisors and this result is consistent with the incentives to withhold good information for proprietary or strategic reasons
and use underpricing as a hedge. Other firm characteristics, such as venture capital backing, underwriter market share and whether or not the IPO is a tech firm do not differ. These relationships confirm our finding that the results of the paper are robust to including numerous controls including
technology firms, venture capital backing, and industry and time fixed effects.
have a higher proportion of low revisors than high revisors and this result is consistent with the incentives to withhold good information for proprietary or strategic reasons
and use underpricing as a hedge. Other firm characteristics, such as venture capital backing, underwriter market share and whether or not the IPO is a tech firm do not differ. These relationships confirm our finding that the results of the paper are robust to including numerous controls including
technology firms, venture capital backing, and industry and time fixed effects.
V The Effect of Disclosure Strategy and Litigation Risk on Underpricing
The prior literature on liability risk and underpricing has documented a positive relation between initial returns and subsequent lawsuits that Lowry & Shu (2002) term the "insurance effect". We conjecture, however, that insurance in the form of initial returns is only needed when the issuer withholds information learned during bookbuilding and has a high probability of a material omission. The amount of insurance purchased (underpricing) should be related to both the issuer's disclosure strategy as well as its exposure to liability risk.
We begin by replicating the traditional initial return regression that includes a dummy variable indicating whether or not the IPO had a subsequent lawsuit as an independent variable. This regression is presented in Panel A of Table VI. Like Drake & Vetsuypens (1993) and Lowry & Shu (2002), we find no difference in initial returns between sued IPOs and non-sued IPOs using an ex post class action lawsuit dummy. However, as Lowry & Shu (2002) correctly note, the relation between initial returns and liability risk is endogenous. Firms with greater liability risk will underprice more (positive relation between liability risk and initial returns) while firms that underprice more will have a lower incidence of lawsuits (negative relation between liability risk and initial returns).
We control for this endogeneity by following the simultaneous-equation approach of Lowry & Shu (2002) for assessing the effect of litigation risk on initial returns. Instead of using the turnover of a matched sample of firms as an instrument for litigation risk
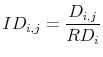
as they do, we directly measure how similar a given IPO's prospectus is to the prospectuses of past IPOs that were sued in the one year prior to the current IPO's filing.25 In particular, for a given IPO "![]() ", suppose
", suppose ![]() past
IPOs were sued in the one year period ending on IPO
past
IPOs were sued in the one year period ending on IPO ![]() 's filing date. We measure similarity using the cosine similarity method (described in Section IV and in
Appendix 1), and denote the cosine similarity between the initial prospectuses of IPO
's filing date. We measure similarity using the cosine similarity method (described in Section IV and in
Appendix 1), and denote the cosine similarity between the initial prospectuses of IPO ![]() and one of the past
and one of the past ![]() sued IPOs (IPO
sued IPOs (IPO ![]() ) as
) as ![]() . We then define
"Sued IPO Similarity" for IPO
. We then define
"Sued IPO Similarity" for IPO ![]() as follows.
as follows.
Sued IPO Similarity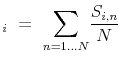 |
(3) |
The greater the similarity to past sued IPOs, the greater is the IPO's exposure to future liability.
Because this variable is based on public information known at the time of initial filing, its impact should be factored into the initial offer price (or range). This is a key requirement making it a valid instrument for litigation risk in regressions examining initial returns. In addition, this variable significantly predicts ex-post litigation activity, satisfying a second key requirement. A logistic regression with the class action lawsuit dummy variable as the dependent variable and Sued IPO Similarity plus our control variables as independent variables yields a significant coefficient, at the 1% level, on the Sued IPO Similarity variable (see Section VI).
In Row 2 of Panel A of Table VI, we confirm the Lowry & Shu (2002) insurance effect as there is a significant positive relation between our instrumented measure of ex ante liability risk and initial returns. Thus, these findings indicate that initial returns are influenced by potential litigation.
However, we conjecture that initial returns are needed as insurance only when there is the potential for a material omission in the prospectus. Row 2 of Panel A includes, in addition to instrumented litigation risk, the low revisor dummy variable and shows that initial returns are greater when the issuer is classified as a low revisor. These findings point to a potential substitution effect between pricing and disclosure in hedging against liability risk.26
The type of information revealed should impact the issuer's choice when making the tradeoff between disclosure and underpricing as litigation hedges. Therefore, we include an interaction term between the disclosure strategy (revisor dummy) and the type of information (![]() P) revealed during bookbuilding. In Row 3, we find that substitution toward disclosure is most pronounced for IPOs with bad information revealed during bookbuilding. For example, IPOs with negative
price changes (
P) revealed during bookbuilding. In Row 3, we find that substitution toward disclosure is most pronounced for IPOs with bad information revealed during bookbuilding. For example, IPOs with negative
price changes (![]() P-) and high revisions in the prospectus have significantly lower initial returns all else equal.
P-) and high revisions in the prospectus have significantly lower initial returns all else equal.
In contrast, the substitution toward initial returns is most pronounced for IPOs with positive information revealed during bookbuilding. The largest initial returns are associated with IPOs having positive price changes that do not revise their prospectus (Low Revisor Dummy x ![]() P+). These IPOs have 42% higher initial returns than similar IPOs that do revise the prospectus in response to positive information.27 This relationship is also robust to the exclusion of technology firms (Panel B). Thus, the relationship in the prior literature between underpricing and litigation risk is primarily due to IPOs that do not
disclose positive information learned during bookbuilding. Overall, the results of Panels A and B indicate a strong substitution effect between disclosure and pricing decisions that is influenced by the type of information revealed during bookbuilding.
P+). These IPOs have 42% higher initial returns than similar IPOs that do revise the prospectus in response to positive information.27 This relationship is also robust to the exclusion of technology firms (Panel B). Thus, the relationship in the prior literature between underpricing and litigation risk is primarily due to IPOs that do not
disclose positive information learned during bookbuilding. Overall, the results of Panels A and B indicate a strong substitution effect between disclosure and pricing decisions that is influenced by the type of information revealed during bookbuilding.
We further parse the sample into IPOs that are hypothesized to be most affected by litigation risk in Panels C and D. We define an IPO as having high ex ante litigation risk if its Sued IPO Similarity is above the median. The difference in the amount of underpricing between high and low revisors
with ![]() P+ for a one standard deviation change is 56% in Panel C and 154% in Panel D.28 The large difference in initial returns suggests that a significant portion of the positive relation between
P+ for a one standard deviation change is 56% in Panel C and 154% in Panel D.28 The large difference in initial returns suggests that a significant portion of the positive relation between ![]() P and
underpricing, the partial adjustment phenomenon, is due to the issuer's efforts to mitigate litigation risk.
P and
underpricing, the partial adjustment phenomenon, is due to the issuer's efforts to mitigate litigation risk.
Further evidence on the economic impact of litigation on the partial adjustment phenomenon is presented in Table VII. This table includes only IPOs with
![]() , and the sample is broken into terciles of
, and the sample is broken into terciles of ![]() P+ as well as
whether or not the IPO is classified as a low revisor or a high revisor. In addition to raw initial returns, we also show the residual initial returns which are the residuals from a regression of raw initial returns on all variables from Table VI excluding price
adjustment and change in disclosure variables. The residual initial return is thus a measure of the unexpected initial return after controlling for firm, market and offering characteristics.
P+ as well as
whether or not the IPO is classified as a low revisor or a high revisor. In addition to raw initial returns, we also show the residual initial returns which are the residuals from a regression of raw initial returns on all variables from Table VI excluding price
adjustment and change in disclosure variables. The residual initial return is thus a measure of the unexpected initial return after controlling for firm, market and offering characteristics.
Within each tercile and across all panels, low revisors with positive price changes have much higher initial returns than high revisors. In addition, for almost all subsets of low and medium ![]() P+, the residual initial return is either negative or close to zero. We interpret this to mean that when there is only a small amount of positive information generated during bookbuilding, there is little incentive to provide high initial returns and/or to revise the prospectus
in response to new information.
P+, the residual initial return is either negative or close to zero. We interpret this to mean that when there is only a small amount of positive information generated during bookbuilding, there is little incentive to provide high initial returns and/or to revise the prospectus
in response to new information.
This is not the case for IPOs that increase their offer price substantially. These IPOs are likely to have a significant amount of unexpected new information generated during bookbuilding that is eventually incorporated into the final offer price. If there is a large price change, but no
significant revision in the offering prospectus, there is a higher probability of a material omission and we expect a greater reliance on underpricing to hedge litigation risk. The economic magnitude of the difference in initial returns between high revisors and low revisors supports this
conjecture. For the tercile with the largest ![]() P+, residual initial returns for low revisors are twice as large as those for high revisors for the full sample and four times as large after
excluding technology firms. Raw initial returns follow a similar pattern but with a lower magnitude.
P+, residual initial returns for low revisors are twice as large as those for high revisors for the full sample and four times as large after
excluding technology firms. Raw initial returns follow a similar pattern but with a lower magnitude.
Of particular interest are Panels C and D which include only
![]() IPOs that are most likely to be exposed to litigation risk. Low revisors in these panels not only have the highest amount of residual initial return but also the largest
divergence from high revisors. Like Panel D of Table VI, low revisor non-tech IPOs that have the highest exposure to ex ante litigation risk have residual initial returns of almost 49% compared to a negative 2% for similar high revision IPOs. Raw initial returns for low
revisors are over 100% while raw initial returns for high revisors are 46%.
IPOs that are most likely to be exposed to litigation risk. Low revisors in these panels not only have the highest amount of residual initial return but also the largest
divergence from high revisors. Like Panel D of Table VI, low revisor non-tech IPOs that have the highest exposure to ex ante litigation risk have residual initial returns of almost 49% compared to a negative 2% for similar high revision IPOs. Raw initial returns for low
revisors are over 100% while raw initial returns for high revisors are 46%.
Overall, we confirm and strengthen Lowry & Shu (2002)'s insurance effect in two ways. First, we find that only firms with a likely material omission have a strong insurance effect in initial returns. Second, this effect is primarily driven by firms with positive information revealed during bookbuilding; those IPOs with the strongest incentive to withhold information and the highest likelihood of a material omission. Consistent with our enriched litigation framework, we find evidence that only those IPOs that do not revise their prospectus in response to new information and have a greater likelihood of a material omission need to use underpricing as insurance against future lawsuits.
VI The Effect of Disclosure Strategy and Initial Returns on Lawsuit Incidence
Table VIII presents a logistic regression designed to test the deterrence effect of initial returns on the probability of a subsequent lawsuit. As in Lowry & Shu (2002), we instrument initial returns using the 30 day Nasdaq return prior to the filing of the initial prospectus along with other control variables. Row 1 replicates the well-known result from Drake & Vetsuypens (1993), that the level of initial return is unrelated to the presence of a subsequent lawsuit. After initial returns are instrumented to control for endogeneity in Row 2, we do not find a significant relation between instrumented initial returns and whether or not the IPO was subject to ex post litigation.29
In Row 3, we include the disclosure strategy of the IPO. Issuers classified as low revisors are significantly more likely to have a subsequent lawsuit. Analogously, issuers that increase disclosure, high revisors, are significantly less likely to be sued after the IPO. In contrast to initial returns, we find that disclosure of more information learned during bookbuilding does reduces the probability a future lawsuit.
Row 4 presents the results related to the interaction between the type of information revealed during bookbuilding and disclosure strategy. Consistent with our prior findings, IPOs with negative changes in their offer price are less likely to be involved in subsequent lawsuits although this relationship is insignificant. In contrast, IPOs with positive changes in offer price, particularly those that do not revise their prospectus, are significantly more likely to be subject to litigation. These findings are consistent for the remaining panels of the table (Panels B, C and D) that either exclude tech firms and/or include IPOs which are more likely to have high ex ante litigation risk.30
The fact that that IPOs with positive price changes are more likely to be sued may seem counterintuitive as one might conjecture that firms learning bad information should be more likely to be involved in a lawsuit. However, this ignores the response of the issuing firms to both the information learned and the legal environment. If bad information is revealed, there is little benefit to withholding information, particularly if it will be revealed in the short term and the stock price will fall. As a result, firms learning bad information avoid this scenario by revising the prospectus and disclosing the information. In addition, underpricing becomes more expensive as a substitute to disclosure when bad information is revealed because the firm faces lower than expected proceeds to fund its planned uses of proceeds.
When good information is revealed, the issuing firm must choose to disclose the information or withhold it for strategic reasons. Since information revealed is only the mean estimate of the value of the information, the distribution of possible outcomes can include an ex post negative realization even if the mean value is positive.31 Those IPOs with good information that revise their prospectus significantly and hence, reduce their chance of a material omission are not at a greater risk of a lawsuit. Only those IPOs that do not revise their prospectus are more likely to be sued.
Overall, lawsuits are more likely when the likelihood of a material omission is higher (as proxied for Low Revisor Dummy x ![]() P+) and when the IPO looks more like an IPO that was sued in
the past. Unlike disclosure, however, initial returns have low power to deter subsequent lawsuits. What then, does underpricing deter? In the next section, we show that, in the event of litigation, underpricing can be a strong hedge against IPO investor involvement in the lawsuit which can, in
turn, prevent substantial damages to underwriter reputation.
P+) and when the IPO looks more like an IPO that was sued in
the past. Unlike disclosure, however, initial returns have low power to deter subsequent lawsuits. What then, does underpricing deter? In the next section, we show that, in the event of litigation, underpricing can be a strong hedge against IPO investor involvement in the lawsuit which can, in
turn, prevent substantial damages to underwriter reputation.
A What Does Underpricing Deter?
Prior studies that hypothesize that underpricing is a hedge against litigation risk do not take into consideration the fact that the primary plaintiff in most ex post lawsuits is an aftermarket shareholder. Aftermarket investors are more likely to be part of a lawsuit because they often buy at higher prices than IPO purchasers and therefore, their threshold for claiming damages is lower. Since the price aftermarket investors pay is unaffected by and does not include any underpricing, underpricing cannot insure against the incidence of litigation. In our sample of lawsuits, we do not have a single lawsuit that does not also include aftermarket purchasers. What underpricing can do, however, is deter IPO investors from suing the issuer under Section 11.32
Given this institutional and legal detail, a key benefit of insuring against Section 11 lawsuits is to significantly reduce the probability that the underwriter will be named in the suit, and that IPO investors will not be part of the class if a lawsuit does occur. In order to examine if there is a link between Section 11 and naming the underwriter as a defendant, we reviewed each lawsuit to determine if the underwriter is indeed named in the complaint. Among the 165 lawsuits in our sample, the underwriter is named in 55 lawsuits. Consistent with an unequivocal link to Section 11 lawsuits, 52 of the 55 lawsuits in which the underwriter is named are, in fact, Section 11 lawsuits. These 52 lawsuits constitute more than two thirds of the 74 lawsuits that are filed under Section 11.33
The relevance of appeasing IPO shareholders is further supported by the findings of Cheng et al. (2009), who show that lawsuits with an institutional lead plaintiff are less likely to be dismissed and have significantly larger settlements. As most IPO investors are institutional investors (Hanley & Wilhelm (1995), Cornelli & Goldreich (2003), Aggarwal et al. (2002), Ljungqvist & Wilhelm (2002) and Jenkinson & Jones (2004)) this provides additional motivation as to why issuers (and underwriters) may be motivated to exclude IPO investors from the class.
Unlike underpricing which can only influence litigation from one type of investor (IPO shareholders), the deterrence effect of disclosure as a defense against a material omission applies equally to all plaintiffs regardless of when they purchased their shares. This conclusion is supported by results in Table VIII, which shows that issuers who disclose more information (high revisors) are indeed less likely to be sued.
In order to test whether IPO investors can be deterred from initiating a Section 11 lawsuit using initial returns, we consider all disclosure-based class action lawsuits within three years of the IPO, both Section 11 and Section 10b-5, and then examine what factors influence a Section 11 filing. Our method differs from prior examinations of litigation risk in IPOs that restrict their sample to Section 11 lawsuits only.
In Table IX, using a logit model based on the sample of all sued IPOs, we estimate the effect of initial returns on the incidence of a Section 11 filing. Additional independent variables included in this specification are the log of days to lawsuit and the log of the post-issue return from the closing price on the first day of trading to the date the lawsuit is announced. We expect that the greater the number of days to the lawsuit, the less likely the suit will be brought under Section 11 because the reliance of a claim of a material omission in the prospectus is more likely to occur sooner rather than later. The more negative the stock price return, the more likely that the aftermarket trading price will fall below the offer price. Therefore, IPO shareholders are more likely to suffer damages even in the presence of underpricing.
Panel A of Table IX includes all sued IPOs, Panel B includes only sued IPOs with positive price revisions, Panel C includes only sued IPOs with high ex ante litigation risk, and Panel D excludes tech IPOs. Regardless of the type of sample examined, the results indicate a strong deterrence effect for underpricing on the incidence of a Section 11 filing. Initial returns (instrumented or non-instrumented) are negatively and significantly related to the probability that the lawsuit will be brought under Section 11. As expected, this relationship is strongest for IPOs with upward changes in their offer price.
These results support our enriched litigation framework, as we find that the deterrence effect of initial returns is not against preventing all lawsuits, but in providing a disincentive for IPO investors to bring a suit under Section 11. Deterring a Section 11 lawsuit can be important because we also find that it greatly reduces the probability that the underwriter will be named in the suit. The next section shows how underwriter damages differ by the type of lawsuit and in particular, that such damages are related to whether or not the lawsuit is brought by IPO investors under Section 11, and whether the underwriter is named.
VII Economic Effect of Lawsuits
Given the considerable cost of insuring against potential lawsuits, we now examine whether it is worthwhile for the underwriter, in particular, to underprice an issue as a hedge against probability of a Section 11 lawsuit.34 Given the competitive nature of the market for investment banking services, it would seem logical that competitors would use the existence of a lawsuit as a basis for gaining market share. Using a sample of 29 investigations, Beatty et al. (1998) document significant declines in IPO market share for underwriters after the announcement of an SEC investigation.35
We examine whether lawsuits affect the change in the lead underwriter's market share which is measured as the yearly change in the fraction of total proceeds underwritten. The independent variable, Class Action Lawsuits, is the natural logarithm of one plus the number of IPOs brought to market by the specific underwriter that are involved in class action lawsuits in the previous three years. A different form of this variable is used in each of the six different specifications for the change in market share: 1) all lawsuits, 2) non-tech lawsuits only, 3) Section 11 lawsuits, 4) non-Section 11 lawsuits, 5) lawsuits which specifically name the underwriter as a defendant and 6) lawsuits which do not name the underwriter as a defendant. We also include as a control variable the lagged yearly market share of the underwriter to control for changes in market share outside of the class action lawsuit.
The results in Table X show a strong relation between the incidence of a class action lawsuit and subsequent market share when either the lawsuit is brought under Section 11 or the underwriter is named as a defendant. Lawsuits not brought under Section 11 or where the underwriter is not named as a defendant, have no effect on market share.
The economic magnitude of being sued can be inferred from the table. If an IPO firm brought to market by an underwriter is sued under Section 11, the dollar loss in proceeds to the lead underwriter in the following year is $131 million ((-0.998 (coeff) x 0.3418 (std. dev.))/100 x $38.5 billion (total proceeds)). Assuming a 7% commission and our average underpricing of 38%, the total amount of lost value to underwriters is almost $59 million ($9 million in fees and $50 million in underpricing). Thus, the potential economic loss due to lost market share is substantial and underwriters have a strong incentive to use initial returns as a deterrent in order to limit the ability of plaintiffs to bring Section 11 lawsuits. If underwriters can ensure that IPO investors will not participate in a subsequent lawsuit and/or they will not be named, they can limit the damage to their reputation even if one of their IPO firms is sued.
It is important to note that the negative consequences to underwriters documented here may occur even outside the context of the legal system. One criticism of liability theories of underpricing is the fact that lawsuits are infrequent in countries with well-functioning IPO markets, such as Japan, whose offers exhibit both partial adjustment and high initial returns even though their disclosure requirements may be similar to the U.S.(see Kerins et al. (2007) and Kutsuna et al. (2009)).36 Even in the absence of a lawsuit, the consequence for poor disclosure when investors experience major losses could still include loss in underwriter market share and other penalties such as a loss prestige or personal societal status.37
VIII Conclusion
By using word content analysis, we are able to assess the disclosure strategy of IPO firms in response to information learned during bookbuilding. Our findings suggest that prior empirical findings place too much reliance on underpricing as a hedge against litigation risk. We show that disclosure and underpricing act as substitutes in hedging litigation risk and only firms with a high risk of a material omission are likely to use initial returns.
We also document an asymmetric response to information learned during the offering process. IPOs with good information revealed during bookbuilding may have an incentive to withhold information for proprietary reasons and be subject to a material omission. Because proceeds are greater than expected, the firm has pricing flexibility and underpricing is potentially "cheaper" as a hedge against lawsuits. Conversely, there is little benefit to withholding bad information as it has lower proprietary value to rivals and is difficult to conceal for any length of time. Because proceeds are lower than expected, underpricing is "expensive" and these firms are more likely to use disclosure rather than underpricing to hedge litigation risk. We show that these relationships are more pronounced when the firm faces greater ex ante litigation risk.
Consistent with the existing literature, we find an insurance effect in initial returns in which greater underpricing is associated with greater ex ante litigation risk, but our findings differ in two ways. First, we add to the literature by showing that disclosure during bookbuilding has a strong deterrence effect against all lawsuits regardless of the type of plaintiff. Second, we find that initial returns cannot deter lawsuit incidence, but can deter IPO investors from bringing the lawsuit under Section 11. Thus, underpricing is a deterrent against the type of lawsuit that can most damage the underwriter, and not overall lawsuit incidence.
Importantly, we find that underwriters are the primary beneficiary of deterring Section 11 lawsuits because this limits the plaintiff's ability to name the underwriter as a defendant. Our results suggest that underwriters have a strong incentive to underprice the issue aggressively in order to avoid the loss of their reputational capital and to prevent a subsequent decline in market share in the event of a lawsuit.
Overall, our findings suggest that a good portion of the partial adjustment phenomenon can be attributed to the issuer and underwriter's efforts to mitigate exposure to litigation risk. In particular, partial adjustment arises as underwriters require very high levels of underpricing to preserve their reputation capital should issuers decide not to revise their prospectus after learning new information. Because these tradeoffs are based on rational economic incentives inherent to the legal system, our results provide an explanation as to why the partial adjustment phenomenon continues to be robust out of sample.
This Appendix explains how we compute the "document similarity" between two documents ![]() and
and ![]() . We first take the text in each document and construct a numerical vector summarizing the counts of its English Language word roots. This vector has a number of elements equal to the number of word roots, and one element is the number of times the given word root appears in the
document. Word roots are identified by Webster.com, and we use a web crawling algorithm to build a database of the unique word roots that correspond to all English Language words that appear in the universe of all IPO prospectuses. For example, the words display, displayed, and display all have the
same word root "display".38 We exclude common words including articles, conjunctions, personal pronouns, abbreviations, compound words, and any words that
appear fewer than a total of five times in the universe of all words, because they are not informative regarding content. This leaves a vector of 5,803 possible words. We define this vector for the total document as
. We first take the text in each document and construct a numerical vector summarizing the counts of its English Language word roots. This vector has a number of elements equal to the number of word roots, and one element is the number of times the given word root appears in the
document. Word roots are identified by Webster.com, and we use a web crawling algorithm to build a database of the unique word roots that correspond to all English Language words that appear in the universe of all IPO prospectuses. For example, the words display, displayed, and display all have the
same word root "display".38 We exclude common words including articles, conjunctions, personal pronouns, abbreviations, compound words, and any words that
appear fewer than a total of five times in the universe of all words, because they are not informative regarding content. This leaves a vector of 5,803 possible words. We define this vector for the total document as ![]() as the total number of such root words used.
as the total number of such root words used.
To measure the degree of similarity of documents i and j, we simply take the dot product of the two word vectors normalized by their vector lengths. This quantity is the widely used in studies of information processing and is known as the "cosine similarity" method (see Kwon & Lee (2003) for more information), because it measures the angle between two word vectors on a unit sphere. We refer to this quantity as "document similarity".
Because all word vectors
Bibliography
The Journal of Finance 57(3):1421-1442.
The Journal of Finance 52:1259-1294.
Journal of Financial Economics 27(2):447-471.
Journal of Financial Economics 50:151-186.
Journal of Financial Economics 24(2):343-362.
Journal of Financial Intermediation 4(4):328-357.
Journal of Financial and Quantitative Analysis 37:595-616.
The Journal of Finance 53:285-311.
The Journal of Finance 45(4):1045-1067.
Journal of Financial Economics forthcoming.
The Journal of Finance 58(4):1415-43.
Journal of Accounting and Economics 12(1-3):219-243.
Financial Management Spring:64-73.
Journal of Financial Intermediation 7(1):61-90.
Journal of Financial Economics 77:347-373.
Duke University working paper.
Accounting Review 77:595-626.
Journal of Financial Economics 39:487-507.
The Journal of Finance 57:1857-89.
Journal of Accounting Research 32(2):137-164.
Journal of Financial Economics 37:239-257.
Journal of Financial Economics 34:231-250.
Review of Financial Studies 23:2821-2864.
Journal of Accounting and Economics 31:405-440.
Managerial and Decision Economics 16:111-128.
Review of Financial Studies 23(19):3773-3811.
Review of Financial Studies 5:709-42.
NERA Economic Consulting study.
The Journal of Finance 59:2309-2338.
Journal of Financial Economics 34:251-277.
Journal of Financial Economics 85:637-666.
Journal of Accounting Research 47:241-276.
The Journal of Finance 54:505-546.
Information Processing & Management 39:25-44.
University of Michigan Working Paper.
Concordia University working paper.
Journal of Financial Economics 65:167-201.
Journal of Financial and Quantitative Analysis 8:91-103.
Notre Dame University working paper.
The Journal of Finance 66(1):pages TBD.
rfs 15:413-433.
Financial Management 33:5-37.
jae 47:157-159.
The Journal of Finance 57:1171-1200.
Journal of Financial Economics 65:309-335.
Review of Financial Studies 14(2):459-494.
The Journal of Finance 46(3):879-903.
University of Texas working paper.
Rice University working paper.
San Diego State working paper.
The Journal of Finance 57(4):1795-1828.
Journal of Accounting and Economics 47:136-156.
University of Chicago working paper.
Journal of Financial Economics 65:3-29.
Journal of Accounting Research 32:38-61.
Journal of Accounting and Economics 23:249-282.
The Journal of Finance 62:1139-1168.
The Journal of Finance 63:1437-1467.
The Journal of Finance 43(4):789-822.
The Journal of Finance p. forthcoming.
Financial Management pp. 323-355.
| Variable | Mean | Std. Dev. | Minimum | Median | Maximum |
| Panel A: Price Variables Initial Return (IR) | 0.38 | 0.71 | -0.40 | 0.15 | 6.27 |
| Panel A: Price Variables Price Adjustment( |
0.05 | 0.28 | -0.66 | 0.00 | 2.20 |
| Panel A: Price Variables
|
0.12 | 0.22 | 0.00 | 0.00 | 2.20 |
| Panel A: Price Variables
|
-0.07 | 0.12 | 0.00 | 0.00 | -0.66 |
| Panel B: IPO Variables IPO Size at Filing ($M) | 213.6 | 1294 | 3.8 | 64.00 | 46,926 |
| Panel B: IPO Variables Firm Age | 13.74 | 20.37 | 0.00 | 7.00 | 165 |
| Panel B: IPO Variables VC Dummy | 0.50 | 0.50 | 0.00 | 0.00 | 1.00 |
| Panel B: IPO Variables Tech Dummy | 0.46 | 0.50 | 0.00 | 0.00 | 1.00 |
| Panel B: IPO Variables Underwriter Dollar Mkt Share | 0.03 | 0.03 | 0.00 | 0.02 | 0.15 |
| Panel B: IPO Variables Pre-Offer Nasdaq Return | 0.05 | 0.09 | -0.27 | 0.06 | 0.36 |
| Panel B: IPO Variables Risk | 0.08 | 0.03 | 0.01 | 0.08 | 0.25 |
| Panel B: IPO Variables Volatility | -1.68 | 0.42 | -3.45 | -1.65 | -0.15 |
| Panel B: IPO Variables Informative Content | 0.61 | 0.18 | 0.00 | 0.64 | 1.05 |
| Panel B: IPO Variables Standard Content | 0.94 | 0.26 | 0.00 | 1.01 | 1.38 |
| Panel B: IPO Variables Carter/Manaster Rank | 5.24 | 2.54 | 1.00 | 5.00 | 9.00 |
| Panel B: IPO Variables Fraction Secondary Shares | 0.08 | 0.19 | 0.00 | 0.00 | 1.00 |
| Panel C: Prospectus VariablesDocument Root Words ( |
9969 | 3291 | 4338 | 9341 | 35942 |
| Panel C: Prospectus VariablesNumber of Prospectus Filings | 5.05 | 1.58 | 1.00 | 5.00 | 12.00 |
| Panel D: Lawsuit Variables Class Action Lawsuit Dummy | 0.10 | 0.30 | 0.00 | 0.00 | 1.00 |
| Panel D: Lawsuit Variables Section 11 Dummy | 0.05 | 0.21 | 0.00 | 0.00 | 1.00 |
Summary statistics are reported for 1,623 IPOs issued in the US from January 1997 to October 2005 excluding: firms with an issue price less than five dollars, ADRs, financial firms, unit IPOs, dual class IPOs, and REITs. Initial Return is the actual return from the IPO offer price to the first CRSP reported closing price.
| Year of IPO | Number of IPOs Issued | Number of IPOs Sued | Fraction of IPOs Sued | Number of Suits Dismissed | Avg. Settlement All IPOs | Avg. Settlement Sued IPOs | Settlement as % of Proceeds All IPOs | Settlement as % of Proceeds Sued IPOs | Number Days from IPO to Suit |
| 1997 | 315 | 23 | 0.07 | 8 | $2,551,348 | $4,513,923 | 0.05 | 0.09 | 590 |
| 1998 | 217 | 28 | 0.13 | 21 | $12,741,071 | $20,985,294 | 0.23 | 0.38 | 516 |
| 1999 | 401 | 44 | 0.11 | 16 | $6,263,886 | $10,600,423 | 0.07 | 0.12 | 623 |
| 2000 | 297 | 26 | 0.09 | 5 | $5,666,346 | $7,015,476 | 0.05 | 0.06 | 573 |
| 2001 | 62 | 11 | 0.18 | 4 | $6,359,091 | $9,992,857 | 0.04 | 0.07 | 603 |
| 2002 | 58 | 7 | 0.12 | 3 | $1,828,571 | $3,200,000 | 0.02 | 0.04 | 402 |
| 2003 | 46 | 5 | 0.11 | 1 | $3,475,000 | $4,343,750 | 0.07 | 0.08 | 279 |
| 2004 | 132 | 14 | 0.11 | 9 | $1,428,571 | $4,000,000 | 0.04 | 0.11 | 397 |
| 2005 | 95 | 7 | 0.07 | 3 | $3,514,286 | $8,200,000 | 0.02 | 0.06 | 475 |
Summary statistics on lawsuits are reported for 1,623 IPOs issued in the US from January 1997 to October 2005 excluding: firms with an issue price less than five dollars, ADRs, financial firms, unit IPOs, dual class IPOs, and REITs. Data on disclosure-based class action lawsuits for the sample of IPOs, both Section 11 and Section 10b-5, for up to three years after the IPO date are from Stanford Law School's Securities Class Action Clearinghouse.
| Amendmend | Total Number Raw Words | Total Dist from prev | Cumuative Distance | Days Since Last Amendment | Obs |
| Panel A: All IPOs Initial | 34,749 | 0.000 | 0.000 | 0.0 | 1623 |
| Panel A: All IPOs 2 | 36,725 | 0.032 | 0.612 | 45.3 | 1620 |
| Panel A: All IPOs 3 | 37,841 | 0.014 | 0.844 | 24.1 | 1599 |
| Panel A: All IPOs 4 | 38,925 | 0.009 | 0.939 | 18.9 | 1376 |
| Panel A: All IPOs 5 | 40,410 | 0.006 | 0.975 | 14.0 | 984 |
| Panel A: All IPOs 6 | 42,425 | 0.004 | 0.991 | 12.0 | 530 |
| Panel A: All IPOs 7 | 42,578 | 0.004 | 0.997 | 10.7 | 277 |
| Panel A: All IPOs 8 | 43,438 | 0.002 | 0.999 | 7.9 | 123 |
| Panel A: All IPOs 9 | 49,100 | 0.002 | 1.000 | 8.7 | 45 |
| Panel A: All IPOs 10 | 48,415 | 0.001 | 1.000 | 7.3 | 15 |
| Panel A: All IPOs 11 | 47,068 | 0.001 | 1.000 | 11.8 | 4 |
| Panel A: All IPOs 12 | 50,033 | 0.000 | 1.000 | 2.3 | 3 |
| Panel B: Low Revisors Initial | 33,574 | 0.000 | 0.000 | 0.0 | 610 |
| Panel B: Low Revisors 2 | 35,415 | 0.047 | 0.759 | 48.9 | 607 |
| Panel B: Low Revisors 3 | 36,183 | 0.013 | 0.941 | 22.0 | 586 |
| Panel B: Low Revisors 4 | 36,952 | 0.004 | 0.978 | 13.2 | 501 |
| Panel B: Low Revisors 5 | 37,779 | 0.002 | 0.992 | 8.4 | 416 |
| Panel B: Low Revisors 6 | 39,758 | 0.002 | 0.997 | 7.7 | 167 |
| Panel B: Low Revisors 7 | 40,212 | 0.001 | 0.999 | 6.4 | 82 |
| Panel B: Low Revisors 8 | 41,632 | 0.001 | 1.000 | 5.0 | 47 |
| Panel B: Low Revisors 9 | 48,534 | 0.001 | 1.000 | 3.2 | 13 |
| Panel B: Low Revisors 10 | 46,863 | 0.000 | 1.000 | 1.0 | 5 |
| Panel B: Low Revisors 11 | 38,050 | 0.000 | 1.000 | 1.0 | 1 |
| Panel B: Low Revisors 12 | 1.000 | ||||
| Panel C: High Revisors Initial | 35,457 | 0.000 | 0.000 | 0.0 | 1013 |
| Panel C: High Revisors 2 | 37,510 | 0.023 | 0.524 | 43.2 | 1013 |
| Panel C: High Revisors 3 | 38,801 | 0.014 | 0.787 | 25.4 | 1013 |
| Panel C: High Revisors 4 | 40,055 | 0.012 | 0.916 | 22.1 | 875 |
| Panel C: High Revisors 5 | 42,336 | 0.009 | 0.965 | 18.1 | 568 |
| Panel C: High Revisors 6 | 43,652 | 0.005 | 0.987 | 14.0 | 363 |
| Panel C: High Revisors 7 | 43,573 | 0.006 | 0.996 | 12.4 | 195 |
| Panel C: High Revisors 8 | 44,554 | 0.003 | 0.999 | 9.7 | 76 |
| Panel C: High Revisors 9 | 49,330 | 0.003 | 1.000 | 11.0 | 32 |
| Panel C: High Revisors 10 | 49,191 | 0.002 | 1.000 | 10.4 | 10 |
| Panel C: High Revisors 11 | 50,073 | 0.001 | 1.000 | 15.3 | 3 |
| Panel C: High Revisors 12 | 50,033 | 0.000 | 1.000 | 2.3 | 3 |
The table reports the average number of raw words and the severity of revision since the last amendment for each series of prospectus amendments for each IPO. Panel A is based on all IPOs, and Panels B and C based on low and high revision IPOs. To categorize low and high revisors (used to create the subsamples used in Panels B and C, respectively), we first compute the raw Revision Distance for each prospectus amendment as one minus the similarity (based on cosine similarities) between the given prospectus and the preceding one. The normalized revision distance is this distance scaled by the maximum distance among the first two revisions (which is likely regulation-driven). An IPO is a Low Revisor if at least two thirds of its normalized revisions exceed the cross sectional median normalized revision. Otherwise, it is deemed a High Revisor. The total distance from previous is the raw revision distance between the current amendment and the previous filing. We report this as a cumulative fraction in the cumulative distance column. The days since last amendment is the number of days that have elapsed between the previous prospectus and the current amendment. The total number of IPOs for which the given number of prospectuses are filed is reported in the last column. All columns are based on the actual order in which amendments are made.
| Variable | Mean | Std. Dev. | Minimum | Median | Maximum |
|
|
0.12 | 0.22 | 0.00 | 0.00 | 2.20 |
|
|
-0.07 | 0.12 | 0.00 | 0.00 | -0.66 |
| Low Revisor Dummy | 0.38 | 0.48 | 0.00 | 0.00 | 1.00 |
| 0.06 | 0.17 | 0.00 | 0.00 | 2.20 | |
| 0.07 | 0.17 | 0.00 | 0.00 | 2.00 | |
|
|
0.02 | 0.08 | 0.00 | 0.00 | 0.66 |
|
|
0.05 | 0.11 | 0.00 | 0.00 | 0.58 |
Summary statistics are reported for 1,623 IPOs issued in the US from January 1997 to October 2005 excluding: firms with an issue price less than five dollars, ADRs, financial firms, unit IPOs, dual class IPOs, and REITs.
| Variable | Low Revisor | High Revisor | Difference |
| Initial Return | 0.466 | 0.326 | 3.872 |
| 0.086 | 0.028 | 4.033 | |
| 0.148 | 0.105 | 3.810 | |
| abs |
0.062 | 0.078 | -2.520 |
| Class Action Lawsuit Dummy | 0.125 | 0.088 | 2.374 |
| Log IPO Proceeds | 4.277 | 4.339 | -1.060 |
| Sued IPO Similarity | 0.537 | 0.534 | 0.836 |
| UW $ Market Share | 0.028 | 0.030 | -1.669 |
| VC Dummy | 0.482 | 0.504 | -0.877 |
| Technology Dummy | 0.467 | 0.448 | 0.746 |
| Issuer Law Mkt Share | 0.012 | 0.013 | -0.768 |
| Informative Text | 0.619 | 0.598 | 2.390 |
| Standard Text | 0.960 | 0.933 | 2.010 |
| Fraction Secondary Shares | 0.067 | 0.093 | -2.591 |
| Carter/Manaster Rank | 5.246 | 5.239 | 0.054 |
| 30 Day Nasdaq Return | 0.057 | 0.050 | 1.504 |
| Volatility | -1.644 | -1.694 | 2.315 |
| Risk | 0.084 | 0.083 | 0.951 |
| Log Firm Age | 2.102 | 2.179 | -1.547 |
Summary statistics are reported for various subsamples of 1,623 IPOs issued in the US from January 1997 to October 2005 excluding: firms with an issue price less than five dollars, ADRs, financial firms, unit IPOs, dual class IPOs, and REITs. Variable descriptions are summarized in Table I. To identify high and low revisors, we first compute the raw Revision Distance for each prospectus amendment as one minus the similarity (based on cosine similarities) between the given prospectus and the preceding one. The normalized revision distance is this distance scaled by the maximum distance among the first two revisions (which is likely regulation-driven). The Low Revisor Dummy is one for a given IPO if at least two thirds of its normalized revisions exceed the cross sectional median normalized revision. The High Revisor Dummy is (1-Low Revisor Dummy).
| Row | Class Action Lawsuit Dummy | Instrumented Lawsuit Dummy | Low Revisor Dum. x |
High Revisor Dum. x |
Low Revisor Dum. x
|
High Revisor Dum. x
|
Low Revisor Dummy | Inform- ative Content | Stan- dard Content | UW $ Market Share | Log Firm Age | VC- backed Dummy | 30 day Nasdaq Return | Matched Vola- tility | Obs. /RSQ |
| Panel A: All IPOs (1) | 0.062 | 4.855 | -0.053 | 0.186 | 1.261 | -0.170 | 1,623 | ||||||||
| Panel A: All IPOs (1) standard error | (0.97) | (2.39) | (-2.52) | (4.12) | (4.62) | (-2.83) | 0.26 | ||||||||
| Panel A: All IPOs (2) | 1.500 | 4.780 | -0.038 | 0.120 | 1.154 | -0.127 | 1,623 | ||||||||
| Panel A: All IPOs (2) standard error | (3.04) | (2.36) | (-1.71) | (2.93) | (4.49) | (-2.19) | 0.26 | ||||||||
| Panel A: All IPOs (3) | 0.808 | 0.080 | -1.104 | 0.832 | 4.922 | -0.048 | 0.108 | 1.194 | -0.157 | 1,623 | |||||
| Panel A: All IPOs (3) standard error | (1.82) | (3.04) | (-3.05) | (3.58) | (2.40) | (-1.97) | (2.86) | (4.85) | (-2.51) | 0.27 | |||||
| Panel A: All IPOs (4) | 0.274 | 2.118 | 1.481 | -0.169 | -0.340 | -0.068 | -0.555 | 0.443 | 2.537 | -0.027 | 0.069 | -0.114 | -0.059 | 1,623 | |
| Panel A: All IPOs (4) standard error | (0.60) | (20.62) | (12.64) | (-1.25) | (-2.93) | (-2.54) | (-2.09) | (3.06) | (1.72) | (-1.61) | (2.49) | (-0.59) | (-1.44) | 0.51 | |
| Panel B: Non-Tech IPOs (5) | 0.336 | 0.068 | -0.766 | 0.785 | 2.600 | -0.023 | 0.100 | 0.977 | -0.065 | 884 | |||||
| Panel B: Non-Tech IPOs (5) standard error | (0.92) | (2.46) | (-2.53) | (2.66) | (1.98) | (-1.52) | (2.11) | (3.57) | (-1.56) | 0.25 | |||||
| Panel B: Non-Tech IPOs (6) | -0.101 | 2.148 | 1.315 | -0.157 | -0.285 | -0.028 | -0.328 | 0.536 | 0.436 | -0.019 | 0.080 | 0.100 | -0.072 | 884 | |
| Panel B: Non-Tech IPOs (6) standard error | (-0.28) | (12.64) | (5.37) | (-1.06) | (-3.24) | (-1.13) | (-1.47) | (2.37) | (0.63) | (-1.31) | (2.05) | (0.54) | (-1.86) | 0.50 | |
| Panel C: High Ex Ante Litigation Risk IPOs (7) | 0.745 | 0.087 | -1.564 | 1.091 | 5.836 | -0.093 | 0.105 | 1.616 | -0.254 | 814 | |||||
| Panel C: High Ex Ante Litigation Risk IPOs (7) standard error | (1.22) | (1.63) | (-2.38) | (2.32) | (3.10) | (-3.64) | (2.13) | (4.26) | (-1.99) | 0.33 | |||||
| Panel C: High Ex Ante Litigation Risk IPOs (8) | 0.647 | 1.943 | 1.399 | -0.284 | -0.230 | -0.087 | -1.138 | 0.411 | 3.323 | -0.046 | 0.034 | -0.064 | -0.101 | 814 | |
| Panel C: High Ex Ante Litigation Risk IPOs (8) standard error | (1.21) | (15.50) | (12.98) | (-1.30) | (-1.69) | (-2.70) | (-2.01) | (1.07) | (2.36) | (-2.80) | (0.84) | (-0.25) | (-1.03) | 0.58 | |
| Panel C: High Ex Ante Litigation Risk IPOs (9) | -0.456 | 0.103 | -1.432 | 0.817 | 5.593 | -0.057 | 0.160 | 1.163 | -0.127 | 341 | |||||
| Panel C: High Ex Ante Litigation Risk IPOs (9) standard error | (-0.63) | (1.75) | (-1.38) | (1.20) | (1.83) | (-1.69) | (1.94) | (2.52) | (-1.63) | 0.35 | |||||
| Panel C: High Ex Ante Litigation Risk IPOs (10) | -1.161 | 2.451 | 1.230 | -0.374 | -0.196 | -0.008 | -1.073 | 0.623 | 2.205 | -0.047 | 0.103 | -0.058 | -0.188 | 341 | |
| Panel C: High Ex Ante Litigation Risk IPOs (10) standard error | (-1.29) | (10.64) | (4.16) | (-1.09) | (-0.76) | (-0.22) | (-1.41) | (1.17) | (1.76) | (-1.93) | (1.56) | (-0.26) | (-2.36) | 0.65 |
OLS regressions with Fama-French 48 industry and yearly fixed effects are presented for 1,623 IPOs issued in the US from January 1997 to October 2005 excluding: firms with an issue price less than five dollars, ADRs, financial firms, unit IPOs, dual class IPOs, and REITs. The dependent variable is the Initial Return. Panel A reports results for all firms, and Panel B for non-technology firms. Panel C restricts the sample to firms that are in non-technology industries that also experience upward price revisions. Panel D further restricts the sample in Panel C to those firms with high ex-ante litigation risk, i.e., those with above median Sued IPO Similarity. The independent variables include the price adjustment variables based on
| Variable | Initial Return | Residual Initial Return | Number of Obs | Initial Return | Residual Initial Return | Number of Obs | ||
| Panel A: All IPOs with
|
0.083 | 0.336 | -0.289 | 110 | 0.070 | 0.287 | -0.225 | 153 |
| Panel A: All IPOs with
|
0.216 | 0.641 | -0.055 | 111 | 0.170 | 0.546 | -0.062 | 165 |
| Panel A: All IPOs with
|
0.521 | 1.391 | 0.462 | 110 | 0.445 | 0.942 | 0.208 | 153 |
| Panel B: Non-Tech IPOs with
|
0.067 | 0.229 | -0.151 | 44 | 0.056 | 0.141 | -0.195 | 74 |
| Panel B: Non-Tech IPOs with
|
0.136 | 0.357 | -0.076 | 56 | 0.125 | 0.369 | -0.028 | 87 |
| Panel B: Non-Tech IPOs with
|
0.359 | 1.035 | 0.406 | 49 | 0.302 | 0.586 | 0.098 | 80 |
| Panel C: High Ex Ante Litigation Risk IPOs with
|
0.103 | 0.401 | -0.384 | 52 | 0.081 | 0.463 | -0.112 | 75 |
| Panel C: High Ex Ante Litigation Risk IPOs with
|
0.259 | 0.784 | 0.022 | 63 | 0.189 | 0.574 | -0.098 | 83 |
| Panel C: High Ex Ante Litigation Risk IPOs with
|
0.619 | 1.574 | 0.485 | 55 | 0.450 | 0.860 | 0.111 | 76 |
| Panel D: Non-Tech High Ex Ante Litigation Risk IPOs with
|
0.074 | 0.162 | -0.278 | 15 | 0.060 | 0.158 | -0.082 | 29 |
| Panel D: Non-Tech High Ex Ante Litigation Risk IPOs with
|
0.152 | 0.464 | 0.018 | 23 | 0.137 | 0.343 | -0.105 | 32 |
| Panel D: Non-Tech High Ex Ante Litigation Risk IPOs with
|
0.376 | 1.134 | 0.487 | 21 | 0.286 | 0.460 | -0.024 | 30 |
Summary statistics are reported for various subsamples of 1,623 IPOs issued in the US from January 1997 to October 2005 excluding: firms with an issue price less than five dollars, ADRs, financial firms, unit IPOs, dual class IPOs, and REITs. Panel A reports results for all
| Row | Initial Return | Instru. mented Initial Return | Low Revisor Dum. x |
High Revisor Dum. x |
Low Revisor Dum. x
|
High Revisor Dum. x
|
Low Revisor Dummy | Sued IPO Simil- arity | Inform- ative Content | Stan- dard Content | Log Issue Size | VC- backed Dummy | Obs / Pseudo |
| Panel A: All IPOs (1) | 0.138 | 5.400 | 1.917 | -1.219 | 0.129 | 0.487 | 1,623 | ||||||
| Panel A: All IPOs (1) standard error | (1.18) | (2.95) | (1.11) | (-0.56) | (1.24) | (1.91) | 0.12 | ||||||
| Panel A: All IPOs (2) | 1.411 | 5.444 | 3.367 | -2.188 | 0.160 | 0.309 | 1,623 | ||||||
| Panel A: All IPOs (2) standard error | (1.63) | (3.07) | (1.65) | (-0.99) | (1.43) | (1.17) | 0.12 | ||||||
| Panel A: All IPOs (3) | 0.409 | 5.375 | 1.753 | -1.007 | 0.131 | 0.543 | 1,623 | ||||||
| Panel A: All IPOs (3) standard error | (2.05) | (3.00) | (1.07) | (-0.47) | (1.30) | (2.22) | 0.12 | ||||||
| Panel A: All IPOs (4) | 0.856 | 0.192 | -1.507 | -1.412 | 0.260 | 5.450 | 2.061 | -1.211 | 0.146 | 0.505 | 1,623 | ||
| Panel A: All IPOs (4) standard error | (2.90) | (0.35) | (-0.90) | (-1.08) | (1.01) | (2.90) | (1.18) | (-0.57) | (1.35) | (1.99) | 0.13 | ||
| Panel B: Non-tech IPOs (5) | 0.341 | 5.651 | 2.742 | -1.610 | 0.262 | 0.546 | 884 | ||||||
| Panel B: Non-tech IPOs (5) standard error | (1.15) | (2.82) | (1.09) | (-0.91) | (1.46) | (1.25) | 0.18 | ||||||
| Panel B: Non-tech IPOs (6) | 1.908 | -0.348 | -0.276 | -2.021 | -0.010 | 5.580 | 2.994 | -1.659 | 0.324 | 0.506 | 884 | ||
| Panel B: Non-tech IPOs (6) standard error | (4.29) | (-0.29) | (-0.13) | (-1.06) | (-0.03) | (2.71) | (1.15) | (-0.95) | (1.85) | (1.10) | 0.20 | ||
| Panel C: High Ex Ante Litigation Risk IPOs (7) | 0.528 | 4.487 | 1.513 | -0.193 | 0.100 | 0.265 | 814 | ||||||
| Panel C: High Ex Ante Litigation Risk IPOs (7) standard error | (2.21) | (1.05) | (0.76) | (-0.05) | (0.56) | (0.91) | 0.15 | ||||||
| Panel C: High Ex Ante Litigation Risk IPOs (8) | 0.707 | -0.024 | -0.262 | -1.434 | 0.280 | 4.821 | 1.713 | -0.458 | 0.103 | 0.211 | 814 | ||
| Panel C: High Ex Ante Litigation Risk IPOs (8) standard error | (2.40) | (-0.04) | (-0.13) | (-0.85) | (0.82) | (1.12) | (0.83) | (-0.13) | (0.56) | (0.72) | 0.16 | ||
| Panel D: Non-Tech High Ex Ante Litigation Risk IPOs (9) | 0.879 | -2.923 | 3.911 | 0.120 | 0.037 | 0.118 | 341 | ||||||
| Panel D: Non-Tech High Ex Ante Litigation Risk IPOs (9) standard error | (1.62) | (-0.29) | (0.59) | (0.03) | (0.07) | (0.15) | 0.34 | ||||||
| Panel D: Non-Tech High Ex Ante Litigation Risk IPOs (10) | 1.803 | -5.379 | 5.302 | -3.433 | -0.183 | 0.775 | 5.398 | -0.487 | 0.243 | 0.248 | 341 | ||
| Panel D: Non-Tech High Ex Ante Litigation Risk IPOs (10) standard error | (2.87) | (-1.03) | (1.32) | (-1.13) | (-0.26) | (0.08) | (0.77) | (-0.10) | (0.46) | (0.29) | 0.37 |
Logit regressions with industry and yearly fixed effects are presented for 1,623 IPOs issued in the US from January 1997 to October 2005 excluding: firms with an issue price less than five dollars, ADRs, financial firms, unit IPOs, dual class IPOs, and REITs. The dependent variable is a dummy variable equal to one if the IPO firm was sued in a class action lawsuit. Panel A includes all IPOs and Panel B includes only non-tech IPOs. Panels C and D respectively restrict the samples in Panels A and B to IPOs with high ex-ante litigation risk, as measured by the median ex-ante Sued IPO Similarity. The independent variables include the Initial Return, the instrumented initial return, and the underwriter's upward price adjustment (
| Row | Initial Return | Instru. mented Initial Return | Log Days to Lawsuit | Log Post- Issue Return | Low Revisor Dummy | UW $ Market Share | Log Issue Size | Log Firm Age | % Sec- ondary Shares | Time + Industry Fixed Effects | Obs / Pseudo |
| Panel A: All IPOs (1) | -2.581 | -3.286 | -0.960 | 0.461 | 6.946 | 0.908 | 0.955 | 1.637 | Yes | 165 | |
| Panel A: All IPOs (1) standard error | (-3.72) | (-3.36) | (-1.38) | (0.54) | (0.34) | (1.95) | (2.20) | (0.61) | 0.79 | ||
| Panel A: All IPOs (2) | -3.242 | -2.367 | -0.664 | -0.068 | 5.149 | 0.860 | 0.652 | 1.564 | Yes | 165 | |
| Panel A: All IPOs (2) standard error | (-1.88) | (-3.97) | (-1.67) | (-0.09) | (0.26) | (1.99) | (1.79) | (0.54) | 0.73 | ||
| Panel A: All IPOs (3) | -2.370 | -2.987 | -0.881 | -0.129 | 21.507 | 0.289 | 0.552 | 2.369 | No | 165 | |
| Panel A: All IPOs (3) standard error | (-5.61) | (-4.38) | (-2.83) | (-0.25) | (1.78) | (0.90) | (1.30) | (1.81) | 0.68 | ||
| Panel A: All IPOs (4) | -2.716 | -2.231 | -0.706 | -0.281 | 22.061 | 0.276 | 0.350 | 1.870 | No | 165 | |
| Panel A: All IPOs (4) standard error | (-3.31) | (-4.24) | (-3.48) | (-0.63) | (1.93) | (1.07) | (0.86) | (1.59) | 0.58 | ||
| Panel B: All IPOs with
|
-5.706 | -5.889 | -3.514 | -0.106 | 51.184 | 0.708 | 2.102 | 5.509 | No | 100 | |
| Panel B: All IPOs with
|
(-3.12) | (-3.69) | (-2.55) | (-0.10) | (1.40) | (0.83) | (2.74) | (2.30) | 0.87 | ||
| Panel B: All IPOs with
|
-5.974 | -3.122 | -1.743 | -0.580 | 38.903 | 0.462 | 0.934 | 4.786 | No | 100 | |
| Panel B: All IPOs with
|
(-7.41) | (-4.52) | (-6.52) | (-0.81) | (2.47) | (0.94) | (1.42) | (2.16) | 0.75 | ||
| Panel C: High Ex Ante Litigation Risk IPOs (7) | -2.632 | -2.792 | -0.723 | 0.072 | 2.569 | 0.375 | 1.094 | 1.685 | No | 99 | |
| Panel C: High Ex Ante Litigation Risk IPOs (7) standard error | (-3.36) | (-2.44) | (-1.79) | (0.13) | (0.19) | (0.89) | (1.54) | (0.78) | 0.67 | ||
| Panel C: High Ex Ante Litigation Risk IPOs (8) | -3.242 | -1.892 | -0.675 | -0.115 | 10.549 | 0.228 | 0.670 | 1.036 | No | 99 | |
| Panel C: High Ex Ante Litigation Risk IPOs (8) standard error | (-2.61) | (-2.86) | (-2.13) | (-0.25) | (0.66) | (0.65) | (1.14) | (0.53) | 0.56 | ||
| Panel D: Non-tech IPOs (9) | -2.938 | -3.299 | -1.520 | 0.146 | 66.365 | -0.415 | 0.115 | 2.431 | No | 77 | |
| Panel D: Non-tech IPOs (9) standard error | (-3.38) | (-2.72) | (-2.64) | (0.23) | (2.44) | (-0.93) | (0.27) | (1.43) | 0.71 | ||
| Panel D: Non-tech IPOs (10) | -3.997 | -2.002 | -1.383 | -0.542 | 51.225 | -0.134 | -0.169 | 2.158 | No | 77 | |
| Panel D: Non-tech IPOs (10) standard error | (-1.61) | (-2.86) | (-2.94) | (-0.70) | (2.59) | (-0.34) | (-0.36) | (1.40) | 0.60 |
Logit regressions are presented for 165 IPOs that were issued in January 1997 to October 2005 and subsequently sued in class action lawsuits in the three years after issuance. The dependent variable is a dummy variable equal to one if the lawsuit is a Section 11 lawsuit and zero otherwise. Results are also robust if we replace the logit model with a linear probability model. Panel A includes all IPOs and Panel B includes only IPOs with high ex-ante litigation risk. The independent variables include the Initial Return, and the instrumented initial return. We consider both raw initial returns and instrumented initial returns from a two stage regression model as in Lowry and Shu (2002). Our instrumental variable is the 30 Day Nasdaq Return (the NASDAQ return for the 30 trading days preceding the offer date). We also include controls for the stock return realized from the closing price on the first day of trading to the date the lawsuit is announced (Post-Issue Return), as well as a control for the number of days from issuance until the lawsuit is announced (Days to Lawsuit). To categorize firms by revision intensity, we first compute Revision Distance as one minus the similarity for each prospectus amendment in the time series of amendments for each IPO. The normalized revision distance is this raw distance scaled by the maximum raw distance among the first two revisions (which is likely regulation-driven). The High Revisor Dummy is one for a given IPO if more than one third of its normalized revisions exceed the cross sectional median normalized revision in revision intensity. We also consider cross terms of this variable with the price adjustment variables
| Row | Lawsuit Sample | Past Three-Year Class Action Lawsuits | Lagged Market Share | Twice Lagged Market Share | Thrice Lagged Market Share | Obs | |
| (1) | All Lawsuits | -0.454 | -42.812 | 3.219 | 36.453 | 0.203 | 643 |
| (1) standard error | (-1.31) | (-4.99) | (0.35) | (3.82) | |||
| (2) | Non-Tech Lawsuits | -0.793 | -42.814 | 3.542 | 36.837 | 0.209 | 643 |
| (2) standard error | (-1.78) | (-5.02) | (0.40) | (3.95) | |||
| (3) | Section 11 Lawsuits | -0.998 | -43.376 | 4.766 | 39.096 | 0.211 | 643 |
| (3) standard error | (-2.10) | (-5.16) | (0.53) | (3.96) | |||
| (4) | Non-Section 11 Lawsuits | -0.123 | -43.015 | 0.834 | 32.881 | 0.198 | 643 |
| (4) standard error | (-0.31) | (-4.96) | (0.09) | (3.61) | |||
| (5) | UW-Named Lawsuits | -1.330 | -44.030 | 5.860 | 39.610 | 0.217 | 643 |
| (5) standard error | (-2.87) | (-5.29) | (0.65) | (4.26) | |||
| (6) | UW-Not-Named Lawsuits | 0.007 | -43.163 | 0.493 | 31.930 | 0.198 | 643 |
| (6) standard error | (0.02) | (-4.97) | (0.06) | (3.31) |
Logistic (for dummy variables) or OLS (for change in market share) regressions with yearly fixed effects for 643 changes in underwriter market share observations from January 1997 to October 2005 excluding: firms with an issue price less than five dollars, ADRs, financial firms, unit IPOs, dual class IPOs, and REITs. All standard errors are adjusted for clustering within year and by underwriter. The dependent variable is noted in the first column. The Change in Underwriter Dollar Market Share is the change in proceeds weighted market share from year