
The Correlation between Money and Output in the United Kingdom: Resolution of a Puzzle
Keywords: Money/output correlation, monetary aggregates, U.K. interwar depression
Abstract:
Friedman and Schwartz (1982) and Goodhart (1982) report a zero correlation between money growth and output growth in U.K. historical data. This finding is puzzling, as there is wide agreement that changes in monetary policy are frequently nonneutral in the short run and that the U.K. experience, in particular, is replete with instances of real effects of monetary policy actions. This paper proposes a resolution to the puzzle. An analysis conducted on subperiods shows that a positive money growth/output growth correlation is indeed recoverable from U.K. historical data. Strike activity in the 1970s and shifts in the terms of trade during the interwar period are the two factors primarily responsible for obscuring the positive correlation between money and output in the United Kingdom.
JEL Classification: E51; E52; E58
1 Introduction
Bernanke (1986, p. 49) observed, "it should be unnecessary to motivate a study of the statistical correlation between the money stock and national income. At least since the work of Friedman and Schwartz (1963a), this stylized fact has been considered among the most important in macroeconomics; at times, its explication has nearly defined the field." The prominent place given in economic research to the correlation of money and income-where the latter refers to aggregate real national income or output-was also recognized by King (1990, p. 1), who noted that "since the work of Friedman and Schwartz (1963a, 1963b), most economists view cyclical variations in money as positively associated with cyclical variations in real activity." It is significant that the 1986 Bernanke paper helped launch the structural vector autoregression (SVAR) literature, while the 1990 King paper was a pioneering contribution to sticky-price, dynamic stochastic general equilibrium (DSGE) modeling. Study of the money/output correlation thus not only dominated and defined macroeconomics in the 1960s and 1970s; it also was a driving force behind what have become the standard approaches to structural modeling and empirical analysis in modern monetary economics.
In view of the central role that the money/output correlation has played in shaping both the research agenda and views about monetary policy, it is especially surprising that the authors most associated with this regularity-Friedman and Schwartz-reported that such a correlation was not a feature of data for the United Kingdom. Specifically, Friedman and Schwartz (1982, p. 400) reported a correlation between U.K. monetary growth and U.K. output growth of "essentially zero" for the period from 1873 to 1975-giving the correlation as 0.027 once wars were excluded (1982, p. 183). Admittedly, this correlation was computed using "phase-average" data-i.e., money growth and output growth series for which each recession or expansion period constituted a single observation. The possibility was therefore left open that the zero money/output correlation resulted from the use of low-frequency data, and that a significant positive correlation would manifest itself if Friedman and Schwartz's basic annual data were considered. This was indeed Friedman's interpretation when, in 1980, he previewed the Friedman-Schwartz results.1 But this interpretation proved untenable. Goodhart (1982, p. 1547) considered Friedman and Schwartz's annual series for the United Kingdom, and apparently found no correlation between money growth and output growth, leading him to state that his "results...largely support F-S' [Friedman and Schwartz's] findings, notably that the rate of growth of real output in the U.K. appeared to exhibit an overall stability largely unaffected by changes in monetary conditions."2
A positive money/output correlation is usually viewed as a by-product of the short-run nonneutrality of monetary policy.3 A zero correlation might then be taken as consistent with the position that monetary policy does not have real effects.4 A "neutral money" interpretation of the zero correlation is reinforced by Friedman and Schwartz's (1982, pp. 168, 172, 399) finding that money growth and inflation in the United Kingdom are closely related for the period that they study (as are money growth and nominal income growth). On this evidence, U.K. economic behavior would seem to be consistent with a simple flexible-price monetary model, in which monetary policy determines the rate of inflation with no interim effect on real variables. But the apparent implication that monetary policy is neutral for output in the U.K. business cycle is contrary to intuition, as Laidler (1982, 1989) forcefully argues. It flies in the face of a number of celebrated historical cases in which monetary policy is believed to have been a powerful influence on the U.K. business cycle. Most prominent of these is the interwar period, which a large number of observers have cited as an instance of prolonged economic weakness for which contractionary policies of the U.K. monetary authorities were largely to blame (see, for example, Keynes, 1930; Howson, 1975; Dimsdale, 1981; Goodhart, 1982, p. 1548 and 1999, p. 49; and Bernanke and James, 1991). The finding of a zero correlation between money growth and output growth in the United Kingdom therefore represents a puzzle.
This paper resolves the puzzle. It is shown here that a money growth/output growth correlation is recoverable from U.K. historical data for the period studied by Friedman and Schwartz (1982) as well as for the period beyond the one they considered.
No single reason lies behind Friedman and Schwartz's (and Goodhart's) failure to uncover this correlation. Rather, there are particular influential factors for each of the subperiods into which Friedman and Schwartz broke up their sample: pre-World War I, interwar, and (pre-1976) postwar. For the pre-World War I period, a higher correlation between money growth and real output growth emerges once one uses output data that are considered better-quality than those used by Friedman and Schwartz (1982). For the interwar period, a factor cited by Laidler (1982, 1989) appears to be relevant: sizable shifts in the U.K. terms of trade prevented large increases in the nominal money stock from exerting expansionary effects on output. Once these shifts in the terms of trade are taken into account, an important relationship between monetary factors and real activity is reaffirmed. For the postwar period, money/output correlations are affected by the U.K. coal-mining strike of 1974 and by policymakers' reaction to the accompanying industrial turmoil. These distortions not only affected real activity for 1974; they also had an adverse impact on Friedman and Schwartz's attempts to adjust U.K. output and price data for the effects of the price controls that were in force in the United Kingdom during the 1970s. The results in this paper show that a money growth/output growth correlation emerges in the postwar period once the distortions arising from the 1974 events are recognized.
An additional contribution of the present paper is to contribute evidence that refutes real business cycle (RBC) interpretations of the interwar period (1919-1938) in the United Kingdom. The interwar period superficially seems, as noted above, to feature a close relationship between money and other nominal variables but little relation between money and real variables. Little wonder, then, that the RBC literature has had a field day studying these years. Most notably, an important study by Cole and Ohanian (2002) argues that the United Kingdom's interwar output depression cannot be understood by reference to the behavior of the nominal money stock, and that it should instead be viewed as the result of shocks to aggregate supply. The present paper, in contrast, brings out the connections between nominal and real variables that can be gleaned from a closer study of the annual data. It therefore helps to affirm the importance of monetary policy for real behavior over the U.K. interwar period. The interpretation offered here does not deny the primacy of real factors for the longer-run determination of output behavior, but it does put monetary policy at center stage in determining the response of aggregate real activity to real shocks at the business cycle frequency.
This paper proceeds as follows. Section 2 discusses existing findings and interpretations of the money/output correlation (or lack thereof) in the United Kingdom. Section 3 analyzes the U.K. data via a systematic examination of subperiods, and it reaffirms the existence of a money/output correlation. Section 4 concludes.
2 Background to the zero-correlation finding
This section details the "zero money/output correlation" finding of Friedman and Schwartz (1982) for the United Kingdom, before turning to some issues that arise in interpreting this finding and reconciling it with U.K. monetary developments.
2.1 Previous findings and interpretations
Friedman and Schwartz (1982) consider data on money, nominal income, output, prices and interest rates for the United States and the United Kingdom for a period spanning from 1873 to 1975. For both countries, they find a close relationship between money growth and nominal income growth and, consistent with this, a tight relationship between money growth per unit of output and inflation. Their findings on the money growth/output growth relationship, however, differ by country. For the United States, Friedman and Schwartz (1982, p. 399) report a significant positive correlation between money growth and output growth for the whole period and for a variety of subperiods-for example, 0.64 for the full sample and 0.79 if wartime episodes are excluded. For the United Kingdom, on the other hand, Friedman and Schwartz (1982) report that the full-sample correlation between nominal money growth and real output growth is negative and insignificant, at about -0.25, and is 0.03 for periods excluding wars.5 For subperiods, Friedman and Schwartz (1982, p. 399) similarly find evidence against a significant positive correlation-for the postwar period (defined as 1951-1975), for example, they report a money growth/output growth correlation of -0.41. These correlations, as well as exercises with some of their estimated equations, led Friedman and Schwartz to conclude that "for the United Kingdom we have not been able to isolate even transitory effects on output" (1982, p. 627).6
As noted in the introduction, Friedman and Schwartz cast their data in a form ("phase averages") that meant that each observation corresponded to the average value associated with a particular business cycle contraction or expansion. This choice meant that judgments about the United Kingdom's business cycle chronology entered the construction of their data. There are some awkward classifications underlying Friedman and Schwartz's cycle chronology; for example, although they treat some postwar episodes of positive but weak economic growth as "contractions," they classify 1920-1921-during which U.K. nominal income rose but real income collapsed-as an "expansion."7 These classification issues would never have arisen had Friedman and Schwartz simply used the annual data as their units of observation. Alongside these specific problems of application, many other caveats and reservations concerning the use of phase-averaging are expressed in Bernanke and Powell (1986, pp. 601-602), Campos, Ericsson, and Hendry (1990), Goodhart (1982, pp. 1541-1542), Hendry and Ericsson (1991a), and Stock (1987). In light of these considerations, the rest of this paper concentrates on annual data.
The important point, for present purposes, is that returning to annual data does not in itself overturn the Friedman-Schwartz finding of a zero money/output correlation for the United Kingdom. This was established by Goodhart (1982), as noted above. In addition, for 1951-1975 (Friedman and Schwartz's postwar sample), Backus and Kehoe (1992, p. 881) find a correlation of money growth and output growth of only 0.14, using Friedman and Schwartz's U.K. money data and a then-recent vintage of U.K. real GDP data.8 Figure 1, which displays a scatter plot of the growth rates of Friedman and Schwartz's annual real income data and money series also shows the lack of correlation, when the 1872-1975 period is viewed as a whole.9 The correlation between the two series plotted in Figure 1 is -0.073. The two points on the upper left of the scatter-which correspond to the observations for 1919 and 1920, years in which severe output declines accompanied rapid money growth- stand out. But the near-zero correlation is not due to the presence of these years in the sample; excluding these two data points, the correlation is 0.059. From these and the aforementioned findings in the literature, it is clear that a roughly zero money growth/output growth correlation is a property present in the U.K. annual data; zero-correlation results are not merely an artifact of Friedman and Schwartz's averaging of their data.
Figure 1. Scatter diagram of money growth and real output growth, United Kingdom, 1872-1975, using Friedman and Schwartz's (1982) data
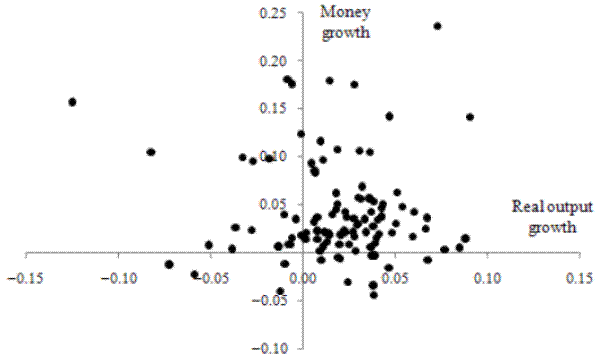 Figure 1 Data
A positive correlation is something that one might expect to emerge if monetary policy is nonneutral in the short run.10 A denial of the nonneutrality of money would seem to be in stark contrast to narrative accounts and much received wisdom concerning episodes in the U.K. historical record. Laidler (1989, p. 108) points, in particular, to the role played by monetary policy in promoting the "Heath-Barber boom" of 1972-1973 (near the end of Friedman and Schwartz's sample) and the Thatcher disinflationary recession of the early 1980s (beyond their sample).
One of the most frequently cited examples of the real effects of monetary policy, moreover, is that of the United Kingdom in the 1920s. Keynes' (1930) classic account emphasized the role of deflationary U.K. monetary policy (dictated by exchange rate goals) in producing depressed economic conditions during the 1920s. This interpretation has become the standard one: Huffman and Lothian (1984, p. 477) judge that Keynes' diagnosis of the 1920s was "essentially correct"; Rose (1983, p. 8) refers to monetary policy in 1920 as "severely deflationary"; Johnson (1975) states that the 1920s U.K. saw "a restrictive monetary policy...which necessitated mass unemployment"; and Friedman (1970, 1975) specifically cited the United Kingdom's return to the Gold Standard as the source of the depressed U.K. economic conditions in the 1920s. Indeed, in U.K. public discourse, appeals to the evidence of the 1920s formed part of the earliest stirrings of the postwar revival of attention to the role of monetary policy in aggregate demand management.11
Yet Friedman and Schwartz (1982, p. 399) find that for the interwar period the money growth/output growth correlation is perversely signed, taking the value of -0.32. What is more, they find a fairly tight money growth/nominal income growth relation for this period, with a correlation of 0.80. This apparent separation of the behavior of real and nominal variables seems to fit flexible-price accounts of business cycle fluctuations.12 It is therefore not surprising that the U.K. interwar period has been seized upon by the real business cycle literature. In particular, Cole and Ohanian (2002) use Friedman and Schwartz's own annual data, and they proceed to spell out an account of the U.K. interwar depression in which monetary policy has no role in the determination of output.
It is incumbent upon believers in (temporary) effects of monetary policy on output to account for this finding, and that is an aim of the present paper. As a preliminary step, it is worth considering the reconciliation suggested by Laidler (1982). The resolution that Laidler offered focuses on terms-of-trade movements. He postulated that the tendency for money growth and output growth to be positively associated is obscured by the impact of world price level shocks or sterling devaluations. Such events, Laidler suggests, produce a surge in the U.K. price level without a commensurate movement in money.13 With nominal income constrained by the lack of monetary accommodation of the price-level increase, the higher price level is accompanied by a fall in output.14
The specific examples that Laidler cites as likely to generate the zero correlation are "episodes like 1925, 1931, 1949, and 1967" (Laidler, 1982, p. 300). None of these specific examples, however, seems likely to resolve the zero-correlation puzzle. The 1925 episode in Laidler's list corresponds to the United Kingdom's resumption of the Gold Standard at the traditional dollar/sterling exchange rate. The Laidler explanation requires that prices and output move in different directions in the wake of the specified episodes (see, in particular, Laidler, 1982, p. 300). But U.K. prices and output actually fell together in 1926, in the aftermath of the 1925 resumption. Friedman and Schwartz's tables of U.K. annual data for 1926 imply inflation of minus 1.6 percent in 1926 (compared with a 0.7 percent rise in prices in 1925) alongside output growth of minus 3.9 percent (compared with 6.7 percent growth in 1925).15
Laidler's reference to 1931, 1949, and 1967 is due to these being years of sterling devaluations. For his account of the source of the zero correlation to work, the aftermath of devaluations should witness a substantially higher rate of aggregate price level increase accompanied by a decline or slower rate of growth of output. This combination of outcomes was not observed in any of the three devaluation episodes. In the wake of the 1931 departure from gold, the U.K. price level exhibited slightly greater deflation in 1932 than in 1931; the fillip to the price level that is part of Laidler's story therefore was not observed. Furthermore, U.K. output growth turned positive in 1932 after being negative in 1931. The 1949 devaluation was associated with flat behavior of U.K. aggregate price indices, including the retail price index; the rapid rise in the import price component was largely offset by declines in other components (see Allsopp, Kara, and Nelson, 2006). Moreover, as noted above, Friedman and Schwartz's finding of a zero postwar correlation uses a definition of "postwar" that omits pre-1951 data,16 thereby excluding much of the immediate aftermath of the 1949 devaluation. The 1967 devaluation was followed by faster inflation in 1968 (albeit at a rate well below those observed in the 1970s). But U.K. output growth stepped up in 1968, so again the conditions for the validity of the Laidler story are not met.17
It will be shown below that a positive postwar correlation between money growth and output growth can be established once allowance is made for events that obscure the correlation. These events are primarily labor disputes, rather than terms-of-trade shifts. For the interwar period, however, it will be shown that Laidler's emphasis on terms-of-trade movements has validity. Laidler's conjecture about the importance of the 1925 and 1931 episodes in lowering the money/output correlation is not borne out. But his point that terms-of-trade movements have a distorting effect on the money/output correlation will be shown to be important for studying the early 1920s. In particular, there is merit in Laidler's appeal to terms-of-trade movements that are not accommodated by monetary policy-and hence are not followed by a sustained movement in inflation-yet are associated with a one-time increase in prices and an accompanying decline in output. Before considering specific episodes and samples, however, let us consider arguments that, even if one does not believe in price flexibility, a zero money/output correlation might not be a puzzle at all.
2.2 Should a zero money/output correlation be surprising?
The concern of this paper with the money/output correlation arises from the presumption that such a correlation should be present if monetary policy is nonneutral in the short run. Some authors have argued, however, that even if monetary policy has short-run effects on output, one should not expect a correlation between money and output to emerge in the data. A variety of arguments have been put forward in the literature to reach this position. Each of the main arguments is considered in the remainder of this section. It will be concluded that none of them applies to the United Kingdom for the period considered in this paper.
2.2.1 Money demand instability and the money/output correlation
The first argument is the familiar one that financial innovation and the associated money demand instability may distort monetary aggregates, in such a way that they fail to convey the stance of monetary policy accurately. Consequently, a money growth/output growth correlation might not be an
automatic by-product of the short-run nonneutrality of monetary policy. There are several reasons for rejecting this argument. The first is that a money growth/output growth correlation does not require money demand stability. It is clear that money demand stability is not a sufficient condition
for a positive money/output correlation: the most obvious demonstration of this comes from a flexible price model, in which nominal and real money typically do not move together even in the short run, and a correlation of real output with real money does not translate into a nominal money/real
output correlation. But examples also abound in the sticky-price case. Consider a stable, static money demand function with unit income elasticity and the price level predetermined. Then the ratio of real money balances to real income is a stable function of opportunity cost variables: ![]() /
/![]() =
= ![]() f(
f(![]() ) where f(
) where f(![]() ) is a stochastic (but constant-parameter) function and
) is a stochastic (but constant-parameter) function and ![]() is a vector. Even with the nominal price level predetermined, the most that can be said is that nominal money and real income have a close short-run relation conditional on the opportunity cost variables; there is no implication that nominal money and real income (or their rates of change) enjoy a positive correlation with one another.Perhaps less obvious is that money demand instability does not imply the absence of a money/output
correlation. A period of money demand instability may be associated with an increase in the residual variance of estimated money demand regressions. But it is possible for correlations between variables included in a regression equation to rise at the same time that the residual variance of the
equation increases. The 1970s, for example, witnessed an increase in the variability of many macroeconomic variables in the United Kingdom and other countries, and it is possible that, in studies pertaining to these countries, adding the 1970s observations to sample periods produces increases in
simple and multiple correlations (and so increases in explained variation) as well as in residual variation.18 Money demand instability therefore need not
eliminate, or even reduce, money/output correlations.
is a vector. Even with the nominal price level predetermined, the most that can be said is that nominal money and real income have a close short-run relation conditional on the opportunity cost variables; there is no implication that nominal money and real income (or their rates of change) enjoy a positive correlation with one another.Perhaps less obvious is that money demand instability does not imply the absence of a money/output
correlation. A period of money demand instability may be associated with an increase in the residual variance of estimated money demand regressions. But it is possible for correlations between variables included in a regression equation to rise at the same time that the residual variance of the
equation increases. The 1970s, for example, witnessed an increase in the variability of many macroeconomic variables in the United Kingdom and other countries, and it is possible that, in studies pertaining to these countries, adding the 1970s observations to sample periods produces increases in
simple and multiple correlations (and so increases in explained variation) as well as in residual variation.18 Money demand instability therefore need not
eliminate, or even reduce, money/output correlations.
This is not to deny that financial changes may blot out the correlation of money and other variables. Changes in formal and informal controls on banking, as well as variations in the own-rate on money, may affect deposit behavior in a way that overwhelms the signal regarding aggregate economic activity contained in monetary aggregates.19 The relevance of these factors for the United Kingdom likely increased dramatically at the tailend of Friedman and Schwartz's sample period, as the first half of the 1970s featured deregulation and reregulation of U.K. banking, prompting major changes in interest payments on deposits and shifts in the relative sizes of the retail and wholesale deposit components of broad monetary series.20 Thus, Lothian (1976a) points to the early and mid-1970s as a period in which the study of U.K. monetary developments using broad aggregates is particularly problematic, with the distortions to monetary series from financial change swamping the signal contained in money regarding nonfinancial economic activity. Lothian contends that high-powered money should be used as the measure of U.K. money, in order to avoid distortions to the deposit series. In support of this point, it might be noted that Budd, Holly, Longbottom, and Smith (1984, p. 85) find a correlation between Sterling M3 growth and monetary base growth of -0.186 for 1971-1980; this contrasts with the high correlation (0.79) obtained between growth in broad money (M2) and high-powered money that is obtainable using Friedman and Schwartz's annual U.K. data for 1872-1970.21
But while financial innovation impacts heavily on the interpretation of U.K. monetary aggregate movements in the 1970s and the decades since, it is unlikely to account for the zero correlation that Friedman and Schwartz obtained. Friedman and Schwartz, it will be recalled, found zero or negative money/output correlations for the century from the 1870s to the 1970s and for various subperiods. And as Budd, Holly, Longbottom, and Smith (1984, p. 86) noted, distortions to monetary series such as those present in the 1970s are of "only limited relevance to the long-term historic[al] evidence" for the United Kingdom.
More generally, it deserves underlining that the correlation between money and output should be thought of as a system property of a model, and it does not depend exclusively on the properties of the money demand equation. Rather, the correlation depends also on other structural relationships, including the Phillips curve (which, in ensuring short-run price stickiness, allows the central bank's influence on nominal quantities and yields to affect the corresponding real series) and the IS relation or block of relations (connecting real aggregate demand to real financial variables). Just as the form of the money demand function is only one factor in shaping the money/output correlation, money demand stability neither ensures, nor is it critical for, the emergence of a positive correlation.
2.2.2 Stabilization policy and the money/output correlation
Another factor determining the value of the money/output correlation is of course the monetary policy rule in effect. That brings us to a second factor that might lead toward doubt that a money/output correlation should emerge in actual data. This factor is the possible presence of a stabilizing monetary policy. Even in conditions of well-measured money and money demand stability, it has been argued that the pursuit of optimal stabilization policy on the part of the monetary authority will eliminate the correlation between money and key series like output and inflation. Kareken and Solow (1963), Mankiw (1986), and Romer (2012, p. 222) raised this possibility, while Poole (1995) and Kishor and Kochin (2007) argue that it applies to the analysis of U.S. money data after 1982.
A number of considerations suggest that this factor is unlikely to be an important consideration in the case of long-run data for the United Kingdom. It should be stressed at the outset that monetary policy affects output via its influence on nominal aggregate demand. Thus, one should generally expect stabilization of output to be manifested also in stabilization of nominal income. In practice this is indeed what occurs in periods of smooth output behavior, if the Great Moderation period up to 2007 in the United States and the United Kingdom is a good guide. But the 1873-1975 period did not witness stabilization of nominal income growth: measured by 100 times the log difference, this growth rate ranged from minus 17.8 percent to plus 22.4 percent in Friedman and Schwartz's annual data, with a standard deviation of 6.3 percent.
It is, furthermore, not the case that even a well-executed stabilization policy need eliminate the money/output correlation. A policy that moderates output fluctuations may still leave a correlation between output and monetary policy variables; the regime may feature a low variance of output yet the correlation of money and output can still be high. Moreover, actual monetary policy will fall short of the theoretically achievable degree of stabilization; with lack of perfect information about the connections between monetary policy and goal variables, some unintended fluctuations of the goal variables is likely.
A further reason for doubting that stabilization policy should eliminate the money/output correlation is that a zero correlation is not a logical implication of optimal policy. Trade-offs may lead to lack of complete output stabilization and to a positive money/output correlation emerging. One frequently cited factor is the possible trade-off between real activity and inflation stabilization that may emerge from the economy's wage-setting structure (see especially Erceg, Henderson, and Levin, 2000). Perhaps more relevant, however, is the precise definition of the real goal for monetary policy. Because the criterion for optimal policy is output gap stabilization-not output stabilization per se-optimal monetary policy may give rise to a substantial, positive money/output correlation, as the authorities accommodate shocks to potential output. Woodford (2003, p. 297) provides several illustrations that bring out this point.
2.2.3 Data frequency and the money/output correlation
A third argument that might be invoked to rationalize a zero money growth/output growth correlation is that the data could be sampled at a frequency that delivers results that reflect the long-run neutrality of money. With the zero correlation emerging in U.K. annual data, one possible rationalization is that the effects of monetary policy on output are so transitory as to wear off on data within a year. Then the money/output correlation for data sampled as annual averages might be zero. But this possibility obviously does not square with the protracted effects of monetary policy that were apparently observed in the United Kingdom during the 1920s, nor is it consistent with much existing empirical evidence on the drawn-out output effects of monetary policy. Therefore, this possibility is not considered further.
An additional possibility is that, while nonneutral effects of monetary policy are evident when small groups of years are considered, a long sample of data delivers variations in money wide enough for the long-run neutrality property to dominate the picture. A parallel is provided by the U.S. Phillips curve experience. As Lucas (1996, pp. 666-667) emphasizes, downward-sloping Phillips curves are visible from inflation/unemployment scatter plots for segments of the postwar sample, but when all segments are combined into a single sample, no inflation/unemployment relationship is visible. In effect, the true Phillips curve relationship is between one "deviation" variable-inflation relative to expected inflation-and another-unemployment relative to its natural rate. Yet it is possible to find a relationship between the absolute levels of inflation and unemployment over short samples because variations in the expected-inflation term (and in the natural rate of unemployment) are typically muted in the short run. Likewise, in studying money/income relations, output growth and real money growth might be related in the long run thanks to the fact that the money demand function is structural and is expressed in real terms;22 but this long-run relationship will only engender a relationship between nominal money growth and output growth over short samples in which real money growth variation is dominated by nominal money growth behavior. Bringing all the short samples together might deliver a zero money growth/output growth correlation, provided real money growth behaves dissimilarly to nominal money growth over long stretches of data.
Again, it is questionable whether this scenario is relevant; a zero long-run sensitivity of output growth to money growth does not preclude a correlation between the two series on long stretches of annual data, as the annual time series data reflect behavior from a mixture of frequencies. But even if money growth and output growth were uncorrelated when considering a century of U.K. data, it would still be a puzzle if the correlation appeared to be absent in subperiods, notably the interwar period. Hence, in investigating money growth/output growth correlations for the United Kingdom, the analysis below will concentrate on studying the correlation in subperiods rather than for the whole period since the 1870s.
2.2.4 Monetary policy regimes and the money/output correlation
Finally, it might be questioned whether a money/output correlation has a straightforward interpretation for periods over which the money stock was not the monetary policy instrument. But there does, in fact, appear to be a straightforward interpretation. The emphasis in this paper on correlations involving money growth and output growth does not constitute an argument that the authorities used the money stock as an instrument. On the contrary, it is clear that, for the bulk of the period considered here, the U.K. policymakers chose values for Bank Rate (as the U.K. discount rate was known until 1972), often with a sterling exchange rate value as a target, and let the money growth rate adjust to levels consistent with these operating targets. But neither the choice of policy instrument nor the existence of a fixed exchange rate regime necessarily complicates the interpretation of money growth/output growth correlations. For those periods over which the U.K. authorities did not resort to exchange controls, the fixed exchange rate regime presumably meant that U.K. short-term interest-rate policy was concerned with maintaining the sterling exchange rate. It remained the case that aggregate demand was elastic with respect to domestic interest rates and that this elasticity was an important channel of monetary policy; indeed, as emphasized by Friedman and Schwartz (1982, pp. 319, 325) and McCallum (1989, p. 287), it is precisely via the creation of aggregate economic conditions consistent with their fixed exchange rate policy that monetary authorities can succeed over long stretches of time in pegging the exchange rate.
Furthermore, since the monetary authorities cannot choose interest rates and the money stock independently, different interest-rate decisions on the part of the monetary authorities imply different money stock paths. Thus, an interpretation of a positive money/output correlation as a reflection of the nonneutrality of money carries through to instances in which the central bank does not use the money stock or the monetary base as a target or instrument.
2.2.5 The bottom line: we should expect a positive money/output correlation
The conclusion is therefore that one should expect to find a positive correlation between money growth and output growth, if monetary policy is nonneutral in the short run. That expectation suggests that the absence of a U.K. money/output correlation is indeed a puzzle, and it deserves a fresh examination. The next section carries out that examination systematically.
3 Behavior of the correlation across sample periods
As noted above, the short-run nonneutrality of money is more likely to manifest itself in a positive money/output correlation in isolated episodes than in very long samples. Accordingly, the analysis here breaks Friedman and Schwartz's long sample into the pre-World War I (1873-1913), interwar (1919-1938), and postwar (which as a baseline is considered to be 1951-1975). As noted above, Friedman and Schwartz's annual data, rather than their phase-average transformed data, are considered here.
It will be convenient to consider the postwar data ahead of our consideration of the interwar period, because study of the postwar period will inform the analysis of money/output interwar relations. Accordingly, after a description of the output and money data series employed (Section 3.1), the analysis below considers the pre-World War I sample (Section 3.2), the Friedman-Schwartz postwar sample (Section 3.3), and then the interwar period (Section 3.4). Section 3.5 then considers the correlation in 1976-2010, outside Friedman and Schwartz's sample.
3.1 Data
Several series on U.K. monetary aggregates are considered here. Friedman and Schwartz (1982) measure money by an M2-type aggregate, and the annual data they use are the main money series considered here. The bank deposit data used for Friedman and Schwartz's M2 are largely those constructed by Sheppard (1971). Lothian (1975) and Capie and Webber (1985, pp. 42, 49) express reservations about Sheppard's monetary series before World War I, arguing in particular that it does not adequately net out interbank deposits. Capie and Webber construct a broad money series that is intended to improve on Sheppard's in this respect. In light of this, the pre-World War I results reported below using the Friedman-Schwartz money data are supplemented with results using Capie and Webber's money series. As Capie and Webber (1985) do not present any M2 series, their M3 series is used. U.K. M3 data should closely approximate M2 behavior over periods such as pre-World War II that predate the advent of modern wholesale deposit markets.
Annual data for M1 are reported by Capie and Webber (1985), but, of the three subperiods considered here, the M1 data are available for the postwar period only; hence, M1 results are presented below only for the postwar period.
Capie and Webber (1985) also tabulate a high-powered money series for the United Kingdom. This series, too, is used below. As mentioned earlier, Lothian (1976a) argued that high-powered money might improve on deposit-inclusive monetary aggregates over periods in which measured deposit series are affected by official controls over banking behavior. Gambs (1980), however, notes that a factor undermining the scope for high-powered money to proxy for a correctly-measured monetary aggregate is the fact that the reserves component of high-powered money can be distorted not only by changes in reserve requirements, but also by variations in reserve requirements for different types of deposit. One possible means of getting around this difficulty is to exclude required reserves from the reserves series included in the monetary base series. This procedure could produce a more interpretable monetary base series and it is simpler than attempting to make a detailed adjustment of the monetary base for changes in reserve requirements (and for interest on reserves). Friedman and Schwartz's high-powered money series does include required reserves,23 but Capie and Webber (1985) report historical data on the Bank of England M0 series which excludes required reserves.24 In light of these considerations, the analysis below considers two measures of the base: Friedman and Schwartz's high-powered money series and an M0 series consisting of the annual data reported by Capie and Webber (1985) up to 1969, spliced into annual averages of the Bank of England M0 series in 1969.
Four measures of output are used here. Two are the U.K. output series reported by Friedman and Schwartz (1982) in their tabulations of annual data. Of these, one consists of data on real net national product, corresponding to the estimates of Feinstein (1972) up to 1965 and extended by Friedman and Schwartz to 1975 using then-current U.K. national accounts data. The second output series used by Friedman and Schwartz is identical to their first series for the pre-World War I and interwar periods, but, as discussed in Section 3.3, differs from the first series for the postwar period as a result of Friedman and Schwartz's attempt to purge the data of the effects of price controls. The discussion of postwar results below refers to the series that does not embody Friedman and Schwartz's price-level adjustments as the "Friedman-Schwartz output series without adjustments" or "Friedman and Schwartz's unadjusted output series," and the adjusted series as the "Friedman-Schwartz output series with adjustments" or "Friedman and Schwartz's adjusted output series."
A further output series considered here is Backus and Kehoe's (1992) real GDP series for the United Kingdom. This series consists of a Feinstein (1972) output series-one different from the series used by Friedman and Schwartz (1982)-spliced in 1948 into annual data on the official U.K. real GDP series that was current at the time of the Backus-Kehoe study. The fourth and final series considered consists of annual real GDP data for 1948-2010, downloaded from the U.K. Office for National Statistics (ONS) website after the October 2011 national accounts revisions.
3.2 Pre-World War I correlations
The pre-World War I period can be considered most briefly because this sample does not really provide a puzzling money/output pattern. For this period, Friedman and Schwartz (1982, p. 399) report a correlation between money growth and output growth of 0.49 for the United Kingdom. With only nine pre-World War I observations in their phase-averaged growth rate data, this correlation is not statistically significant, but it stands at a value that would usually be regarded as economically sizable and that would soon acquire statistical significance if the correlation were maintained on an extended sample.25 It is possible that the compression of the annual data (which for the prewar United Kingdom amount to forty observations) into nine phase-average observations was the source of Friedman and Schwartz's result that the money/income correlation was insignificant before World War I. The remainder of this subsection examines whether a significant and positive money growth/output growth correlation emerges from the annual data.
The pre-World War I sample period is defined as 1873-1913. The 1873 starting point reflects the fact the Friedman-Schwartz data on the money stock (M2) start in 1871; money growth data thus begin in 1872. The sample used here for correlations begins in 1873 (rather than 1872) to cover correlations between output growth and both contemporaneous money growth and prior year's money growth. The rationale for considering the correlation with prior money growth is that monetary policy actions might affect output with a lag of six or nine months on average. In annual data, this pattern could be reflected in a contemporaneous money growth/output growth correlation, but it might instead tend to generate a stronger correlation between output growth and the prior year's growth rate in money. The end-date of 1913 is dictated by the fact that Friedman and Schwartz's money data are constructed from series that include the observation for December 1914, making their 1914 observation on money part of the wartime data.26
| k=0 | k=1 | k=0 | k=1 | |
| 1. Using Friedman-Schwartz M2 series | 0.22 | -0.09 | 0.32 | -0.11 |
| 1. Using Friedman-Schwartz M2 series (Standard Error) | (0.09) | (0.12) | (0.07) | (0.12) |
| 2. Using Capie-Webber M3 series | 0.31 | -0.05 | 0.40 | -0.08 |
| 2. Using Capie-Webber M3 series (Standard Error) | (0.10) | (0.14) | (0.08) | (0.13) |
| 3. Using Friedman-Schwartz base money series | 0.09 | -0.31 | 0.04 | -0.29 |
| 3. Using Friedman-Schwartz base money series (Standard Error) | (0.10) | (0.14) | (0.19) | (0.15) |
| 4. Using Capie-Webber base money series | 0.05 | -0.41 | -0.00 | -0.32 |
| 4. Using Capie-Webber base money series (Standard Error) | (0.16) | (0.15) | (0.20) | (0.19) |
The two output series available for the pre-World War I period are Friedman and Schwartz's series and Backus and Kehoe's (1992) series. Money growth/output growth correlations are reported in Table 1 for each of these output series. Newey-West (1987) standard errors, computed with a one-lag window, are reported in parentheses alongside the correlations. As it turns out, all the correlations of output growth and prior money growth are low or negative; accordingly, the discussion below concentrates on the contemporaneous correlations.
The correlation between money growth and output growth using Friedman and Schwartz's money and output data is positive (0.21) and on the borderline of significance, but is well below the 0.49 that Friedman and Schwartz report using smoothed data. A problem here appears to be the quality of the annual output data that Friedman and Schwartz chose. Backus and Kehoe (1992) argue that the output series that Friedman and Schwartz draw from Feinstein (1972) is based on too narrow a set of sources, and that a more reliable output series is a "compromise" real GDP series also reported by Feinstein (1972). It is the latter series that is used to measure pre-World War I output by Backus and Kehoe (1992). When this output series is used, the money growth/output growth correlation rises to 0.32, as shown in the table, and is now statistically significant.
A further consideration is that, as already noted, Capie and Webber (1985) provided estimates of broad money that were offered as an improvement on Friedman and Schwartz's pre-World War I series. Money growth/output growth correlations using their money series are also reported in the table, and they are higher than those using the Friedman-Schwartz series.
The table finally reports correlations using both monetary base series. Base growth/output growth correlations for the pre-World War I period are weak, apparently reflecting the influence on the correlations of the first twenty years of the 1873-1913 sample. In these years, the private sector's substitution of deposits for currency was in flux, so the monetary base was probably a poor proxy for households' overall money balances.
The upshot is that both Friedman and Schwartz's results for the pre-World War I period, together with the results here using annual data on broad money, establish a positive correlation between money growth and output growth. Moreover, once data at the annual frequency are considered and attention is turned to estimates of money and output that likely feature less measurement error, the correlation becomes statistically significant.
3.3 Post-World War II
Let us move some decades forward to the post-World War II period. The discussion here defines "postwar" using Friedman and Schwartz's cutoff date (1975), with some illustrative results using post-1975 data deferred until Section 3.5.
When examining Friedman and Schwartz's results for the postwar United Kingdom, it is crucial to recognize that Friedman and Schwartz attempted, for both U.S. and U.K. aggregate data, to correct for the distorting effects of official price controls. Friedman and Schwartz did so in the following manner. As is standard, Friedman and Schwartz took controls as having merely an artificial effect on recorded inflation. The inflation rate was assumed to be understated during the controls period and the removal of controls was assumed to usher in a catch-up process that brought the price level to the same value that it would have reached if the controls had never been put in place. Friedman and Schwartz additionally assumed that price controls have no effect on nominal GDP growth, affecting only the recorded division of nominal GDP growth between real GDP growth and inflation. To correct the inflation and real growth series for the effects of controls, Friedman and Schwartz reallocated the split of nominal income growth between inflation and real growth during the controls episodes, using the typical split observed in non-control episodes.
The procedure Friedman and Schwartz used for adjusting for controls clearly entailed strong assumptions. Nevertheless, it was not as nonstandard as some of their critics claimed. Goodhart (1982, p. 1541) expressed concern about Friedman and Schwartz's assumption that the nominal income path was invariant to the price controls, asking, "Would anyone not already convinced that nominal incomes are held in a monetary strait-jacket have made such calculations?" But the view that monetary policy determines nominal aggregate demand, with supply-side factors determining the price/output breakdown of nominal demand, is not an inherently "monetarist" position; it is widely shared in other schools of economics and in policy discussions. For example, the Keynesian-style discussion in Gordon (1982, p. 1106) refers to the factors determining the fraction of nominal income change absorbed by inflation as "aggregate supply behavior," and distinguishes these from "aggregate demand behavior" which, Gordon contends, determines total nominal income growth. Moreover, many recent presentations by U.K. policymakers have also cast nominal aggregate demand as the variable that monetary policy determines (see, for example, Bank of England, 2009, p. 10; Dale, 2009; and Tucker, 2010). Such a position lines up well with the notion that policymaker influence on nominal aggregate spending, together with temporary price stickiness, makes real output demand-determined in the short run. It is true that modern New Keynesian models generally do not admit a clean separation of nominal aggregate demand determination from the factors that affect the split of nominal spending between prices and output. But as a first approximation, viewing total nominal spending as demand-determined seems defensible, particularly in applications like Friedman and Schwartz's that refrain from spelling out an explicit structural model.27
There is a major caveat about the validity of this approximation. It happens that, while the Friedman-Schwartz adjustments are defensible under quite general Keynesian or monetarist conditions, those conditions were violated during the period of U.K. postwar price controls. Friedman and Schwartz adjusted U.K. observations for 1966 to 1974 (inclusive) for the effect of price controls. One of these years, 1974, did not meet the condition that real output and nominal aggregate spending are demand-determined in the short run. The reason is that in December 1973, in response to changed conditions of energy supply and a likely coal-mining strike, the U.K. government restricted the private sector and its own operations to a three-day working week. This three-day week prevailed for the bulk of the first quarter of 1974. The Friedman-Schwartz (1982) position holds that, for periods in which price controls prevail, monetary policy can still determine nominal aggregate demand, and higher aggregate demand will show up in higher measured real output. But with the three-day week severely constraining the degree to which normal production and transaction schedules in the economy could be carried out, output and hence nominal aggregate spending were constrained at the same time that price controls constrained the price level. To put this point differently: direct controls held down both the components-real growth and inflation-of nominal spending growth; therefore, nominal spending growth could not respond to the factors determining nominal aggregate demand, and the goods market did not clear. In 1974, total nominal spending growth-not just inflation-registered readings lower than the values to which market forces would otherwise drive it, and some of the frustrated aggregate demand pressure was presumably manifested in goods shortages and in involuntary savings.
Reflecting these unusual events, growth of U.K. nominal GDP, as measured using annual-average data, slowed down from 1973 to 1974 as the three-day week made itself felt. Nominal income growth then picked up again from 1974 to 1975, partly reflecting the resumption of the regular workweek. Table 2 shows that this pattern of U.K. nominal income growth is apparent both in the data used by Friedman and Schwartz (1982) and in the modern vintage of nominal GDP data.
The three-day workweek episode means that annual data on output and nominal spending behavior did not adequately reflect the course of aggregate demand conditions in the mid-1970s.28 Most likely, absent the three-day week, nominal spending growth would not have fallen in 1974; indeed, it may instead have peaked in 1974 rather than in 1975. Inflation-which, as discussed below, typically lags nominal spending growth somewhat-may have been higher under that scenario in 1974 but would still have peaked in 1975. As it was, inflation and nominal income growth, most atypically, peaked in the same year, 1975.
| Friedman and Schwartz (1982) data on U.K. nominal income growth | U.K. nominal GDP growth, modern data vintage | |
| 1966 | 5.6 | 6.4 |
| 1967 | 5.4 | 5.5 |
| 1968 | 6.8 | 8.4 |
| 1969 | 5.5 | 7.7 |
| 1970 | 9.8 | 9.9 |
| 1971 | 12.3 | 11.6 |
| 1972 | 11.7 | 12.1 |
| 1973 | 16.6 | 15.4 |
| 1974 | 14.8 | 13.4 |
| 1975 | 25.0 | 26.3 |
Friedman and Schwartz take nominal spending as the measure of aggregate demand and in turn as an indicator of the direction in which inflation would have moved in the absence of controls. Consequently, from the fall in nominal income growth in 1974, they infer that "true" inflation fell that year-see Table 3, which lays out Friedman and Schwartz's data and their adjustments to it-and accordingly they shift output growth down and inflation up.
This adjustment leads, however, to implausible behavior of Friedman and Schwartz's adjusted output series. Friedman and Schwartz (1982, p. 119) note that their series implies that no decline in physical output occurred in 1975. In their original output series and in modern vintages of real GDP growth, there are observed output declines in the United Kingdom in 1974 and 1975; in fact, these are the only postwar years prior to 1980 for which real GDP declined in the United Kingdom in the Office for National Statistics data (which begin in 1948). It would not be accurate to suggest that the back-to-back declines in GDP in the annual data reflected a long recession. Instead, there were two distinct periods of decline in the mid-1970s, interrupted by a roughly six-month rebound. If one examines the current vintage of quarterly real GDP data, there were small declines in real GDP in the second half of 1973, followed by a sharp contraction in 1974 Q1, reflecting the three-day week. Increases in real GDP follow in the second and third quarters of 1974, after which there are further declines in 1975 Q2 and 1975 Q3. The decline in output in 1974 reflected the impact of the three-day week, while the decline in late 1974 and 1975 reflects a recession likely resulting largely from the tightening of monetary policy in late 1973 and early 1974. The declines in output during 1975 were much greater than those observed in 1973, and have a pronounced reflection in a number of indices of production and employment.29 But the declines appear to have been genuine and they appear in a number of indices of production and employment besides the national accounts. Friedman and Schwartz (1982, pp. 119-120) acknowledge that these indices do not give clear-cut support for their position that the measured declines in output in the mid-1970s were spurious.
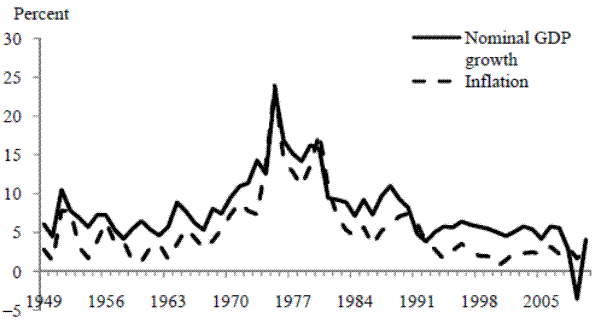
There is an additional problem with Friedman and Schwartz's adjustments for price controls. As Goodhart (1982, p. 1541) points out, Friedman and Schwartz take price controls as in force over the years 1966 to 1974, and they adjust the whole of the 1966-1974 period for the effect of price controls. Yet broad-based statutory controls were in force only in 1966-1967 and from late 1972 to early 1974. Friedman and Schwartz's adjustment of pre-1972 annual data for the effect of controls is probably unnecessary. Indeed, the adjustment produces implausible behavior of the aggregate data. It has often been observed that inflation tends to lag nominal GDP growth on average, as one would expect if there is some inertia in inflation. This regularity was documented for the United States by Nelson (1979) and was noted by Friedman (1985) as holding for several countries including the United Kingdom. McCallum and Nelson (2011) show that the regularity continues to prevail for a set of advanced economies, including the United Kingdom. This pattern is brought out clearly in modern vintages of nominal income growth and inflation data (Figure 2).
The regularity is also present in Friedman and Schwartz's postwar data for the United Kingdom. Without any adjustment for price controls, Friedman and Schwartz's inflation data for 1956-1973 is more highly correlated with prior nominal income growth than with current nominal income growth (see Table 4). After they adjust the data for price controls, however, the peak correlation of inflation and nominal income growth for 1956-1973 is the contemporaneous one. The adjustments made to the price and output series prior to 1973 probably did not remove control-induced distortions to measured output; instead, they likely obscured some of the short-run effects of monetary policy on output from the data. It is true that, irrespective of whether the series are adjusted for controls, the peak correlation between nominal income growth and inflation is contemporaneous for the 1956-1975 sample.30 This result, however, is likely to be an artifact of the three-day workweek-in whose absence, as argued above, nominal GDP growth in the mid-1970s would have likely peaked ahead of inflation.
| Friedman-Schwartz U.K. output growth-unadjusted | Friedman-Schwartz U.K. output growth-with adjustments | U.K. real GDP growth, modern vintage | Friedman-Schwartz U.K. inflation series-unadjusted | Friedman-Schwartz U.K. inflation series-with adjustments | U.K. deflator inflation series, modern vintage | |
| 1966 | 1.6 | 0.9 | 1.9 | 3.9 | 4.6 | 4.4 |
| 1967 | 2.3 | 0.9 | 2.5 | 3.0 | 4.4 | 2.9 |
| 1968 | 3.2 | 1.1 | 4.2 | 3.5 | 5.6 | 4.0 |
| 1969 | 1.8 | 0.9 | 2.1 | 3.6 | 4.6 | 5.5 |
| 1970 | 1.8 | 1.6 | 2.2 | 7.9 | 8.1 | 7.5 |
| 1971 | 1.8 | 1.9 | 2.1 | 10.3 | 10.2 | 9.3 |
| 1972 | 1.4 | 1.9 | 3.7 | 10.2 | 9.7 | 8.1 |
| 1973 | 7.5 | 2.6 | 7.2 | 8.5 | 13.7 | 7.6 |
| 1974 | -0.7 | 2.3 | -1.3 | 15.6 | 12.2 | 14.9 |
| 1975 | -2.7 | 3.8 | -0.6 | 28.5 | 20.5 | 27.1 |
Note: Percent changes measured in figure as 100 times log differences
| k=0 | k=1 | k=2 | k=0 | k=1 | k=2 | |
| 1. 1956-1973: Friedman-Schwartz inflation data, unadjusted | 0.73 | 0.74 | 0.53 | 0.76 | 0.82 | 0.70 |
| 1. 1956-1973: Friedman-Schwartz inflation data, unadjusted (Standard Error) | (0.16) | (0.07) | (0.08) | (0.17) | (0.14) | (0.20) |
| 1. 1956-1973: Friedman-Schwartz inflation data, adjusted | 0.82 | 0.74 | 0.67 | 0.85 | 0.84 | 0.81 |
| 1. 1956-1973: Friedman-Schwartz inflation data, adjusted (Standard Error) | (0.12) | (0.09) | (0.17) | (0.13) | (0.11) | (0.22) |
| 1. 1956-1973: Modern vintage of inflation data | 0.66 | 0.71 | 0.46 | 0.76 | 0.85 | 0.61 |
| 1. 1956-1973: Modern vintage of inflation data (Standard Error) | (0.12) | (0.06) | (0.16) | (0.14) | (0.12) | (0.20) |
| 2. 1956-1975: Friedman-Schwartz inflation data, unadjusted | 0.91 | 0.82 | 0.84 | 0.92 | 0.81 | 0.88 |
| 2. 1956-1975: Friedman-Schwartz inflation data, unadjusted (Standard Error) | (0.12) | (0.08) | (0.21) | (0.09) | (0.08) | (0.21) |
| 2. 1956-1975: Friedman-Schwartz inflation data, adjusted | 0.93 | 0.83 | 0.86 | 0.93 | 0.86 | 0.91 |
| 2. 1956-1975: Friedman-Schwartz inflation data, adjusted (Standard Error) | (0.05) | (0.06) | (0.10) | (0.05) | (0.05) | (0.06) |
| 2. 1956-1975: Modern vintage of inflation data | 0.89 | 0.81 | 0.83 | 0.92 | 0.82 | 0.85 |
| 2. 1956-1975: Modern vintage of inflation data (Standard Error) | (0.15) | (0.10) | (0.27) | (0.10) | (0.11) | (0.32) |
Another dimension on which the Friedman-Schwartz adjustments can be viewed as questionable is in their implications for the serial correlation of output growth. Friedman and Schwartz (1982) note that, over most of their period, U.K. output growth has little serial correlation in their phase-average data. This is generally true of their annual data too. But their adjustment for price controls actually introduces appreciable autocorrelation into output growth-raising the AR (1) parameter in a first-order autoregression of output growth in 1957-1975 from 0.11 to 0.35.31 An adjustment that is meant to restore patterns of U.K. output behavior more like those that would be observed without price controls in fact produces a degree of persistence in U.K. output growth that seems to be contrary to the historical pattern.
It appears appropriate to conclude that, while Friedman and Schwartz's adjustment procedure has some appeal and may have been appropriate for earlier periods in their sample, their application of the adjustments to the postwar data suffers from flaws.32 These flaws were, first, taking 1966-1974 rather than 1973-1974 as the dates to which to apply adjustments, and second, relying on nominal GDP as an aggregate demand barometer for the mid-1970s.33
In keeping with this conclusion, the unadjusted output data are used in considering money/output correlations in the postwar period. When interpreting correlations derived from that dataset, it should be recognized that the three-day workweek episode in the United Kingdom in 1974 not only makes the Friedman-Schwartz adjustment for price controls unreliable; it also hinders interpretations of money growth/output growth correlations even using the unadjusted data. With output not demand-determined in 1974, the usual expectation that price stickiness will make money growth and output growth positively correlated is not met. One previous clue in the literature pointing to the importance of the 1974 observation to the money growth/output growth correlation lies in Brown and Darby's (1985, p. 44) statement that for 1953-1973 the correlation between money growth (using IFS data on M2 growth) and real GDP growth in the United Kingdom is significant, although they do not report the value of the correlation.34 This contrasts sharply with the correlation of only 0.14 between M2 growth and output growth reported by Backus and Kehoe (1992) for 1951-1975, using M2 and output data similar to that used by Brown and Darby (1985).35 With this background in mind, let us now turn to numerical results for the postwar period.
| k = 0 | k = 1 | k = 0 | k = 1 | |
| Using Friedman and Schwartz's M2 series: 1946-1975 | -0.09 | -0.03 | -0.03 | -0.23 |
| Using Friedman and Schwartz's M2 series: 1946-1975 (Standard Error) | (0.11) | (0.13) | (0.16) | (0.17) |
| Using Friedman and Schwartz's M2 series: 1951-1975 | 0.06 | 0.13 | 0.10 | -0.14 |
| Using Friedman and Schwartz's M2 series: 1951-1975 (Standard Error) | (0.11) | (0.11) | (0.13) | (0.22) |
| Using Friedman and Schwartz's M2 series: 1956-1975 | 0.06 | 0.13 | 0.11 | -0.18 |
| Using Friedman and Schwartz's M2 series: 1956-1975 (Standard Error) | (0.13) | (0.13) | (0.24) | (0.22) |
| Using Friedman and Schwartz's M2 series: 1956-1973 | 0.05 | 0.07 | 0.40 | 0.48 |
| Using Friedman and Schwartz's M2 series: 1956-1973 (Standard Error) | (0.10) | (0.10) | (0.13) | (0.09) |
| Using Friedman and Schwartz's base money series: 1946-1975 | -0.00 | -0.23 | 0.09 | -0.48 |
| Using Friedman and Schwartz's base money series: 1946-1975 (Standard Error) | (0.09) | (0.22) | (0.19) | (0.11) |
| Using Friedman and Schwartz's base money series: 1951-1975 | 0.13 | -0.03 | 0.22 | -0.39 |
| Using Friedman and Schwartz's base money series: 1951-1975 (Standard Error) | (0.11) | (0.22) | (0.17) | (0.10) |
| Using Friedman and Schwartz's base money series: 1956-1975 | 0.12 | -0.06 | 0.22 | -0.46 |
| Using Friedman and Schwartz's base money series: 1956-1975 (Standard Error) | (0.11) | (1.11) | (0.19) | (0.11) |
| Using Friedman and Schwartz's base money series: 1956-1973 | 0.08 | -0.41 | 0.54 | -0.13 |
| Using Friedman and Schwartz's base money series: 1956-1973 (Standard Error) | (0.07) | (0.31) | (0.06) | (0.17) |
The first set of results reported in Table 5 refers to the correlation of Friedman and Schwartz's M2 growth series with output growth-where the output series considered are both with and without their adjustments for price controls. For 1946-1975, the correlations between M2 growth and adjusted output growth are all small and insignificant, consistent with Goodhart's findings for this sample. When the unadjusted output growth series is used, correlations remain low. When the sample considered is 1951-1975 (Friedman and Schwartz's definition of the postwar period), the correlations are again low irrespective of the output series considered; note also that the correlation of 0.10 between money growth and the unadjusted output growth series is close to Backus and Kehoe's 0.14 for the same period.36 Because of the Korean War and associated price controls, a better definition of the postwar period is probably 1956-1975. As the table shows, this sample continues to deliver near-zero correlations irrespective of output definition. But when the crucial distortion from the 1974 observation is taken into account by changing the sample to 1956-1973, the correlations of current and lagged money growth with unadjusted output growth become sizable and significant: 0.40 and 0.48, respectively. The correlations do stay low if Friedman and Schwartz's adjusted output series is used; as discussed above, however, that output series implies less plausible patterns than the unadjusted series in most years.
The table also reports results using Friedman and Schwartz's high-powered money data. These results agree with those for M2 in suggesting that a significant correlation emerges if mid-1970s data are dropped and Friedman and Schwartz's adjustments to the output data are not applied. Indeed, the contemporaneous correlation for 1956-1973 of high-powered money growth with output growth is, at 0.54, higher than the M2 growth/output growth correlation, supporting Lothian's (1976a) advocacy of the use of a base-type series to proxy U.K. money growth. A similar picture emerges using the official M0 definition of the monetary base, as the table shows.
Figure 3 plots for the period 1956-1975 the growth rate for Friedman and Schwartz's unadjusted output series against their money growth (M2) series. The scatter establishes two features that are not obvious from the correlations reported for that period. First, there does appear to be a general tendency for money growth and real income growth to be positively related: note, in particular, that low money growth was associated with low output growth in 1956, while high money growth was associated with high output growth in 1973. Second, the message underlined by Lucas (1996) concerning the Phillips curve has an analogue here. As mentioned above, Lucas noted that downward-sloping unemployment/inflation scatter diagrams-consistent with short-run monetary nonneutrality-are visible in historical data if the scatters are separated into subperiods corresponding roughly to different means of inflation. The same sort of phenomenon is apparent in Figure 3: the scatter of money growth/output growth observations in Figure 3 seems to be positively sloped for 1956-1970, with a separate positively-sloped scatter emerging from the observations for 1971-1975. By the latter period, agents had presumably adjusted their expectations of inflation up considerably, so that a higher money growth rate was required to deliver a short-run real stimulus. Even from the perspective of the 1971-1975 scatter, however, the observation for 1974 seems to be something of an outlier.
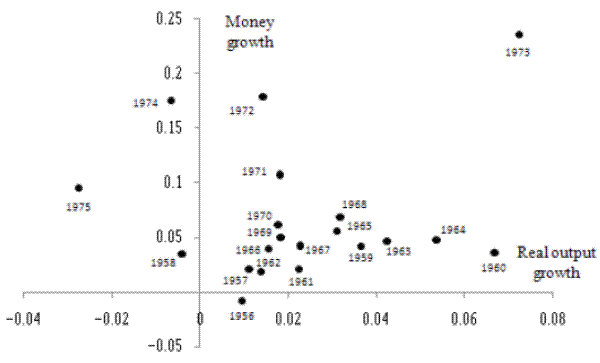
Source: Friedman and Schwartz (1982), using their unadjusted output series.
These impressions are underscored by correlation results that build on Table 5. The correlations reaffirm the important influence of the 1974 observation as well as the shift in the relationship between the means of money growth and output growth after 1970. For example, as shown in Table 4, using Friedman and Schwartz's M2 growth and their unadjusted output growth series, the simple correlation between money growth and output growth for 1956-1975 is only 0.11. If the 1974 observation is deleted, however, this correlation rises to 0.26. If the 1974 observation is restored but correlations for 1956-1970 and 1971-1975 are calculated separately, the resulting correlations of 0.35 and 0.77, respectively, are both higher than the full-sample correlation. If the 1956-1975 correlation is recalculated allowing for a break in the mean of the relationship after 1970,37 the correlation for 1956-1975 rises to 0.60; if this exercise is repeated excluding the 1974 data point, the correlation rises to 0.66.
| k=0 Friedman-Schwartz M2 | k=1 Friedman-Schwartz M2 | k=0 Friedman-Schwartz base money | k=1 Friedman-Schwartz base money | k=0 M0 | k=1 M0 | k=0 M1 | k=1 M1 | |
| 1949-1975 | 0.15 | -0.15 | 0.22 | -0.46 | -0.13 | -0.39 | 0.19 | 0.18 |
| 1949-1975 (Standard Error) | (0.17) | (0.23) | (0.18) | (0.11) | (0.23) | (0.17) | (0.30) | (0.13) |
| 1951-1975 | 0.17 | -0.14 | 0.25 | -0.48 | -0.10 | -0.45 | 0.21 | 0.19 |
| 1951-1975 (Standard Error) | (0.17) | (0.24) | (0.17) | (0.13) | (0.24) | (0.16) | (0.29) | (0.13) |
| 1956-1975 | 0.20 | -0.16 | 0.26 | -0.53 | -0.13 | -0.55 | 0.18 | 0.26 |
| 1956-1975 (Standard Error) | (0.17) | (0.24) | (0.18) | (0.12) | (0.25) | (0.13) | (0.27) | (0.12) |
| 1956-1973 | 0.58 | 0.60 | 0.60 | -0.0 | .54 | -0.14 | 0.55 | 0.53 |
| 1956-1973 (Standard Error) | (0.11) | (0.06) | (0.05) | (0.41) | (0.13) | (0.71) | (0.33) | (0.10) |
Note: Source for M0 is Bank of England and Capie and Webber (1985). Source for M1 is Capie and Webber (1985) up to 1964 and Hendry-Ericsson (1991b) thereafter. Newey-West standard errors (based on a one-lag window) are reported in parentheses.
The visual and correlation evidence therefore supports the conclusion that a positive money/output relationship is present in Friedman and Schwartz's postwar data; this relationship is obscured from correlations computed from the postwar sample (either with annual data, as here, or with phase-average data, as in Friedman and Schwartz's analysis) by the industrial turmoil of the mid-1970s, by Friedman and Schwartz's adjustment of output data for price controls, and by the shift in the money/output relationship engendered by the sharp rise in U.K. inflation in the 1970s.
Output growth for the United Kingdom in the postwar period to 1975 has been revised substantially since the vintage of the data considered by Friedman and Schwartz (1982); for example, output growth rates in 1968 and 1972 were 3.2% and 1.4% respectively in Friedman and Schwartz's (unadjusted) dataset but stand at 4.2% and 3.7% respectively in the modern vintage (Table 3). Table 6 reports correlations between money growth and the modern vintages of output growth series, using Friedman and Schwartz's postwar sample. For the money growth/output growth correlation, the story is much the same: the correlations become positive and significant when the 1956-1973 sample is considered. Indeed, these correlations are higher when the modern GDP data are used.
As an addendum, the table reports money growth/output growth correlations for two narrow money series corresponding to the series formerly reported by the Bank of England as M0 and M1. The results are similar to those shown earlier: correlations become significant for the 1956-1973 period.38 Again, the 1974 observation plays a major role in lowering the correlations, with the correlation increasing sharply when the sample period is restricted to 1956-1973.
The upshot is that a positive money growth/output growth correlation is present in the postwar sample period considered by Friedman and Schwartz (1982). Friedman and Schwartz did not find that correlation because the underlying positive correlation was obscured by the industrial turmoil of 1974 and by their attempt to adjust U.K. national accounts series for the effects of price controls. If the output data without Friedman and Schwartz's adjustments are considered, money growth and output growth are correlated in the United Kingdom in the years prior to 1973; moreover, the series are significantly correlated for the whole period to 1975 if allowance is made for the impact of the 1974 observation and/or the rise in average inflation after 1970.
3.4 Interwar period
It was remarked earlier that monetary/real interactions during the U.K. interwar period are of particular interest because the literature on this period is fundamentally divided. On one side of the divide, the interwar period is invoked in historical accounts as a leading example of the persistent real effects of a restrictive monetary policy. On the other side, there is considerable interest in this period on the part of real business cycle theory adherents, notably Cole and Ohanian (2002), who offer it a case of output depression in which monetary policy did not play a significant role. Friedman and Schwartz (1982) would appear to provide ammunition to the RBC case: they find a wrongly signed and insignificant correlation (minus 0.32) between money growth and output growth for the interwar period-see their page 399-and Cole and Ohanian use Friedman and Schwartz's (1982) own annual data to document the fact that the fall in U.K. output preceded the weakness in nominal money and the price level. Moreover, the correlations between output growth and money growth using annual data also appear consistent with there being little relation (Table 7). As the table shows, this is especially so if the early 1920s are included in the sample. The correlation does turn positive, though for the most part remains insignificant, if these years are omitted and the sample period is restricted to 1922-1938; but the early 1920s are crucial to the interwar depression since output fell 12.5% in 1919, 8.3% in 1920, and 5.9% in 1921.39
The strike of 1926 is an obvious real disturbance that could obscure the underlying money/output correlation, in much the same way that the industrial turmoil of 1974 was found to leave a mark on the postwar money/output correlations. To investigate this possibility, partial correlations between money growth and output growth were computed after including intercept dummy variables for both 1926 and 1927.40 These partial correlations, however, turn out to be similar to those in Table 6 and do not even move the correlations in a positive direction. While, in Table 6, the correlation for 1919-1938 of the Friedman-Schwartz money growth and output growth is -0.48, with -0.67 if money leads by a year, the partial money/output correlations conditional on the strike dummies are -0.53 and -0.72, respectively.
Lucas (1996, pp. 667-668) takes the message of Friedman and Schwartz's work as being that severe output depressions invariably reflect deeply contractionary monetary policies. But if the Cole-Ohanian analysis is accepted, then this message would appear not to be an empirically valid generalization. Moreover, it would appear that Friedman and Schwartz are hoisted on their own petard, since Cole and Ohanian's counterexample-i.e., a U.K. output depression seemingly occurring without monetary stringency-makes use of the U.K. monetary series Friedman and Schwartz themselves assembled.
The surface evidence on money/real interactions thus favors a real interpretation of the U.K. interwar period. A monetary interpretation starts to emerge, however, once one digs beneath the surface.
| k=0 | k=1 | k=0 | k=1 | |
|---|---|---|---|---|
| 1. 1919-1938: Using Friedman-Schwartz M2 series | -0.48 | -0.67 | -0.47 | -0.71 |
| 1. 1919-1938: Using Friedman-Schwartz M2 series (Standard Error) | (0.13) | (0.08) | (0.14) | (0.12) |
| 1. 1919-1938: Using Friedman-Schwartz base money series | -0.24 | -0.56 | -0.20 | -0.57 |
| 1. 1919-1938: Using Friedman-Schwartz base money series (Standard Error) | (0.14) | (0.12) | (0.15) | (0.14) |
| 1. 1919-1938: Using Capie-Webber base money series | -0.29 | -0.63 | -0.27 | -0.66 |
| 1. 1919-1938: Using Capie-Webber base money series (Standard Error) | (0.15) | (0.11) | (0.14) | (0.13) |
| 2. 1923-1938: Using Friedman-Schwartz M2 series | 0.13 | 0.05 | 0.19 | 0.12 |
| 2. 1923-1938: Using Friedman-Schwartz M2 series (Standard Error) | (0.16) | (0.18) | (0.15) | (0.16) |
| 2. 1923-1938: Using Friedman-Schwartz base money series | 0.16 | 0.07 | 0.24 | 0.11 |
| 2. 1923-1938: Using Friedman-Schwartz base money series (Standard Error) | (0.12) | (0.21) | (0.09) | (0.20) |
| 2. 1923-1938: Using Capie-Webber base money series | 0.23 | 0.04 | 0.24 | 0.07 |
| 2. 1923-1938: Using Capie-Webber base money series (Standard Error) | (0.14) | (0.22) | (0.12) | (0.21) |
Note: For the first two columns labeled k=0 and k=1, it uses the Friedman and Schwartz output series and Output = real net national product series. For the second two columns, it uses Backus and Kehoe output series and Output = real GDP. For the period considered in the table, Friedman and Schwartz's (1982) output series uses Feinstein's (1965) data on net national product while the Backus-Kehoe (1992) real GDP data is the Feinstein's compromise output series Newey-West standard errors (generated with a one-lag window) are given in parentheses.
As a first step, consider the correlation between two prominent nominal variables, nominal income growth and inflation. Section 3.2's discussion of the postwar period noted the well-established postwar regularity, which appears to be a by-product of price stickiness, that nominal GDP growth leads inflation. In the interwar period that dynamic pattern again emerges-but, importantly, only if the early 1920s are omitted. This is brought out in Figure 4, which plots the two series and in Table 7, which reports correlations. The peak correlation is contemporaneous for the period as a whole, but the familiar regularity of nominal income growth moving ahead of inflation comes out clearly if the sample is restricted to the period 1923-1938. Likewise, the plot of the two series shows that nominal income growth troughed ahead of inflation in the early 1920s and early 1930s41 (Figure 4); see also Table 8.
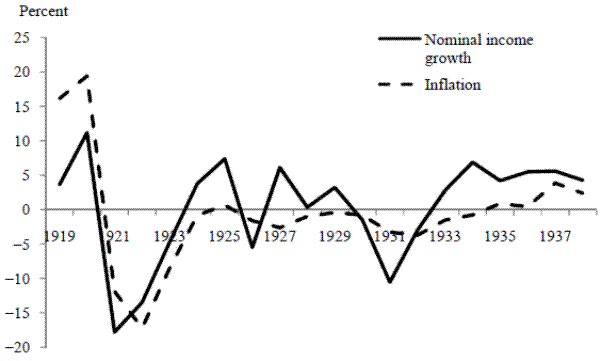
Note: Percent changes measured as 100 times log differences
| 1919-1938 | 1923-1938 | |
| k = 0 | 0.73 | 0.62 |
|---|---|---|
| k = 0 | (0.13) | (0.20) |
| k = 1 | 0.59 | 0.80 |
| k = 1 | (0.06) | (0.16) |
Note: Inflation and nominal income growth are log-differences of the price and nominal income levels data from Friedman-Schwartz's (1982) annual series. Newey-West standard errors (using a one-lag window) appear in parentheses.
Next, consider real money and real output. As noted previously, real money and real output should be positively correlated in an RBC account of events as well as in a sticky-price account; the difference is that in a sticky-price account expansions of the money stock expand the realmoney stock in the short run, so real balances in the short run are a policy variable.
Figure 5a, following Rose (1983), plots actual levels of output and real money for the interwar period; Figure 5b plots corresponding growth rates. A clearly visible aspect of the relationship is that real money moves ahead of output. This is a notable feature of the early 1920s which, as we have seen, is not a period over which nominal money growth is well correlated with current or future output growth. Cole and Ohanian (2002), like Friedman and Schwartz, regard timing evidence as suggestive: for example, Cole and Ohanian cite the fact that U.K. nominal money and prices lag the output decline in 1920 as evidence against a monetary account of the interwar depression. By Cole and Ohanian's own criterion, the fact that real money moved ahead of output is supportive of a monetary explanation. It is consistent with an account in which monetary policy actions permitted a squeeze on real money balances and thereby produced upward pressure on real interest rates that mattered for real aggregate demand. The visual impression of a relationship is confirmed by correlations between real money growth and output growth. For the period 1919-1938, output growth (using the Friedman-Schwartz data) has a correlation of 0.24 with same-year real M2 growth and 0.46 with previous-year real M2 growth. For the same period, the correlation between output growth and contemporaneous real monetary base growth (using the Friedman-Schwartz data on the base) is 0.37, and the correlation between output growth and prior real monetary base growth is also 0.37. The behavior of real money balances also provides a possible way out for a monetary explanation of the interwar depression in the face of Cole and Ohanian's (2002, pp. 25-26) critique. Cole and Ohanian observe that much of the collapse in U.K. output was concentrated in the two years following the end of World War I-a fact that the discussion above of Figure 1 noted in connection with the outlying observations for 1919 and 1920. Cole and Ohanian take this fact as inconsistent with a monetary explanation because money and prices rose substantially in these years. In this connection, Cole and Ohanian report the cumulative growth of money and prices (from Friedman and Schwartz's dataset) in the two years following the end of World War I. As they report, money rose 30% and prices rose 43%. Thus inflation outstripped money growth and, in line with Figure 5, real money balances contracted. Given that real money balances seem to have an important relationship with output, a monetary interpretation of the depression might be available if it is the case that still faster rates of money growth could have prevented this contraction in real balances. Further support for the monetary interpretation of the depression emerges if we temporarily leave behavior of monetary aggregates aside and approach the problem from a different angle. As Ball (1982, p. 203) and Rose (1983) note, interwar U.K. output behavior seems reconcilable with a monetary explanation if interest rates, both real and nominal, are considered.42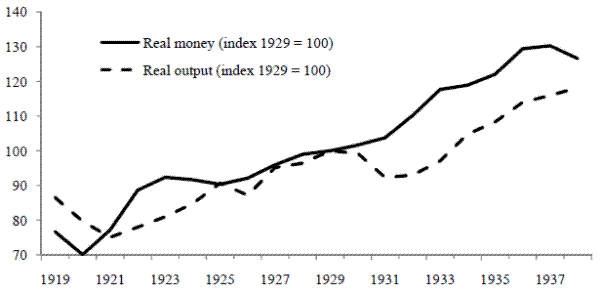
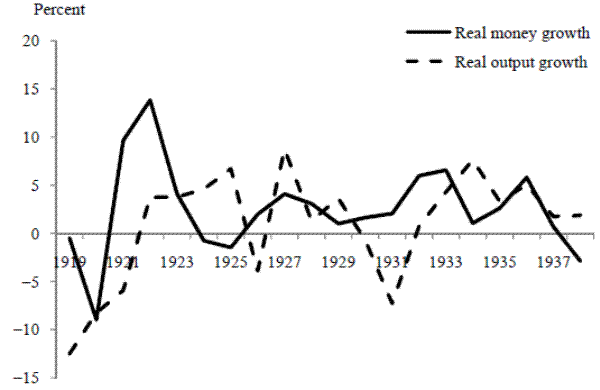
| k=0 | k=1 | k=0 | k=1 | |
| 1. 1919-1938: Using the nominal Treasury bill rate | -0.41 | -0.29 | -0.48 | -0.34 |
| 1. 1919-1938: Using the nominal Treasury bill rate (Standard Error) | (0.16) | (0.13) | (0.18) | (0.12) |
| 1. 1919-1938: Using a real Treasury bill rate measure (nominal rate minus current inflation) | 0.34 | 0.64 | 0.35 | 0.70 |
| 1. 1919-1938: Using a real Treasury bill rate measure (Standard Error)(nominal rate minus current inflation) | (0.17) | (0.15) | (0.17) | (0.19) |
| 2. 1923-1938: Using the nominal Treasury bill rate | -0.16 | -0.20 | -0.22 | -0.26 |
| 2. 1923-1938: Using the nominal Treasury bill rate (Standard Error) | (0.15) | (0.14) | (0.14) | (0.14) |
| 2. 1923-1938: Using a real Treasury bill rate measure nominal rate minus current inflation) | -0.16 | 0.10 | -0.22 | 0.07 |
| 2. 1923-1938: Using a real Treasury bill rate measure nominal rate minus current inflation (Standard Error)) | (0.19) | (0.10) | (0.17) | (0.13) |
These earlier authors report no correlations, but it turns out that the interest rate/output correlation is negative over the interwar period: see Table 9, which reports correlations between output growth and real and nominal short-term interest rates. For simplicity, the real rate is measured as the nominal rate minus the same-year inflation rate.43
The inverse relationship between output and nominal interest rates, as well as between output and real interest rates, both of which King and Watson (1996, p. 39) highlight as a feature of postwar U.S. data, is on the whole present in the U.K. interwar data. In Table 9, nominal rates and output growth have quite strong negative correlations for 1919-1938; these correlations diminish but remain negative for 1923-1938. For output and real interest rates, there is a positive correlation for 1919-1938, but this correlation turns negative (though insignificant) for the shorter sample. The sharply different 1919-1938 real rate/output correlations may be due to the crudeness of the approximation that actual inflation corresponds to expected inflation. It would appear that we are in a good position to associate the United Kingdom's output weakness with tight monetary policy provided that we are able to attribute the high real and nominal interest rates of the period to monetary stringency, and also provided that we can establish reasons why actual inflation may be a poor proxy for expected inflation in the years 1919 to 1922.
To the RBC adherent, interest rates should be taken off the list of monetary policy variables because the liquidity effect of an open market operation is itself predicated on short-run nominal stickiness. The interest rate-even the nominal rate-is a "real" variable in an RBC world in the sense that a monetary injection, under price flexibility, will not lower interest rates.44 On the other hand, in a sticky-price model, actions on the nominal money stock affect the real money stock in the same direction and so will tend to influence the nominal interest rate (and thereby the real interest rate). Movements in the real money stock were inversely related to those in the nominal interest rate over the interwar period: the correlation between the nominal Treasury bill rate and real base growth (Friedman-Schwartz definition) is -0.42 for 1919-1938 and -0.61 for 1923-1938, while the correlation between the nominal Treasury bill rate and real M2 growth is -0.26 for 1919-1938 and -0.18 for 1923-1938 (with these correlations improving to -0.37 and -0.23, respectively, if the previous year's real M2 growth is used).
Thus, a crucial condition is required to justify including the output/real money balances and output/interest rate correlations for the interwar period as evidence in favor of a monetary interpretation of the output depression: it would have to be established that nominal money stock movements are systematically related to real money stock movements. If we do this, we are well on our way to reclaiming the U.K. interwar depression as largely a monetary phenomenon.
Do the U.K. nominal and real money stocks move together over the interwar period? Table 10 gives the correlations. Irrespective of whether one considers M2 or the two monetary base series, it is the case that nominal money growth and real money growth are positively and significantly correlated over 1923-1938 but not over 1919-1938. Again, the early 1920s observations are influential and-by disconnecting real and nominal money balance behavior-seemingly tilt the data in favor of a flexible-price interpretation.
| 1919-1938 | 1923-1938 | |
| Correlation of nominal M2 growth and real M2 growth (using Friedman-Schwartz M2 data) | -0.40 | 0.48 |
| Correlation of nominal M2 growth and real M2 growth (using Friedman-Schwartz M2 data) (Standard Error) | (0.17) | (0.10) |
| Correlation of nominal money base growth and real money base growth (using Friedman-Schwartz base money data) | -0.07 | 0.58 |
| Correlation of nominal money base growth and real money base growth (using Friedman-Schwartz base money data) (Standard Error) | (0.25) | (0.13) |
| Correlation of nominal money base growth and real money base growth (using Capie-Wood base money data) | -0.15 | 0.60 |
| Correlation of nominal money base growth and real money base growth (using Capie-Wood base money data) (Standard Error) | (0.25) | (0.09) |
Note: Log-differences of Friedman-Schwartz's (1982) annual series on base money, the price level, and M2 are used in the calculations. Newey-West standard errors (computed with a one-lag window) appear in parentheses.
Two means of tracing interwar output behavior to monetary variables are therefore available: one focusing on inflation dynamics, the other on output behavior. The line of argument tracing from inflation behavior is:
PI1. In samples such as the postwar period that we usually associate with price stickiness and nonneutral short-run effects of monetary policy, inflation tends to lag growth in nominal spending.
PI2. This lagging relationship is present in the U.K. interwar data except for 1919-1921, for which inflation moves contemporaneously with nominal income growth.
PI3. It follows that the interwar period can be reconciled with a sticky-price account if the behavior of inflation in the early 1920s was anomalous.
The logical sequence that arises from considering output behavior is:
Y1. Output behavior in the interwar period is inversely correlated with nominal and real interest rates and positively correlated with (prior) real money growth.
Y2. These variables-real money growth, nominal interest rates, and real interest rates-are susceptible to short-run monetary policy influence if monetary policy actions that affect nominal money can be relied upon to affect real money in the same direction in the short run.
Y3. Consistent with such a short-run influence, real money growth and nominal money growth are positively correlated over 1922-1938. They are not positively correlated over 1919-1938 because of the influence of the severe 1919-1921 inflation.
Y4. It follows, again, that the interwar period can be reconciled with a sticky-price account if the behavior of inflation was aberrant in the early 1920s.
Thus, irrespective of whether one uses the inflation-based line of reasoning (the sequence PI1 to PI3 above) or the output-based line of reasoning (Y1 to Y4), it all comes down to the question of whether we consider the observations for the early 1920s inflation consistent with a sticky-price account of the business cycle. Inflation behaved violently in this period and in a manner that did not appear to reflect a delayed response to aggregate demand stimulus. But that violent behavior alone does not establish the validity of the RBC story. The RBC story requires price flexibility, i.e., it requires that the price level moves instantaneously to clear markets. A sticky-price story does not require that prices are wholly predetermined or that they are not subject to substantial fluctuations. Rather, it requires that the variability of prices that we do observe is not of a kind that automatically leads to a zero output gap every period. A monetary account of the interwar depression is compatible with sharp price movements being a source of variation in real money balances and real aggregate demand. Indeed, in a sticky-price world, such price movements might amplify rather than dilute the nonneutral effects of monetary policy.
And the events of 1920 would appear to offer a prime example of a price-level shock that amplified the nonneutrality of monetary policy. In particular, the year featured the sort of terms-of-trade shock that Laidler (1982) had in mind. Phillips (1958, p. 293) refers to 1919-1921 as featuring a roller coaster for import prices in the United Kingdom, with rapid rises in 1919-1920 and a collapse in 1921, while Rose (1983) characterizes this episode as featuring a commodity price shock that was not accommodated by monetary policy. The importance of commodity price shocks in the early 1920s is also highlighted by Loungani (1986), Barro (1986, p. 139), Plosser (1991, p. 357), and Hamilton (2011).
In a sticky-price framework, in the absence of monetary accommodation, a terms-of-trade shock should affect the price level on impact for two reasons. The first reason is that the shock reduces potential output and so reduces the amount of slack, thereby raising inflationary pressure. The second reason is that, as discussed in Friedman (1953) and Batten and Ott (1983), holding constant potential output, a terms-of-trade shock should raise the aggregate price level on impact as goods prices with a high import content respond to the shock. With domestic costs sticky, the relative price movement also initially leaves a mark on the aggregate price level. Absence of monetary accommodation should mean that real money balances fall in the wake of the shock, as they do in the early 1920s in Figure 5. Moreover, the lack of accommodation of the shock should imply that the more lasting effect of the shock is on relative prices only and not on the absolute price level: the initial effect on the price level is gradually wound back as non-import prices are pulled down-as more of agents' nominal spending is devoted to imported goods. What will be observed is a visible spike in aggregate prices at the time of the terms-of-trade shock; the downward pressure on non-import prices is spread over time and is thus less visible.
In 1920 the rise in the nominal U.K. money stock was substantial-10.4 percent in Friedman and Schwartz's data-but the rise in the U.K. price level was far greater-19.4 percent in the Friedman-Schwartz dataset. The surge in prices more than canceled the positive impact on real balances arising from the increase in nominal money. Consistent with this squeeze on real balances, Bank Rate rose. Capie and Webber's (1985, p. 499) Bank Rate table shows that Bank Rate was flat over 1918 and most of 1919 before increases in 1919Q4, 1920Q1, and 1920Q2 together took it to 7%, a total increase of 200 basis points over its World War I value. Also consistent with a tightening of money in the early interwar years is the point stressed by Lothian (1976b): while nominal money growth did not turn negative until 1920, it peaked in 1917 at 18 percent and fell in each year from 1918 to 1920, although staying at double-digit rates.45 Monetary policy was thus distinctly non-accommodative in 1918-1920 when judged in terms of money: money growth was being lowered at a time when inflation was rising sharply, so real money growth-facing downward pressure arising from both its components-experienced a major squeeze.
The combination of circumstances means that the Laidler (1982) conditions were met over this period: a terms-of-trade shock increased the price level and thereby reduced real balances; the associated downward pressure on real aggregate demand and output led to a slump in output. The increase in the nominal money stock observed over this period was overwhelmed by a price level increase that squeezed real balances and, via the repercussions for interest rates that mattered for aggregate demand, reduced aggregate output. Equivalently, the stringent actions of the monetary authorities, in raising short-term interest rates in the early 1920s, meant that the price-level rise deflated the community's level of real balances, whereas an easier interest-rate policy would have allowed the nominal money stock to expand more rapidly in response to the surge in prices. According to this interpretation, which requires short-run price stickiness, easier monetary policies would have prevented the squeeze in real money balances from occurring; policies that did not force Bank Rate up would have implied faster nominal money growth and with it higher rates of increase, in the short run, in real balances.
If this interpretation is accurate, the U.K. interwar period should be reclaimed as a celebrated case in which monetary policy was nonneutral for output behavior. This nonneutrality is reflected in several relationships, including that between real money and subsequent real output behavior, and that between interest rates and output. On the other hand, for the full interwar sample, nominal money growth and real output growth are uncorrelated, notwithstanding the likelihood that monetary policy was highly nonneutral for output behavior. The reason for this is found in the terms-of-trade shock in the early 1920s: this shock amplified the nonneutral effects of money on output, but it also temporarily broke the close short-run connection between real and nominal money balances that typically prevails in economies with sticky prices.
3.5 Postwar data after 1975
It is beyond the scope of this paper to provide a detailed examination of the money/output relationship up to the present, but some illustrations are presented here of the correlations that emerge in samples that begin after Friedman and Schwartz's sample ended in 1975. Changes in definitions of money and upheavals in the U.K. institutional framework make very broad monetary aggregates and the M1 series difficult to construct and interpret. Instead, the focus here is on two series: M0 and a compromise between M1 and M2. This compromise series, an earlier vintage of which was used in McCallum and Nelson (2011), uses M1 data for 1974-1982 inclusive,46 and is thereafter spliced into a series that the Bank of England designates Retail M4. This compromise definition is driven by the criterion that a monetary series should be broad enough to take into account the fact that M1 and non-M1 household deposits became more alike in the 1980s, yet narrow enough to omit wholesale deposits, which M2-style definitions of money traditionally exclude.
Results for four post-1975 samples are considered: 1976-2005 (the longest sample for which both monetary series are available), 1976-2010 (the period for which the deposit-inclusive money series is available), 1981-2005 (the period covering the final 25 years for which the M0 series is available), and 1986-2010 (the final 25 years of the sample). The 1976-2005 period, featuring considerable financial innovation, raises challenges for the interpretation of deposit-inclusive monetary aggregates in the United Kingdom.47 Though the choice of the M1/M2 compromise measure of money chosen here is designed to avoid the worst of the measurement problems, it by no means surmounts all of them. The 1976-2005 and 1981-2005 correlations are low and insignificant. On the other hand, the recent U.K. recession, in which negative output growth was accompanied by weak money growth, seems to have pushed up the signal-to-noise ratio in the monetary aggregate used here. Thus the 1976-2010 and 1986-2010 correlations are edging toward significance.48
The monetary base was less susceptible than the broader aggregates to the distortions resulting from financial changes in the 1970s and 1980s, as Lothian (1976a) and Darby and Lothian (1983) emphasize. Table 11 reports monetary base growth/output growth correlations for the full post-1975 sample for which the M0 series is available, namely 1976-2005. The correlation is only 0.18. But here effects of the kind mentioned earlier in connection with Lucas' (1996) analysis seem to be pressing down the correlations. A step-down in the mean of base money growth in the early 1980s-emphasized in many accounts of the Thatcher disinflation49-blots out the cyclical relationship between money growth and output growth. One reflection of this is that, though individual correlations between output growth and current and prior money growth are low, output growth is highly correlated with the change in base growth over 1976-2005. Moreover, the quarter-century starting in 1981 features a strong base money/output correlation.
Another dimension of the Lucas (1996) point emerges if the 1986-2010 period is examined in more detail and the correlations between output and M2 growth for that period are calculated. Figure 6 plots a scatter of the growth rates of deposit-inclusive money (M2) and output growth for 1986-2010. There is a trace of a positive correlation in 1986-2010; hence the correlation of 0.29 for that sample. It is clear that major consecutive departures from the scatter are the years 1988 to 1991. These years are associated with considerably higher inflation than any year in either the 1986-1987 or 1992-2010 periods. This isolated period of elevated post-1985 inflation
| k=0 | k=1 | k=0 | k=1 | |
| 1976-2010 | - | - | 0.31 | 0.10 |
| 1976-2010 (Standard Error) | - | - | (0.21) | (0.21) |
| 1976-2005 | 0.18 | -0.21 | 0.17 | -0.06 |
| 1976-2005 (Standard Error) | (0.26) | (0.26) | (0.19) | (0.17) |
| 1981-2005 | 0.53 | -0.06 | 0.03 | -0.04 |
| 1981-2005 (Standard Error) | (0.22) | (0.33) | (0.21) | (0.21) |
| 1986-2010 | - | - | 0.29 | 0.05 |
| 1986-2010 (Standard Error) | - | - | (0.27) | (0.32) |
Source: U.K. Office for National Statistics for output (real GDP) data; money data is M2 series in Bank of England online database.
carries with it the implication that, compared with surrounding years, any given setting of nominal money growth meant lower real money growth, and therefore less downward pressure on yields and less impetus to output growth. If the correlation is recomputed allowing for theyears 1988-1991 to have a separate intercept from that common to 1986-1987 and 1992-2010, the money growth/output correlation rises from 0.29 to 0.49.50 This partial correlation is 0.41 if computed on data to 2008, underscoring the impact of the recent recession in bringing out the positive money growth/output growth relationship.
4 Conclusion
The observation that money and output are correlated over the business cycle was instrumental in leading economists to emphasize monetary policy in their study of stabilization policy and in their specification of macroeconomic models. The United Kingdom evidence provided some challenges to this perspective, with the money/output correlation seemingly absent and even the
interwar period-which is often cited as a case study in demonstrating the importance of monetary policy actions for short-run output behavior-appears to generate patterns of real and nominal interaction that supported stories based on instantaneous neutrality of money. The present paper reexamined the United Kingdom evidence since the 1870s. Examination of the 1873-1975 period covered by Friedman and Schwartz (1982) as well as the 35 years of data after 1975 led to the uncovering of a familiar positive money/output correlation. This correlation had been obscured by U.K. historical events-notably a terms-of-trade shock in the early 1920s and the industrial turmoil of 1974. Once these events are isolated, the positive money/output correlation that tends to emerge from short-run monetary neutrality can be discerned from U.K. historical data.
The money/output correlation that has been an important basis for researchers' and policymakers' thinking about monetary policy is thus confirmed for the United Kingdom. This finding supports the notion, embedded in many narrative accounts, that monetary policy actions have had a decisive effect on U.K. cyclical behavior on many occasions-most notably between the two world wars.
This interpretation still leaves an important role for real factors-i.e., private sector shocks and propagation mechanisms, and government policies other than monetary policy-in generating high unemployment and output weakness during the interwar period. But the return of monetary policy to center stage in thinking about U.K. cyclical behavior puts the role of these nonmonetary factors into their proper perspective. In particular, real shocks can matter for output because monetary policy responses may magnify the consequences for output of those shocks. For the early 1920s, an important case in point appears to be the lack of monetary accommodation of commodity price shocks; the nonaccommodative policy apparently did not prevent the shocks from having a strong impact effect on inflation, but it promoted a squeeze in real money balances and a rise in interest rates that worsened the initial output response to the commodity shocks and fostered deflation in subsequent years.
In addition, once monetary policy has permitted a decline in real and nominal aggregate demand, factors other than monetary policy can make the output and employment consequences worse and longer-lasting. In the case of the U.K. interwar period, Benjamin and Kochin (1979), in an account endorsed by Friedman (1997, p. 19), see monetary policy as having generated the interwar output contraction in the United Kingdom, but argue that the high unemployment prompted by the output contraction was perpetuated by the U.K. government's generous unemployment compensation system. Such an account is consistent with the stress in this paper on monetary policy's importance. Thus, while this paper reaffirms the money/output correlation, that finding still leaves a prominent place for real factors as a source of the fluctuations and persistence of output and employment.
References
Allsopp, Christopher, Amit Kara, and Edward Nelson (2006). "United Kingdom Inflation Targeting and the Exchange Rate," Economic Journal, Vol. 116(512), F232-F244.
Backus, David K., and Patrick J. Kehoe (1992). "International Evidence on the Historical Properties of Business Cycles," American Economic Review, Vol. 82(4), 864-888.
Ball, R.J. (1982). Money and Employment. London: Macmillan.
Bank of England (2009). The Role of Macroprudential Policy: A Discussion Paper. London: Bank of England.
Barro, Robert J. (1986). "Comment on `Do Equilibrium Business Cycle Theories Explain Postwar U.S. Business Cycles?,"' NBER Macroeconomics Annual, Vol. 1(1), 135-139.
Batchelor, R.A. (1987). "Monetary Indicators and Operating Targets: Some Recent Issues in the U.K." In P. Minford (ed.), Monetarism and Macro-Economics. London: Institute of Economic Affairs. 55-82.
Batten, Dallas S., and Mack Ott (1983). "Five Common Myths About Floating Exchange Rates," Federal Reserve Bank of St. Louis Review, Vol. 67(9), 5-15.
Benjamin, Daniel K., and Levis A. Kochin (1979). "Searching for an Explanation of Unemployment in Interwar Britain," Journal of Political Economy, Vol. 87(3), 441-478.
Bernanke, Ben S. (1986). "Alternative Explanations of the Money-Income Correlation," Carnegie-Rochester Conference Series on Public Policy, Vol. 25(1), 49-99.
Bernanke, Ben S., and Harold James (1991). "The Gold Standard, Deflation, and Financial Crisis in the Great Depression: An International Comparison." In R.G. Hubbard (ed.), Financial Markets and Financial Crises. Chicago: University of Chicago Press for NBER. 33-68.
Bernanke, Ben S., Thomas Laubach, Frederic S. Mishkin, and Adam S. Posen (1999). Inflation Targeting: Lessons from the International Experience. Princeton, N.J.: Princeton University Press.
Bernanke, Ben S., and James L. Powell (1986). "The Cyclical Behavior of Industrial Labor Markets: A Comparison of the Prewar and Postwar Eras." In R.J. Gordon (ed.), The American Business Cycle: Continuity and Change. Chicago: University of Chicago Press for NBER. 583-621.
Birchenhall, Chris R., Denise R. Osborn, and Marianne Senser (2000). "Predicting U.K.
Business Cycle Regimes." CHBC Discussion Paper Series No. 002, University of Manchester.
Bordo, Michael D., and Anna J. Schwartz (1977). "Issues in Monetary Economics and Their Impact on Research in Economic History." In R.E. Gallman (ed.), Recent Developments in the Study of Business and Economic History: Essays in Memory of Herman E. Krooss. Greenwich, CT: JAI Press. 81-129.
Brown, A. J., and Jane Darby (1985). World Inflation Since 1950: An International Comparative Study. Cambridge, U.K.: Cambridge University Press.
Budd, Alan, Sean Holly, Andrew Longbottom, and David Smith (1984). "Does Monetarism Fit the U.K. Facts?" In B. Griffiths and G.E. Wood (eds.), Monetarism in the United Kingdom. New York: St. Martin's Press. 75-119.
Burns, Arthur F., and Wesley C. Mitchell (1946). Measuring Business Cycles. New York: NBER.
Cairncross, Sir Alec (1996). Managing the British Economy in the 1960s. London: Macmillan.
Campos, Julia, Neil R. Ericsson, and David F. Hendry (1990). "An Analogue Model of Phase-Averaging Procedures," Journal of Econometrics, Vol. 43(3), 275-292.
Capie, Forrest H., and Terence C. Mills (1991). "Money and Business Cycles in the U.S. and U.K., 1870 to 1913," Manchester School of Economic and Social Studies, Vol. 59 (Supplement), 38-56.
Capie, Forrest H., Terence C. Mills and Geoffrey E. Wood (1991). "Money, Interest Rates and the Great Depression: Britain from 1870 to 1913." In J. Foreman-Peck (ed.), New Perspectives on the Late Victorian Economy: Essays in Quantitative Economic History, 1860-1914. Cambridge, U.K.: Cambridge University Press. 251-284.
Capie, Forrest H., and Alan Webber (1985). A Monetary History of the United Kingdom, 1870-1982, Volume 1: Data, Sources, Methods. London: George Allen and Unwin.
Capie, Forrest H., and Geoffrey E. Wood (1989). "Anna Schwartz's Perspective on British Economic History." In M.D. Bordo (ed.), Money, History, and International Finance: Essays in Honor of Anna Schwartz. Chicago: University of Chicago Press for NBER. 79-104.
Cobham, David (1980). "The Influence of the United Kingdom Public Sector Deficit on Its Money Stock, 1963-76: Some Comments," Bulletin of Economic Research, Vol. 32(2), 121-129.
Cole, Harold L., and Lee E. Ohanian (2002). "The Great U.K. Depression: A Puzzle and Possible Resolution," Review of Economic Dynamics, Vol. 5(1), 19-44.
Crosland, A.R. (1956). The Future of Socialism. London: Macmillan.
Dale, Spencer (2009). "Inflation Targeting: Learning the Lessons from the Financial Crisis." Remarks at the Society of Business Economists' Annual Conference, London, June 23.
Darby, Michael R., and James R. Lothian (1983). " British Economic Policy under Margaret Thatcher: A Midterm Examination," Carnegie-Rochester Conference Series on Public Policy, Vol. 18(1), 157-207.
Darby, Michael R., and James R. Lothian (1989). "The International Transmission of Inflation Afloat." In M.D. Bordo (ed.), Money, History, and International Finance: Essays in Honor of Anna J. Schwartz. Chicago: University of Chicago Press for NBER. 203-240.
Dimsdale, N.H. (1981). "British Monetary Policy and the Exchange Rate 1920-1938," Oxford Economic Papers, Vol. 33 (Supplement), 306-349.
Dimsdale, N.H., S.J. Nickell, and N. Horsewood (1989). "Real Wages and Unemployment in Britain in the 1930s," Economic Journal, Vol. 99(396), 271-292.
Dwyer, Gerald P. (1985). "Money, Income and Prices in the United Kingdom: 1870-1913," Economic Inquiry, Vol. 23(3), 415-435.
Eichengreen, Barry (1983). "The Causes of British Business Cycles, 1833-1913," Journal of European Economic History, Vol. 12(1), 145-161.
Erceg, Christopher J., Dale W. Henderson, and Andrew T. Levin (2000). "Optimal Monetary. Policy with Staggered Wage and Price Contracts," Journal of Monetary Economics, Vol. 46(2), 281-313.
Feinstein, C.H. (1972). National Income, Expenditure and Output of the United Kingdom, 1855-1965. Cambridge, U.K.: Cambridge University Press.
Francis, Neville R., Michael T. Owyang, and Athena T. Theodorou (2005). "What Explains the Varying Monetary Response to Technology Shocks in G-7 Countries?," International Journal of Central Banking, Vol. 1(3), 33-71.
Friedman, Milton (1953). "The Case for Flexible Exchange Rates." In M. Friedman, Essays in Positive Economics. Chicago: University of Chicago Press. 157-203.
Friedman, Milton. (1970). "The Counter-Revolution in Monetary Theory." Institute of Economic Affairs Occasional Paper No. 33. Reprinted in M. Friedman, Monetarist Economics. CityplaceOxford, country-regionU.K.: Basil Blackwell, 1991. 1-20.
Friedman, Milton (1975). "Henry, Stick to Politics," Newsweek, March 31, p. 64.
Friedman, Milton (1980). "Memorandum: Response to Questionnaire on Monetary Policy, dateYear1980Day11Month6June 11, 1980." In Treasury and Civil Service Committee, Memoranda on Monetary Policy. London: HMSO. 55-61.
Friedman , Milton (1985). "How to Give Monetarism a Bad Name." In J.K. Galbraith and D.C. Roberts (eds.) Monetarism, Inflation, and the Federal Reserve: Essays Prepared for the Use of the Joint Economic Committee, Congress of the United States. Washington, D.C.: U.S. Government Printing Office. 51-61.
Friedman, Milton (1997). "John Maynard Keynes," Federal Reserve Bank of Richmond Economic Quarterly, Vol. 83(2), 1-22.
Friedman, Milton, and Anna J. Schwartz (1963a). A Monetary History of the United States, 1867-1960. Princeton, N.J.: Princeton University Press.
Friedman, Milton, and Anna J. Schwartz (1963b). "Money and Business Cycles," Review of Economics and Statistics, Vol. 45(1), 32-64.
Friedman, Milton, and Anna J. Schwartz (1970). Monetary Statistics of the United States. New York: Columbia University Press.
Friedman, Milton, and Anna J. Schwartz (1982). Monetary Trends in the placecountry-regionUnited States and the placecountry-regionUnited Kingdom: Their Relation to Income, Prices, and Interest Rates, 1867-1975. placeCityChicago: PlaceTypeplaceUniversity of PlaceNameChicago Press.
Gambs, Carl M. (1980). "Federal Reserve Intermediate Targets: Money or the Monetary Base?," Federal Reserve Bank of Kansas City Economic Review, Vol. 65(1), 3-15.
Goodhart, Charles A.E. (1982). "Monetary Trends in the United States and the United Kingdom: A British Review," Journal of Economic Literature, Vol. 20(4), 1540-1551.
Goodhart, Charles A.E. (1989). "The Conduct of Monetary Policy," Economic Journal, Vol. 99(396), 293-346.
Goodhart, Charles A.E. (1999). "Monetary Policy and Debt Management in the United Kingdom: Some Historical Viewpoints." In K.A. Chrystal (ed.), Government Debt Structure and Monetary Conditions. London: Bank of England. 43-97.
Gordon, Robert J. (1982). "Price Inertia and Policy Ineffectiveness in the United States, 1890-1980," Journal of Political Economy, Vol. 90(6), 1087-1117.
Hall, Robert E., and John B. Taylor (1997). Macroeconomics-Fifth Edition. New York: W.W. Norton.
Hamilton, James D. (2011). "Historical Oil Shocks." Manuscript, University of California, San Diego. February.
Hartlech, Lord (1955). "1954 a Good Year for Britain," Financial Times (London), January 25, 1955, p. 2.
Hendry, David F., and Neil R. Ericsson (1986). "Prolegomenon to a Reconstruction: Further Econometric Appraisal of Monetary Trends in... the United Kingdom by Milton Friedman and Anna J. Schwartz." Manuscript, Federal Reserve Board.
Hendry, David F., and Neil R. Ericsson (1991a). "An Econometric Analysis of U.K. Money Demand in Monetary Trends in the United States and the United Kingdom by Milton Friedman and Anna J. Schwartz," American Economic Review, Vol. 81(1), 8-38.
Hendry, David F., and Neil R. Ericsson (1991b). "Modeling the Demand for Narrow Money in the United Kingdom and the United States," European Economic Review Vol. 35(4), 833-886.
Hendry, David F., and Jean-Paul Richard (1983). "The Econometric Analysis of Economic Time Series," International Statistical Review, Vol. 51(2), 111-148.
Howard, David H. (1982). "The British Banking System's Demand for Cash Reserves,"
Journal of Monetary Economics,Vol. 9(1), 21-41.
Howson, Susan (1975). Domestic Monetary Management in Britain, 1919-38. Cambridge, U.K.: Cambridge University Press.
Huffman, Wallace E., and James R. Lothian (1984). "The Gold Standard and the Transmission of Business Cycles, 1833-1932." In M.D. Bordo and A.J. Schwartz (eds.), A Retrospective on the Classical Gold Standard, 1821-1931. Chicago: University of Chicago Press for NBER. 455-507.
Johnson, Harry G. (1975). "Keynes and British Economics." In M. Keynes (ed.), Essays on John Maynard Keynes. Cambridge, U.K.: Cambridge University Press. 108-122.
Jonson, Peter D. (1977). "Inflation and Growth in the United Kingdom: A Longer-Run Perspective," Journal of Monetary Economics, Vol. 3(1), 1-23.
Kareken, John, and Robert M. Solow (1963). "Lags in Fiscal and Monetary Policy: Part I, Lags in Monetary Policy." In Commission on Money and Credit (ed.), Stabilization Policies. Eaglewood Cliffs, N.J.: Prentice Hall. 14-96.
Keynes, John Maynard (1930). A Treatise on Money. New York: Harcourt Brace.
King, Robert G. (1990). "Money and Business Cycles." Manuscript, University of Rochester.
King, Robert G., and Mark W. Watson (1996). "Money, Prices, Interest Rates and the Business Cycle," Review of Economics and Statistics, Vol. 78(1), 35-53.
Kishor, N. Kundan, and Levis A. Kochin (2007). "The Success of the Fed and the Death of Monetarism," Economic Inquiry, Vol. 45(1), 56-70.
Kormendi, Roger C., and Philip G. Meguire (1984). "Cross-Regime Evidence of Macroeconomic Rationality," Journal of Political Economy, Vol. 92(5), 875-908.
Laidler, David (1982). "Friedman and Schwartz on Monetary Trends: A Review Article," Journal of International Money and Finance, Vol. 1(1), 293-305.
Laidler, David (1989). "Comment." In M.D. Bordo (ed.), Money, History, and International Finance: Essays in Honor of Anna Schwartz. Chicago: University of Chicago Press for NBER . 104-110.
Lothian, James R. (1975). "Book Review: The Growth and Role of U.K. Financial Institutions, 1880-1962, by David K. Sheppard," Journal of Money, Credit and Banking, Vol. 7(3), 401-405.
Lothian, James R. (1976a). "The Demand for High-Powered Money," American Economic Review, Vol. 66(1), 56-68.
Lothian, James R. (1976b). "Interwar Britain: A Comparison with American Experience." Manuscript, Citibank, June.
Loungani, Prakash (1986). "Oil Price Shocks and the Dispersion Hypothesis," Review of Economics and Statistics, Vol. 68(3), 536-539.
Lucas, Robert E., Jr. (1996). "Nobel Lecture: Monetary Neutrality," Journal of Political Economy, Vol. 104(4), 661-682.
Mankiw, N. Gregory (1986). "Comment on `Do Equilibrium Real Business Cycle Theories Explain Postwar U. S. Business Cycles?,"' NBER Macroeconomics Annual, Vol. 1(1), 139-145.
McCallum, Bennett T. (1989). Monetary Economics: Theory and Policy. New York: Prentice Hall.
McCallum, Bennett T., and Edward Nelson (2011). "Money and Inflation: Some Critical Issues." In B.M. Friedman and M. Woodford (eds.), Handbook of Monetary Economics, Volume 3A. Amsterdam: Elsevier/North-Holland. 97-153.
Meyer, Stephen A. (1982). "Margaret Thatcher's Economic Experiment: Are There Lessons for the Reagan Administration?," Federal Reserve Bank of Philadelphia Business Review, Vol. 66(3), 3-13.
Mills, Terence C., and Geoffrey E. Wood (1992). "Money and Interest Rates in Britain from 1870 to 1913." In S.N. Broadberry and N.F.R. Crafts (eds.), Britain in the International Economy. Cambridge, U.K.: Cambridge University Press. 199-217.
Nelson, Charles R. (1979). "Recursive Structure in U.S. Income, Prices and Output," Journal of Political Economy, Vol. 87(6), 1307-1327.
Nelson, Edward (2012). "Key Aspects of Longer-Term Asset Purchase Programs in U.K. and U.S. Monetary Policy." Manuscript, Federal Reserve Board, April.
Newey, Whitney K., and Kenneth D. West (1987). "A Simple, Positive Semidefinite, Heteroskedasticity and Autocorrelation Consistent Covariance Matrix," Econometrica, Vol. 55(3), 703-708.
Phillips, A.W. (1958). "The Relation between Unemployment and the Rate of Change of Money Wage Rates in the United Kingdom, 1861-1957," Economica, Vol. 25(100), 283-299.
Plosser, Charles I. (1991). "Money and Business Cycles: A Real Business Cycle Interpretation." In M.T. Belongia (ed.), Monetary Policy on the 75th Anniversary of the Federal Reserve System. Boston, MA: Kluwer Academic Publishers. 245-274.
Poole, William (1995). "Monetary Policy Implications of Recent Changes in the Financial Systems of the United States and Europe." In K. Sawamoto, Z. Nakajima, and H. Taguchi (eds.), Financial Stability in a Changing Environment. placeCityLondon: Macmillan. 109-143.
Ravn, Morten O. (1997). "Permanent and Transitory Shocks and the U.K. Business Cycle," Journal of Applied Econometrics, Vol. 12 (1), 27-48.
Reinhart, Carmen M., and Kenneth S. Rogoff (2009). This Time Is Different: Eight Centuries of Financial Folly. Princeton, N.J.: Princeton University Press.
Romer, David (2012). Advanced Macroeconomics, Fourth Edition. New York: McGraw Hill.
Rose, Harold (1983). "Another Look at the Interwar Period," Barclays Review, Vol. 63(1), 1-9.
Schwartz, Anna J. (1984). "Comments on the Paper by Alan Budd, Sean Holly, Andrew Longbottom and David Smith." In B. Griffiths and G.E. Wood (eds.), Monetarism in the United Kingdom. New York: St. Martin's Press. 129-136.
Sheppard, David K. (1971). The Growth and Role of U.K. Financial Institutions, 1880-1962. London: Methuen.
Stevenson, A.A., and J.A. Trevithick (1977). "The Complementarity of Monetary Policy and Prices and Incomes Policy: An Examination of Recent British Experience," Scottish Journal of Political Economy, Vol. 24(1), 19-31.
Stock, James H. (1987). "Measuring Business Cycle Time," Journal of Political Economy, Vol. 95(6), 1240-1261.
Sustek, Roman (2010). "Monetary Aggregates and the Business Cycle," Journal of Monetary Economics, Vol. 57(4), 451-465.
Tucker, Paul (2010). "Inflation, Growth and Stability: Balancing the Bank of England's Economic Priorities." Remarks at the Institute of Economic Affairs' 27th Annual Conference "The State of the Economy." London, February 23.
Vine, Brian (1980). "Yes, It Will Work If Maggie Doesn't Waver: Verdict on the Tory Strategy So Far-By the Economist Who Virtually Invented It," Daily Express (London), August 6, p. 8.
Walters, Alan A. (1970). "The Radcliffe Report-Ten Years After: A Survey of Empirical Evidence." In D.R. Croome and H.G. Johnson (eds.), Money in Britain, 1959-1969. Oxford University Press. 39-68.
Walters, Alan A. (1971). Money in Boom and Slump: An Empirical Inquiry into British Experience Since the 1880s. Second Edition. Hobart Paper No. 44. London: IEA.
Whitesell, William C., and Sean Collins (1996). "A Minor Redefinition of M2." Federal Reserve Board Finance and Economics Discussion Series Paper No. 1996-7.
Woodford, Michael (2003). Interest and Prices: Foundations of a Theory of Monetary Policy. Princeton, N.J.: Princeton University Press.
Wren-Lewis, Simon (1986). "An Econometric Model of U.K. Manufacturing Employment Using Survey Data on Expected Output," Journal of Applied Econometrics, Vol. 1(4), 297-331.