Consolidation and Merger Activity in the United States Banking Industry from 2000 through 2010
Keywords: Banking, mergers, antitrust
Abstract:
1 Introduction
Merger activity and overall consolidation are of particular interest in the U.S. banking industry. Since 1980, the structure of the U.S. banking industry has changed considerably, with over 10,000 mergers involving more than $7 trillion in acquired assets taking place. Furthermore, the number of institutions has declined dramatically over this period, and the concentration of assets held by the largest institutions has increased. There were 19,069 banks and thrifts operating in the U.S. in 1980 and 7,011 in 2010, a decline of over 60 percent. In 1980, the 10 largest banking organizations held only 13.5 percent of banking assets, increasing to 36 percent by 2000.2 By 2010, the 10 largest organizations held approximately 50 percent of banking assets. This paper updates previous work on bank merger trends in the U.S. and considers bank merger activity from 2000 through 2010.
As consolidation in the banking industry continues, banking antitrust policy plays a considerable role in shaping how the industry changes. Banking differs from most other industries because mergers and acquisitions must be approved by the relevant bank regulatory authority.3 The Bank Holding Company Act of 1956 and the Bank Merger Act of 1966 (and amendments) both define what types of bank transactions require regulatory approval. Along with the financial institution regulators, the Department of Justice (DOJ) also analyzes bank merger transactions for potential antitrust concerns. Unlike other regulators, however, the DOJ cannot deny a merger application; rather, they have to file an injunction to block or undo a merger.
The banking industry has undergone significant regulatory changes in the past 15 years. These regulatory changes have had significant effects on competition and structure, with some changes acting as the impetus for recent merger waves. For example, the Riegle-Neal Interstate Banking and Branching Efficiency Act of 1994 allowed branch banking beyond one state and throughout the United States, and the Gramm-Leach-Bliley Act of 1999 (Financial Services Modernization Act) allowed banks to enter other financial markets and provide additional financial services. Both of these laws are potential causes for the increase in bank mergers. With such regulatory changes and the overall changes in the bank industry structure, banking has moved from a fragmented industry with banks operating only in individual states to a more unified industry, dominated by banks operating in large regions of the country.
Several previous studies discuss bank merger activity over the past 50 years. Three studies by Rhoades (1985, 1996, 2000) consider bank merger activity from 1960 through 1998, and Pilloff (2004) considers merger activity from 1994 through 2003.4 Wheelock (2011) analyzes merger activity during the financial crisis from 2007 through 2010. These papers differ in their sources for bank merger data and how they count bank mergers. The next section will discuss these differences in greater detail.
Research on the motivations for and causes and effects of bank mergers is vast and covers numerous facets of the topic. The data sources employed in this literature vary tremendously as well. Most studies of bank mergers in the United States use regulatory documents, stock price data, and National Information Center (NIC) data, in addition to other sources. These data sources vary in their coverage of bank mergers.5 This study will not evaluate the quality of the different data sets or evaluate the literature on bank mergers; instead, it will describe a single comprehensive data set of bank merger transactions.
Several survey articles provide overviews of the research on bank mergers: They include Berger, Demsetz, and Strahan (1999); Amel, Barnes, Panetta, and Salleo (2004); and DeYoung, Evanoff, and Molyneux (2009).
This paper is organized in the following manner. In Section I, the data construction is discussed, and the methodology is compared to that of others. In Section II, overall merger trends and consolidation are described on a national level. In Section III, local market trends are described. Section IV concludes.
2 Merger Data
This study only covers transactions that involve commercial banks, savings banks, savings and loan associations, bank holding companies, thrift holding companies, or foreign bank organizations. Bank holding companies, thrift holding companies, and foreign banking organizations are firms that own banks or thrifts along with other subsidiaries.6 Bank holding companies are regulated by the Federal Reserve, while thrift holding companies were regulated by the Office of Thrift Supervision (OTS) during the time period under study. Thrift holding companies are now regulated by the Federal Reserve.7
Previous studies have measured and defined mergers differently. Rhoades (1985, 1996, 2000) considered only transactions where one banking organization purchases at least a 25 percent ownership share of the target. In his data, the acquirer is an active operating entity (for at least one year) rather than a de novo or non-operating bank. Both parties are bank holding companies or commercial banks, and both are either U.S. domestic banks or are owned by one. The target is not failing or likely to fail as judged by the regulator. Mergers are recorded in the year they are approved by the regulator. When multiple firms are acquiring a target entity, Rhoades treats the largest institution as the acquiring firm. Finally, when a multibank holding company is acquired, each acquired commercial bank in that holding company is treated as a separate deal.
Rhoades obtained his data from the merger filings with the various bank regulators. He uses documents from the Office of the Comptroller of the Currency (OCC), the Federal Deposit Insurance Corporation (FDIC), the OTS, and the Federal Reserve Board (FRB) as a basis to find merger transactions. His data only measure transactions filed with the OCC, the FDIC, the OTS, or the FRB and do not include transactions that did not require federal bank regulatory approval.8
Pilloff (2004) measures mergers in a slightly different manner from Rhoades. He uses a private proprietary data source, SNL Financial (www.snl.com), to identify mergers. SNL Financial records bank mergers from several sources including regulator publications and the popular press. Pilloff (2004) supplements and verifies the SNL financial data using regulatory data from the NIC. Pilloff's analysis defined a bank merger as a transaction where both the acquirer and target institutions (or one of their banking subsidiaries) is a commercial bank, savings bank, savings and loan, or industrial bank chartered in the United States. Acquisitions of banks by private investors or nonbanking firms and newly formed bank holding companies with no active bank subsidiaries are not counted as mergers. Additionally, acquisitions of multibank holding companies are counted as a single merger rather than as multiple mergers. Unlike Rhoades, Pilloff uses the actual date of consummation as noted by SNL as the date of the merger rather than the date of approval. Pilloff also requires that majority ownership be acquired for a merger. In other words, a high holding company must own at least 50 percent of any subsidiaries. His data also do not include failed or failing institution transactions.
Unlike Pilloff (though somewhat like Rhoades), Wheelock (2011) focuses on bank mergers where the acquiring institution absorbs and rebrands the target institution. Acquisitions by bank holding companies where the target institution becomes a subsidiary and retains its own name are not counted as mergers in his analysis. For some mergers, this methodology does not result in any difference, but for a merger involving a bank holding company, the results could substantially differ. For example in Wheelock (2011), of the largest transactions that took place during the financial crisis, two transactions involved institutions owned by the same bank holding company:9 the Wachovia Bank, N.A., merger with Wachovia Mortgage, FSB, and the Fifth Third Bank (Cincinnati) merger with Fifth Third Bank (Grand Rapids), which occurred about eight years after they become subsidiaries of the same bank holding company.10 Like Rhoades' methodology, Wheelock's methodology could either potentially result in multiple transactions when only a single bank holding company is acquiring another bank holding company or potentially have an inappropriate transaction date.
We do not use Wheelock's definition for three reasons. First, antitrust analysis scrutiny from either banking regulators or competition authorities occurs with the change in control of an institution. Institutions with the same high holder are unlikely to be competing. A change in control, however, changes incentives, so economic analysis is warranted at that point. Second, the timing of a transaction almost always differs for the bank holding company acquisition than for the subsequent merger. The economic motivations for both transactions may differ substantially because of the difference in timing and structure of the deal. Sometimes these transactions could be years apart. Finally, as in Rhoades's methodology, transactions between bank holding companies could count as multiple smaller transactions. These types of transactions would overstate the number of transactions that took place and understate the size of certain transactions. For example, in Wheelock's paper, the Bank of America merger with two LaSalle Bank subsidiaries is counted as two transactions that occurred on the same date.
While this study takes a slightly different approach than Pilloff and Rhoades, our methodology is most similar to Pilloff's method. Like Pilloff, we use data from SNL Financial to identify bank mergers and use NIC data to verify transactions. Additionally, we consider all transactions involving commercial banks, savings banks, savings and loan associations, industrial banks, thrift holding companies, and bank holding companies as the acquiring and the target institutions. We also use the date of consummation rather than the date of approval as the date the merger occurs. Unlike Pilloff's methodology, which requires a firm to obtain a 50 percent controlling interest, this study includes all transactions where the acquiring institution obtains a controlling interest of at least 25 percent.11 This percentage was chosen because the Bank Holding Company Act of 1956, which is the basis for most antitrust banking authority, defines control at 25 percent ownership or above, and these types of transactions have to be approved by bank regulators.12 This criterion is used for bank-to-bank transactions and determines the high holding institution(s) of the acquirer and the target. Some institutions can have multiple high holders, and all high holders are checked to determine if the transaction involves the same high holder for acquirer and target. A transaction is not counted as a merger if the high holder for the acquirer is also a high holder for the target.
Unlike previous studies, failed or failing institutions are included in the data.13 It is important to include these transactions because they undergo the same application and approval process as any other transaction (albeit with some modifications if necessary).14 While the reasons for merging are potentially different, the application is evaluated and could result in a denial. Rhoades's and Pilloff's methods of counting mergers would result in far fewer mergers from 2008 to 2010 because during these years a large number of failure-based mergers occurred.15
The data in this study also only identify the high holder of an institution as the acquiring firm, without any information about intermediate holding companies. The high holder of an institution is defined as the top-most firm that owns a controlling interest of the depository and all mid-tier holding companies. The majority of institutions are either independent with no high holder or an institution with a single high holder.16 While this data construction does not reveal details about transactions, such as which subsidiary is purchasing the target institution, it does identify the merging parties. The main drawback is that we cannot directly identify the regulator that approved the transaction, as subsidiary firms may have different regulators.17
Once acquirer and target institutions are identified, financial information on all merger participants is collected from the Consolidated Reports of Condition and Income (Call Report), Thrift Financial Reports, and the Summary of Deposits and Branch Office Survey.18 We use the December Call Report and Thrift Financial Report for bank-level financial data before the transaction occurred. Market-level data are derived from the preceding Summary of Deposits data (the previous June 30). While this method does not give the most up-to-date data on the institutions, it allows for a balanced comparison of all merger participants in a given year. This method also mitigates some of the dating issues with merger transactions.
For many of the transactions, most of the differences in criteria for defining mergers and acquisitions do not matter, as most transactions involve a merger of two institutions or the acquisition of a single institution by a holding company. However, a handful of transactions are more complicated and the differences in methodology become more apparent with such transactions. The biggest difference occurs with the inclusion of failed or failing institutions in the years 2008 to 2010. Not including these observations in the data has a significant effect on the observed number of transactions. However, it is important to note that these types of transactions would not have had a major effect on the Pilloff (2004) results because not many banks failed during his reference period.19
3 National Merger Trends and Consolidation
This Section describes the merger activity and consolidation on a national level. The number and merger characteristics are compared on an annual basis. Overall national consolidation is described and the largest deals are shown.
Mergers by Year and Size
Table 1 shows the number of mergers for each year as well as the mean, median, total assets, and the percent of industry assets of the target institutions and the percent of industry assets acquired in a merger for each year from 2000 through 2010. The table also shows mean, median, total target deposits, and total offices for the targets. From 2000 through 2010, 2,403 mergers occurred, involving the acquisition of $4.1 trillion in assets, $2.59 trillion in deposits, and approximately 41,615 offices. At least 200 mergers occurred annually, with the exception of 2008 through 2010, which saw slight declines with 195, 158, and 180 mergers, respectively. On average, approximately 218 mergers took place each year with a high of 259 in 2004 and a low of 158 in 2009. Prior to 2000, merger activity was much greater, with over 440 mergers, on average, from 1994 to 1999.20
The declining well-being of the financial sector starting in August 2007 contributed to the observed drop in the number of merger transactions. The types of transactions changed significantly in these years. The years 2008 and 2009 witnessed a significant increase in the number of transaction that involved failed or failing institutions, as well as a dramatic decrease in the number of standard acquisitions.21 Increased uncertainty in bank loan portfolios and the significant drop in bank stock prices are two factors that may have led to the decline in non-failing mergers. Potential bank acquirers could not reliably ascertain the quality and value of target bank portfolios. Furthermore, publically traded bank stocks fell during this period, making stock-based transactions more difficult to complete.22
Trends in average and median merger size, as well as percent of industry involved in transactions, were similar with respect to assets, deposits, and number of offices. While average asset and deposits vary significantly from year to year depending on whether very large mergers were consummated, median assets and deposits for the targets were very stable, remaining in a range of $109 million to $196 million for assets and $88 million to $167 million for deposits. The median number of target offices fluctuated between 3 and 4. As shown in subsequent tables, the majority of mergers involve very small depository institutions; in most years, the total percent of industry assets, deposits, or offices acquired were well below 5 percent of industry totals.
In particular, three years were remarkable in the volume of merger activity: 2001, 2004, and 2008. In each of these years, the averages and percent industry in each category were well above levels in other years. Average target assets were $1.4 billion, $3.2 billion, and $7.0 billion, respectively. Average target deposits were $935 million, $1.9 billion, and $4.4 billion, respectively. The percent of industry assets or deposits was around 5 percent in 2001, almost 9 percent in 2004, and almost 12 percent in 2008. Mean numbers of offices acquired in these years were 20, 33, and 50, respectively. All of these averages were well above those in other years and above median values. In each of these years, several large mergers skewed the numbers. As we will see in Table 7, the fifth and sixth largest mergers occurred in 2001, the second and fourth largest mergers happened in 2004, and the largest and third largest mergers of the past decade occurred in 2008. In fact, 18 of the top 30 mergers in the past decade occurred in these three years.
Tables 2.1, 2.2, and 2.3 describe the mean and median assets of the acquirer and target institutions as well as the ratio of the acquirer to the target for each category. Mean acquirer assets ranged from a low of $9.1 billion in 2003 to a high of $29 billion in 2008. Mean target assets were considerably lower, ranging from $450 million in 2003 to $7 billion in 2008. The ratio of target assets to acquirer assets ranged from 23 percent to 37 percent from 2000 through 2008. In 2009 and 2010, the ratio of target assets to acquirer assets was much larger at 114 percent and 95 percent, respectively. In each of these years, several deals occurred where the target was comparable to or larger than the acquirer. Median values did not change appreciably over the sample for both acquirer and target. Median acquirer assets ranged from $599 million in 2008 to $1.6 billion in 2010. Median target assets ranged from $109 million in 2003 to $196 million in 2008. The ratio of median acquirer assets to median target assets ranged from 13 percent in 2003 and 2005 to 24 percent in 2009. Acquired deposits and acquired offices show the same basic trends.
Consolidation in the U.S. Banking Industry
Concentration of both assets and deposits for the top 10 banking and thrift organizations increased considerably over the past decade. Table 3 shows concentrations for the top 10, top 50, and top 100 banking organizations using banking assets and deposits. The share of deposits held by the top 10 firms increased from 30 percent in 2000 to 46 percent in 2010, and share of industry assets held by the top 10 firms increased from 36 percent in 2000 to 50 percent in 2010. Concentration increases for the top 50 and top 100 banking organizations were much less dramatic. Top 50 deposit concentration increased from 55 percent in 2000 to 67 percent in 2010 and top 100 deposit concentration increased from 64 percent in 2000 to 73 percent in 2010. Asset concentration followed a similar trend, though it starts and ends at higher levels. The increase in both asset and deposit concentrations for the top 10 firms was almost twice as much as the increase for the top 100 organizations. About 66 percent of the increase in asset share and 75 percent of the increase in deposit share for the top 10 institutions is directly attributable to merger activity.23
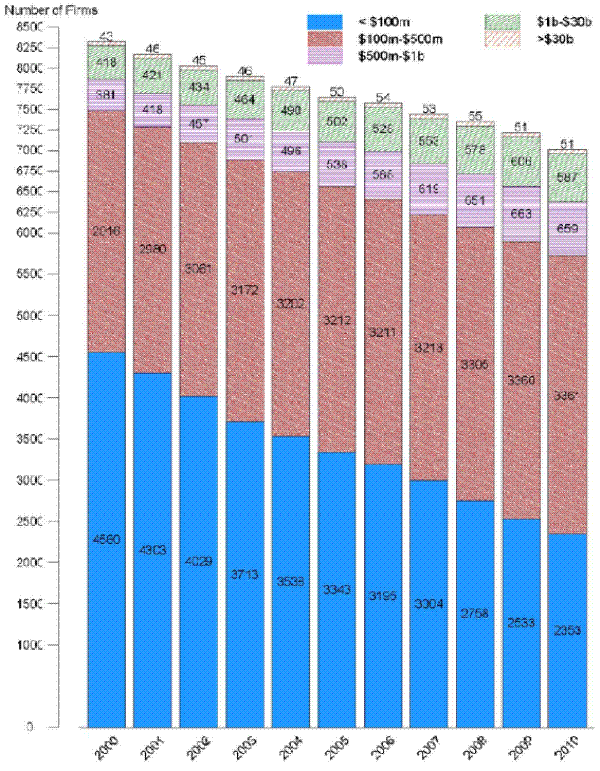
Chart 1 shows the number of banks for different asset sizes from 2000 through 2010. Asset size categories for this chart are banks with less than $100 million, $100 to 500 million, $500 million to $1 billion, $1 billion to $30 billion, and greater than $30 billion in assets. Most of the change in the number of banks occurs for banks with less than $100 million in assets, whose number declines from 4,560 institutions to 2,353. The number of banks with assets from $100 to $500 million increased from 2,916 to 3,361, and the number of banks with assets from $500 million to $1 billion increased from 381 to 659. The number of banks with assets from $1 billion to $30 billion increased from 418 to 587 institutions. The number of banks with more than $30 billion grew from 43 to 51. The industry now has fewer small banks in 2010 than in 2000, with a reduction in the tiniest banks of almost 50 percent.
Despite a reduction in the number of banks and thrifts, the number of branches grew steadily over the period studied. In 2010, there were 98,939 branches as compared with 84,871 branches in 2000. The expansion in the number of branches offers evidence of continued demand for physical branch presence despite the technological advances of the past decade. Part of the increase in total branches can be explained by innovations in branch location. For example, branches located inside retail stores, so-called in-store branches, have become very popular and have steadily increased over the past decade. In-store branch openings account for over 30 percent of new branch openings from 2000 through 2010.
Tables 4 and 5 describe the types of transactions among the different charter types. Table 4 shows the number of mergers, as well as the mean, median, and total amount of assets, deposits, and offices for transactions involving different types of banking institutions. In these Tables, banks are commercial banks, and thrifts include savings and loans associations, savings banks, and industrial banks. Bank-to-bank transactions accounted for almost 78 percent of deals. Bank acquisition of thrifts account for almost 10 percent of deals, and thrift acquisitions (of either bank or thrift) accounted for another 12 percent of deals. Bank acquisitions of other banks represent the largest portion of acquired assets, deposits, and offices: 74 percent of target assets, 76 percent of target deposits, and 76 percent of target offices. Median assets and deposits for bank acquisitions of other banks were $125 million and $107 million, respectively. The median assets and deposits of thrifts acquired by banks were higher at $227 million and $167 million, respectively.
Table 5 describes mergers by depository institution type from 2000 through 2010. Bank acquisitions of other banks averaged 170 per year, whereas bank-to-thrift and thrift-to-thrift mergers averaged about 22 and 10 per year, respectively. The preponderance of commercial bank mergers reflects the relatively large number of commercial banks.24
Merger Activity by Institution Size
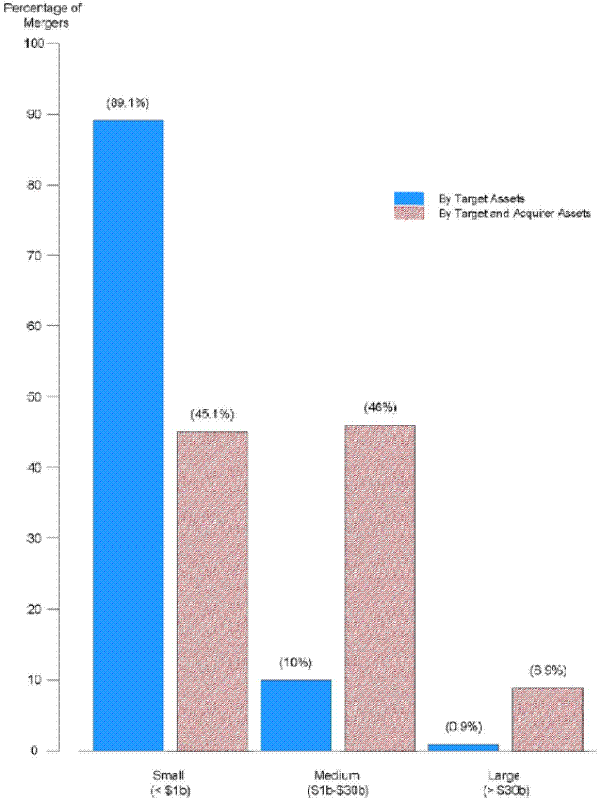
Chart 2 shows mergers by the size of the acquirer and target, defined as large (more than $30 billion in assets), medium ($1 billion to $30 billion), and small (less than $1 billion).25 The first blue columns represent deals where the target assets measure the size of the deal. The second red column measures deal size by combined assets of target and acquirer. In terms of target assets, the greatest share of merger activity involved the acquisition of small institutions by either a small or medium-sized institution. These two categories accounted for over 89 percent of all mergers between 2000 and 2010. Transactions involving the largest institutions accounted for less than 1 percent of all transactions but over 50 percent of acquired assets in most years. In 2008, acquisitions by large institutions accounted for over 95 percent of acquired assets. This finding is not surprising as the largest and third largest mergers of the past decade occurred in 2008.
Largest Mergers in Recent Years
Table 6 displays the top 30 transactions from 2000 through 2010, ranked by acquired deposits.26 The largest transaction to date occurred during the financial crisis: Wells Fargo's acquisition of Wachovia. Four of the top 10 transactions were directly related to the financial crisis; in each of these transactions, the acquired institutions were in serious financial distress, though only one transaction involved FDIC support.27
The Riegle-Neal Act prohibits the Federal Reserve from approving any merger application where the transaction would result in the acquirer controlling more than 10 percent of the total deposits of insured depository institutions in the United States.28 In recent years, the 10 percent national deposit cap has become more relevant as several institutions approached or exceeded the cap. The Dodd-Frank Act introduced a new 10 percent liability cap in addition to the 10 percent deposit cap. The effects of the new cap on merger activity are unknown at this point.29
Of the top 30 merger transactions, only 2 were bound by or came close to the 10 percent national deposit cap. One transaction involved Bank of America, which has been consistently at or above the cap during the past 5 years, and the other transaction involved two of the top five institutions-Wells Fargo and Wachovia-for which the pro forma national deposit share reached 9.97 percent. Currently, three institutions are near or above the deposit cap: Bank of America (12.04 percent), Wells Fargo (9.78 percent), and J.P. Morgan Chase (9.07 percent).
4 Local Market and State Trends
In banking antitrust, most concerns arise from competition in local banking markets. Retail banking and small business banking product markets (broadly defined) are still geographically local in nature. The next Tables describe how local banking markets have been affected by bank merger activity and what type of banking markets have experienced significant banking mergers. For the purposes of this analysis, we assume that banking markets are metropolitan statistical areas (MSA), micropolitan areas, and rural counties. We use 2004 MSA definitions. According to these market definitions, there are 369 MSA markets, 578 micropolitan markets, and 1,362 rural county markets. The last part of this section considers how banks might use mergers or acquisition to expand into other markets by considering the extent to which bank mergers cross state lines.
The Effect of Bank Mergers on Local Banking Markets
Table 7 describes mergers by type of banking market. During our sample period, all MSA markets experience a merger at some point, and 92 percent of micropolitan markets experience a merger, while 63 percent of rural markets experience a merger. The average number of mergers in a market over the sample period is 11 in MSA markets, 3 in micropolitan markets, and 1 in rural county markets. Median merger values do not differ significantly from the means, with 7 in MSA markets, 2 in micropolitan markets, and 1 in rural county markets.
Share per market measures the share of target deposits or of target offices involved in mergers. Over 14 percent of market deposits and offices are acquired annually, on average, with median values closer to 10 percent. Both the average and median percent of market deposits and offices acquired increase as market population decreases (from MSA to rural counties), even though the number of mergers is much greater in MSA markets than in rural markets. Rural markets typically have fewer institutions with greater market shares, so when a merger occurs in a rural market, it usually involves a larger share of market deposits.
Remedies to alleviate the competitive effects of merger applications are sometimes required. The main remedy for merger applications is the divestiture of branches in local markets where the competitive effects cannot be mitigated by other factors. Of the 2,399 mergers that occurred, approximately 101 transactions required divestitures in 159 markets before the Federal Reserve approved the transaction.30
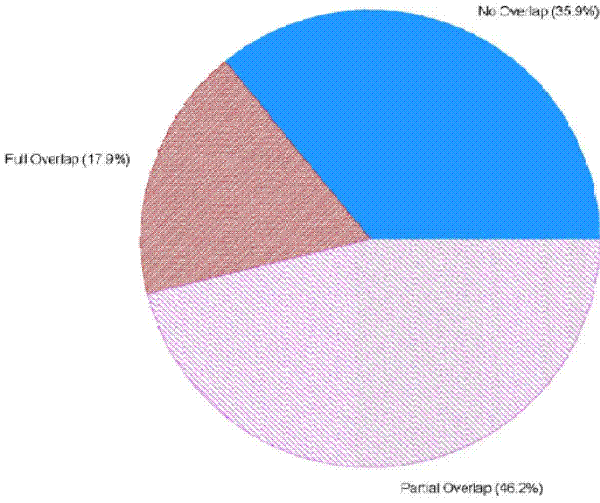
Next, it is important to see how merger activity affected local market concentration. Table 8 describes average Herfindahl-Hirschman Indices (HHI), average number of organizations, and average number of offices for MSA markets, micropolitan markets, and rural county markets. For the purposes of this exercise, thrift deposits are weighted at 50 percent.31 During the past decade, average local market concentration decreased in all types of local markets: MSA average concentration fell from 1,641 to 1,622, micropolitan concentration fell from 2,393 to 2,311, and rural concentration fell from 4,245 to 4,148. The mean number of institutions increased in all types of markets: The mean number of institutions increased from 48 to 54 in MSAs, from 9 to 10 in micropoiltan, and from 5 to 6 in rural markets. Finally, the mean number of branches increased in MSA and micropolitan markets and remained constant in rural markets: In MSA markets, the mean number of branches increased from 493 to 568 branches; in micropolitan, from 24 to 25 branches; and in rural, it remained constant at 10 branches. Chart 3 describes the number of markets where target institutions have complete, partial, or no branch network overlap with the acquiring institution. Almost 18 percent of bank mergers involved institutions with 100 percent of overlap between acquirer and target institutions. Almost 70 percent of these mergers involved single market institutions. About 46 percent of mergers had some but not complete overlap and almost 36 percent of mergers had no overlap between acquiring and target institutions.
Table 9 describes the percent of population affected by bank mergers on an annual basis. It also describes the percent of population where at least 10 percent of deposits were acquired in a market on an annual basis. During the past decade, 24 to 40 percent of the population annually lived in a market where a bank merger occurred, an average of about 33 percent. MSA markets followed the same trend with 34 percent of the population, on average, with a range from about 25 to 41 percent. Micropolitan and rural population percentages affected by bank mergers were much lower, averaging about 11 percent and ranging from 5 to 21 percent annually.
Markets where at least 10 percent of the deposits were acquired affect less than 5 percent of the population in most years except for the years 2001, 2004, and 2008. As discussed earlier, a number of the largest mergers occurred in these years.
The Prevalence of Bank Mergers within or across State Lines
In addition to overlap in local banking markets, we also consider in-state and out-of-state acquisitions as a potential motivation for mergers and acquisitions. Hypothetically, banks could enter other states through mergers or acquisitions. State regulations of banks still vary and some barriers to entry still exist across state lines.32 One might posit that bank mergers may be motivated by a desire to expand across state lines. Banks could acquire banks in states where they do not already have a branch presence in order to gain a foothold in the state for further expansion.33 Table 10 describes how often acquisitions involve in-state or out-of-state acquirers on an annual basis. The data clearly show that mergers are not used primarily to expand into additional states. In every year of our sample, over 70 percent of acquisitions involve institutions that both have a presence in the same states.34 Table 11 weights the in-state and out-of-state acquisitions by deposits or offices.35 The outcome is the same looking at either deposits or offices: 96 percent of deposit-weighted transactions and 94 percent of office-weighted transactions involve an acquirer and target with a presence in the same state.
5 Conclusion
Bank merger activity over the past decade has continued at a fairly steady pace. The recent financial crisis resulted in a decrease in the number of mergers and a shift in the types of mergers from traditional mergers or acquisitions to mainly acquisitions of failed or distressed institutions. The decade saw a dramatic increase in concentration of banking assets at the national level by the largest institutions. Even with that increase, around 7,000 institutions remain.
Merger activity should continue at a steady pace. During the past decade, most mergers and acquisitions occurred between small and medium-sized institutions with less than $30 billion in assets. With around 7,000 institutions, of which 99 percent are small to medium sized, this trend should continue into the future. However, the new Dodd-Frank regulations will increase the regulatory hurdles for large institutions to complete a transaction, regardless of the size of the target.
References
Amel, Dean, Colleen Barnes, Fabio Panetta, and Carmelo Salleo (2004). "Consolidation, Efficiency and Competition in the Financial Sector: A Review of the International Evidence," in Michele Bagella, L. Bechettik, Iftekhar Hasan, and W.C. Hunter, eds., Research in Banking Finance, vol. 4: Monetary Integration, Markets and Regulation. Oxford: Elsevier Ltd., pp. 209-30.
Berger, Allen N., Rebecca S. Demsetz, and Philip E. Strahan (1999). "The Consolidation of the Financial Services Industry: Causes, Consequences, and Implications for the Future," Journal of Banking and Finance, vol. 23, pp. 135-94.
DeYoung, Robert, Douglas D. Evanoff, and Philip Molyneux (2009). "Mergers and Acquisitions of Financial Institutions: A Review of the Post-2000 Literature," Journal of Financial Services Research, vol. 36, pp. 87-110.
Pilloff , Steven J. (2004). Bank Merger Activity in the United States, 1994-2003, Staff Study 176. Washington: Board of Governors of the Federal Reserve System, May.
Rice, Tara, and Christian A. Johnson (2008). "Assessing a Decade of Interstate Bank Branching," Washington and Lee Law Review, vol. 65, pp. 73-127.
Rhoades, Stephen A. (1985). Mergers and Acquisitions by Commercial Banks, 1960-83, Staff Study 142. Washington: Board of Governors of the Federal Reserve System, January.
Rhoades, Stephen A. (1996). Bank Mergers and Industrywide Structure, 1980-94, Staff Study 169. Washington: Board of Governors of the Federal Reserve System, January.
Rhoades, Stephen A. (2000). Bank Mergers and Banking Structure in the United States, 1980-98, Staff Study 174. Washington: Board of Governors of the Federal Reserve System, August.
Wheelock, David C. (2011). "Banking Industry Consolidation and Market Structure: Impact of the Financial Crisis and Recession," Federal Reserve Bank of St. Louis REVIEW, vol. 93 (November/December), pp. 419-38.
| Year | Number of Mergers | Assets Mean | Assets Median | Assets Amount | Assets Industry % | Deposits Mean | Deposits Median | Deposits Amount | Deposits Industry % | Offices Mean | Offices Median | Offices Amount | Offices Industry % |
|---|---|---|---|---|---|---|---|---|---|---|---|---|---|
| ALL | 2403 | 1,705,992 | 134,713 | 4,099,498,050 | - | 1,077,202 | 111,820 | 2,588,517,311 | - | 17 | 3 | 41,615 | - |
| 2000 | 257 | 703,853 | 121,363 | 180,890,307 | 2.7 | 382,664 | 103,228 | 98,344,720 | 2.3 | 11 | 4 | 2,837 | 3.3 |
| 2001 | 235 | 1,422,742 | 133,910 | 334,344,324 | 4.7 | 935,266 | 107,669 | 219,787,415 | 4.8 | 20 | 4 | 4,649 | 5.4 |
| 2002 | 204 | 733,747 | 110,640 | 149,684,286 | 1.9 | 427,982 | 97,353 | 87,308,313 | 1.8 | 9 | 3 | 1,747 | 2.0 |
| 2003 | 203 | 450,153 | 108,540 | 91,381,062 | 1.1 | 334,370 | 88,311 | 67,877,014 | 1.3 | 9 | 3 | 1,776 | 2.0 |
| 2004 | 259 | 3,158,784 | 155,809 | 818,124,982 | 8.9 | 1,886,919 | 134,596 | 488,711,932 | 8.6 | 33 | 4 | 8,496 | 9.5 |
| 2005 | 207 | 566,092 | 130,743 | 117,181,125 | 1.2 | 400,936 | 108,475 | 82,993,846 | 1.3 | 10 | 3 | 1,972 | 2.1 |
| 2006 | 256 | 1,230,822 | 132,041 | 315,090,507 | 3.0 | 734,649 | 110,206 | 188,070,266 | 2.8 | 11 | 3 | 2,857 | 3.0 |
| 2007 | 249 | 1,442,120 | 140,215 | 359,087,886 | 3.1 | 914,140 | 120,049 | 227,620,907 | 3.3 | 13 | 4 | 3,319 | 3.4 |
| 2008 | 195 | 7,028,747 | 109,740 | 1,370,605,745 | 11.1 | 438,738 | 92,305 | 855,540,691 | 11.4 | 50 | 3 | 9,670 | 9.8 |
| 2009 | 158 | 1,629,688 | 195,617 | 257,490,686 | 2.2 | 1,179,248 | 166,917 | 186,321,236 | 2.4 | 18 | 4 | 2,831 | 2.8 |
| 2010 | 180 | 586,762 | 170,898 | 105,617,140 | 0.9 | 477,450 | 149,056 | 85,940,971 | 1.1 | 8 | 3 | 1,461 | 1.5 |
| Year | Mean Acquirer | Mean Target | Mean Ratio | Median Acquirer | Median Target | Median Ratio |
|---|---|---|---|---|---|---|
| ALL | 14,864,079 | 1,705,992 | 39.7% | 1,034,541 | 134,713 | 14.2% |
| 2000 | 15,917,224 | 703,853 | 25.3% | 1,029,038 | 121,363 | 13.2% |
| 2001 | 10,221,220 | 1,422,742 | 36.5% | 902,498 | 133,910 | 14.3% |
| 2002 | 10,977,785 | 733,747 | 22.8% | 778,875 | 110,640 | 13.9% |
| 2003 | 9,102,179 | 450,153 | 23.2% | 946,753 | 108,540 | 12.6% |
| 2004 | 14,250,810 | 3,158,784 | 31.7% | 1,347,064 | 155,809 | 15.4% |
| 2005 | 9,124,718 | 566,092 | 30.6% | 1,120,961 | 130,743 | 12.6% |
| 2006 | 16,661,477 | 1,230,822 | 24.8% | 1,263,804 | 132,041 | 13.3% |
| 2007 | 22,755,425 | 1,442,120 | 34.3% | 1,035,305 | 140,215 | 14.0% |
| 2008 | 29,035,911 | 7,028,747 | 33.3% | 599,481 | 109,740 | 20.0% |
| 2009 | 13,924,181 | 1,629,688 | 114.1% | 913,657 | 195,617 | 24.0% |
| 2010 | 9,806,776 | 586,762 | 94.7% | 1,556,374 | 170,898 | 11.7% |
| Year | Mean Acquirer | Mean Target | Mean Ratio | Median Acquirer | Median Target | Median Ratio |
|---|---|---|---|---|---|---|
| ALL | 9,216,422 | 1,077,202 | 43.1% | 817,989 | 111,820 | 15.4% |
| 2000 | 10,030,609 | 382,664 | 34.4% | 826,490 | 103,228 | 14.0% |
| 2001 | 6,112,398 | 935,266 | 38.0% | 715,130 | 107,669 | 14.3% |
| 2002 | 6,470,681 | 427,982 | 24.0% | 628,923 | 97,353 | 15.6% |
| 2003 | 5,883,324 | 334,370 | 24.4% | 783,395 | 88,311 | 14.6% |
| 2004 | 8,902,116 | 1,886,919 | 32.9% | 954,246 | 134,596 | 16.1% |
| 2005 | 5,358,886 | 400,936 | 28.5% | 872,840 | 108,475 | 13.2% |
| 2006 | 11,105,217 | 734,649 | 25.5% | 982,227 | 110,206 | 13.7% |
| 2007 | 13,041,376 | 914,140 | 41.6% | 817,989 | 120,049 | 15.5% |
| 2008 | 17,185,413 | 4,387,388 | 35.6% | 488,041 | 92,305 | 19.4% |
| 2009 | 8,914,595 | 1,179,248 | 124.9% | 697,212 | 166,917 | 25.5% |
| 2010 | 7,520,062 | 477,450 | 99.9% | 1,170,228 | 149,056 | 12.9% |
| Year | Mean Acquirer | Mean Target | Mean Ratio | Median Acquirer | Median Target | Median Ratio |
|---|---|---|---|---|---|---|
| ALL | 144 | 17 | 63.0% | 21 | 3 | 17.6% |
| 2000 | 210 | 11 | 35.5% | 22 | 4 | 19.5% |
| 2001 | 121 | 20 | 85.8% | 23 | 4 | 16.7% |
| 2002 | 121 | 9 | 30.3% | 19 | 3 | 17.6% |
| 2003 | 111 | 9 | 33.1% | 21 | 3 | 14.3% |
| 2004 | 134 | 33 | 37.0% | 24 | 4 | 20.0% |
| 2005 | 79 | 10 | 132.8% | 22 | 3 | 15.8% |
| 2006 | 155 | 11 | 35.1% | 21 | 3 | 14.7% |
| 2007 | 169 | 13 | 37.8% | 21 | 4 | 20.0% |
| 2008 | 228 | 50 | 83.5% | 14 | 3 | 25.0% |
| 2009 | 148 | 18 | 142.8% | 17 | 4 | 25.0% |
| 2010 | 81 | 8 | 82.4% | 23 | 3 | 14.8% |
Table 3: Concentration of Assets and Deposits 2000 to 2010
| Year | Top 10 % of Total Deposits | Top 50 % of Total Deposits | Top 100 % of Total Deposits | Top 10 % of Total Assets | Top 50 % of Total Assets | Top 100 % of Total Assets |
|---|---|---|---|---|---|---|
| 2000 | 29.8 | 54.5 | 64.3 | 36.0 | 61.7 | 70.7 |
| 2001 | 33.5 | 56.6 | 65.4 | 38.5 | 62.8 | 71.2 |
| 2002 | 34.2 | 57.3 | 65.7 | 39.4 | 63.3 | 71.6 |
| 2003 | 34.3 | 57.4 | 66.0 | 39.7 | 63.3 | 71.8 |
| 2004 | 39.1 | 60.4 | 68.1 | 43.7 | 66.1 | 73.8 |
| 2005 | 38.8 | 61 | 68.6 | 43.2 | 66.5 | 74.2 |
| 2006 | 39.6 | 61.8 | 69.6 | 45.1 | 68.0 | 75.3 |
| 2007 | 40.5 | 63.3 | 70.7 | 46.8 | 70.2 | 76.8 |
| 2008 | 43.4 | 65.7 | 72.1 | 50.9 | 72.0 | 77.8 |
| 2009 | 44.8 | 66.1 | 72.1 | 49.8 | 71.3 | 76.9 |
| 2010 | 45.6 | 66.6 | 72.9 | 50.1 | 71.6 | 77.5 |
| Acquirer type | Target type | Number of Mergers | Assets Mean | Assets Median | Assets Amount | Assets % of total | Deposits Mean | Deposits Median | Deposits Amount | Deposits % of total | Offices Mean | Offices Median | Offices Amount | Offices % of total |
|---|---|---|---|---|---|---|---|---|---|---|---|---|---|---|
| ALL | ALL | 2403 | 1,705,992 | 134,713 | 4,099,498,050 | 100 | 1,077,202 | 111,820 | 2,588,517,311 | 100 | 17 | 3 | 41,615 | 100 |
| BANK | BANK | 1874 | 1,618,683 | 124,943 | 3,033,411,277 | 74 | 1,046,762 | 106,720 | 1,961,631,224 | 76 | 17 | 3 | 31,698 | 76 |
| BANK | THRIFT | 245 | 3,378,906 | 227,827 | 827,831,897 | 20 | 1,934,930 | 166,925 | 474,057,867 | 18 | 29 | 5 | 7,066 | 17 |
| THRIFT | BANK | 112 | 580,772 | 152,388 | 65,046,489 | 2 | 450,812 | 131,904 | 50,490,938 | 2 | 9 | 4 | 1,008 | 2 |
| THRIFT | THRIFT | 172 | 1,007,026 | 174,629 | 173,208,387 | 4 | 594,984 | 124,335 | 102,337,282 | 4 | 11 | 4 | 1,843 | 4 |
| Year | Total Mergers | Bank-Bank | Bank-Thrift | Thrift-Bank | Thrift-Thrift |
|---|---|---|---|---|---|
| ALL | 2403 | 1874 | 245 | 112 | 172 |
| 2000 | 257 | 189 | 32 | 8 | 28 |
| 2001 | 235 | 183 | 24 | 9 | 19 |
| 2002 | 204 | 150 | 23 | 8 | 23 |
| 2003 | 203 | 148 | 22 | 13 | 20 |
| 2004 | 259 | 195 | 25 | 16 | 23 |
| 2005 | 207 | 157 | 22 | 13 | 15 |
| 2006 | 256 | 214 | 24 | 8 | 10 |
| 2007 | 249 | 200 | 20 | 14 | 15 |
| 2008 | 195 | 158 | 19 | 9 | 9 |
| 2009 | 158 | 131 | 18 | 7 | 2 |
| 2010 | 180 | 149 | 16 | 7 | 8 |
| Buyer | Target | Rank | Year | Target assets | Target deposits | Target offices |
|---|---|---|---|---|---|---|
| WELLS FARGO & COMPANY | WACHOVIA CORPORATION | 1 | 2008 | 706,137,276 | 430,029,942 | 3367 |
| J.P. MORGAN CHASE & CO. | BANK ONE CORPORATION | 2 | 2004 | 375,146,701 | 170,160,145 | 1880 |
| J.P. MORGAN CHASE & CO. | WASHINGTON MUTUAL, INC. | 3 | 2008 | 329,974,652 | 182,409,135 | 2239 |
| BANK OF AMERICA CORPORATION | FLEETBOSTON FINANCIAL CORPORATION | 4 | 2004 | 211,690,609 | 149,911,597 | 1534 |
| PNC FINANCIAL SERVICES GROUP, INC. | NATIONAL CITY CORPORATION | 5 | 2008 | 139,835,067 | 84,633,240 | 1568 |
| WACHOVIA CORPORATION | GOLDEN WEST FINANCIAL CORPORATION | 6 | 2006 | 134,537,638 | 65,131,102 | 287 |
| BANK OF AMERICA CORPORATION | LASALLE BANK CORPORATION | 7 | 2007 | 127,146,381 | 60,616,782 | 406 |
| FIRSTAR CORPORATION | U.S. BANCORP | 8 | 2001 | 106,107,923 | 65,185,303 | 1090 |
| FIRST UNION CORPORATION | WACHOVIA CORPORATION | 9 | 2001 | 85,358,742 | 49,757,706 | 691 |
| BANCO SANTANDER, S.A. | SOVEREIGN BANCORP, INC. | 10 | 2009 | 78,293,203 | 48,685,250 | 748 |
| CITIGROUP, INC. | GOLDEN STATE BANCORP INC. | 11 | 2002 | 68,550,720 | 27,626,307 | 353 |
| CHASE MANHATTAN CORPORATION (THE) | J.P. MORGAN & COMPANY, INCORPORATED | 12 | 2000 | 66,643,568 | 6,598,477 | 4 |
| WACHOVIA CORPORATION | SOUTHTRUST CORPORATION | 13 | 2004 | 59,892,984 | 37,607,549 | 727 |
| REGIONS FINANCIAL CORPORATION | AMSOUTH BANCORPORATION | 14 | 2006 | 56,860,727 | 37,861,341 | 689 |
| MITSUBISHI UFJ FINANCIAL GROUP, INC. | UNIONBANCAL CORPORATION | 15 | 2008 | 54,794,172 | 41,214,629 | 342 |
| TORONTO-DOMINION BANK | COMMERCE BANCORP, INC. | 16 | 2008 | 52,717,231 | 48,361,916 | 476 |
| ROYAL BANK OF SCOTLAND GROUP PLC | CHARTER ONE FINANCIAL, INC. | 17 | 2004 | 49,289,202 | 31,856,960 | 684 |
| FLEETBOSTON FINANCIAL CORPORATION | SUMMIT BANCORP | 18 | 2001 | 49,158,520 | 33,733,502 | 511 |
| BANK OF NEW YORK COMPANY, INC. | MELLON FINANCIAL CORPORATION | 19 | 2007 | 40,753,621 | 23,254,118 | 46 |
| REGIONS FINANCIAL CORPORATION | UNION PLANTERS CORPORATION | 20 | 2004 | 36,305,225 | 26,773,649 | 711 |
| BANCO BILBAO VIZCAYA ARGENTARIA, S.A. | COMPASS BANCSHARES, INC. | 21 | 2007 | 35,952,113 | 24,403,298 | 421 |
| WASHINGTON MUTUAL, INC. | DIME BANCORP, INCORPORATED | 22 | 2002 | 33,903,731 | 16,248,518 | 125 |
| TD BANK FINANCIAL GROUP | BANKNORTH GROUP, INC. | 23 | 2005 | 31,993,620 | 21,767,675 | 412 |
| WELLS FARGO & COMPANY | FIRST SECURITY CORPORATION | 24 | 2000 | 29,464,513 | 16,003,988 | 339 |
| SUNTRUST BANKS, INC. | NATIONAL COMMERCE FINANCIAL CORPORATION | 25 | 2004 | 27,485,095 | 19,052,209 | 504 |
| NORTH FORK BANCORPORATION, INC. | GREENPOINT FINANCIAL CORP. | 26 | 2004 | 26,523,003 | 14,709,237 | 93 |
| BB&T CORPORATION | COLONIAL BANK | 27 | 2009 | 26,059,276 | 18,866,063 | 356 |
| WASHINGTON MUTUAL, INC. | BANK UNITED CORPORATION | 28 | 2001 | 22,959,211 | 9,885,113 | 156 |
| SOVEREIGN BANCORP, INC. | INDEPENDENCE COMMUNITY BANK CORP. | 29 | 2006 | 20,561,837 | 12,000,266 | 126 |
| NATIONAL CITY CORPORATION | PROVIDENT FINANCIAL GROUP, INC. | 30 | 2004 | 19,601,090 | 12,288,917 | 66 |
| All Market type | MSA Market type | Micro Market type | Rural Market type | |
|---|---|---|---|---|
| Number of markets Total | 2309 | 369 | 578 | 1362 |
| Number of markets With mergers | 1691 | 369 | 522 | 800 |
| % of markets w/ mergers | 73.2 | 100.0 | 90.3 | 58.7 |
| Number of mergers per market Mean | 3.0 | 11.0 | 2.7 | 1.0 |
| Number of mergers per market Median | 1.0 | 7.0 | 2.0 | 1.0 |
| Number of mergers per market Max | 118.0 | 118.0 | 12.0 | 8.0 |
| Share per market (%) Mean deposits | 14.1 | 8.5 | 13.5 | 23.7 |
| Share per market (%) Median deposits | 9.2 | 4.9 | 9.6 | 18.0 |
| Share per market (%) Mean offices | 13.9 | 8.2 | 12.8 | 23.9 |
| Share per market (%) Median offices | 10.0 | 5.9 | 10.0 | 19.2 |
| Year | HHI MSA | Number of MSA orgs. | Number of MSA offices | HHI Micro | Number of Micro orgs. | Number of Micro offices | HHI Rural | Number of Rural orgs. | Number of Rural offices |
|---|---|---|---|---|---|---|---|---|---|
| ALL | 1611 | 52 | 493 | 2348 | 9 | 24 | 4183 | 5 | 10 |
| 2000 | 1641 | 48 | 419 | 2393 | 9 | 23 | 4245 | 5 | 10 |
| 2001 | 1629 | 48 | 417 | 2384 | 9 | 23 | 4212 | 5 | 10 |
| 2002 | 1605 | 49 | 427 | 2385 | 9 | 23 | 4200 | 5 | 10 |
| 2003 | 1601 | 50 | 442 | 2378 | 9 | 23 | 4216 | 5 | 10 |
| 2004 | 1611 | 51 | 463 | 2356 | 9 | 23 | 4220 | 5 | 10 |
| 2005 | 1630 | 52 | 496 | 2353 | 9 | 24 | 4197 | 5 | 10 |
| 2006 | 1597 | 56 | 518 | 2322 | 9 | 24 | 4147 | 5 | 10 |
| 2007 | 1580 | 57 | 544 | 2318 | 10 | 24 | 4143 | 6 | 10 |
| 2008 | 1599 | 57 | 560 | 2320 | 10 | 25 | 4146 | 6 | 10 |
| 2009 | 1608 | 55 | 564 | 2306 | 10 | 25 | 4136 | 6 | 10 |
| 2010 | 1622 | 54 | 568 | 2311 | 10 | 25 | 4148 | 6 | 10 |
| Year | All with at least one target (% of U.S. population) | MSA with at least one target (% of U.S. population) | Micro with at least one target (% of U.S. population) | Rural with at least one target (% of U.S. population) | All acquired with at least 10% deposits (% of U.S. population) | MSA acquired with at least 10% deposits (% of U.S. population) | Micro acquired with at least 10% deposits (% of U.S. population) | Rural acquired with at least 10% (% of U.S. population)deposits |
|---|---|---|---|---|---|---|---|---|
| ALL | 32.7 | 33.6 | 11.1 | 9.9 | 5.7 | 5.7 | 5.2 | 6.6 |
| 2000 | 24.0 | 24.9 | 8.6 | 7.0 | 0.8 | 0.6 | 4.9 | 4.6 |
| 2001 | 32.6 | 33.4 | 14.4 | 13.0 | 6.1 | 6.0 | 9.1 | 9.5 |
| 2002 | 33.1 | 34.1 | 5.4 | 6.6 | 0.5 | 0.4 | 2.0 | 4.4 |
| 2003 | 32.9 | 33.9 | 7.7 | 9.0 | 1.1 | 1.0 | 1.9 | 5.6 |
| 2004 | 40.2 | 41.0 | 20.9 | 18.7 | 18.9 | 19.2 | 10.6 | 12.5 |
| 2005 | 33.8 | 34.4 | 14.1 | 11.8 | 0.5 | 0.3 | 4.3 | 7.1 |
| 2006 | 29.0 | 29.8 | 7.6 | 6.2 | 1.8 | 1.7 | 3.6 | 3.7 |
| 2007 | 29.1 | 30.0 | 9.1 | 8.3 | 6.6 | 6.7 | 4.1 | 5.5 |
| 2008 | 34.0 | 35.2 | 14.1 | 11.0 | 24.9 | 25.8 | 8.6 | 7.8 |
| 2009 | 40.2 | 41.4 | 7.5 | 6.2 | 1.0 | 0.9 | 2.7 | 4.1 |
| 2010 | 31.0 | 31.4 | 13.1 | 11.5 | 0.3 | 0.1 | 5.3 | 8.0 |
| Year | Mergers | In-state acquirer Mergers | In-state acquirer % of total | Out-of-state acquirer Mergers | Out-of-state acquirer % of total |
|---|---|---|---|---|---|
| ALL | 2403 | 1833 | 76.3 | 570 | 23.7 |
| 2000 | 257 | 199 | 77.4 | 58 | 22.6 |
| 2001 | 235 | 187 | 79.6 | 48 | 20.4 |
| 2002 | 204 | 160 | 78.4 | 44 | 21.6 |
| 2003 | 203 | 159 | 78.3 | 44 | 21.7 |
| 2004 | 259 | 185 | 71.4 | 74 | 28.6 |
| 2005 | 207 | 145 | 70.0 | 62 | 30.0 |
| 2006 | 256 | 195 | 76.2 | 61 | 23.8 |
| 2007 | 249 | 194 | 77.9 | 55 | 22.1 |
| 2008 | 195 | 158 | 81.0 | 37 | 19.0 |
| 2009 | 158 | 117 | 74.1 | 41 | 25.9 |
| 2010 | 180 | 134 | 74.4 | 46 | 25.6 |
| Year | Total Acquired Deposits | In-state acquirer Deposits | In-state acquirer % of total | Out-of-state acquirer Deposits | Out-of-state acquirer % of total | Total Acquired Offices | In-state acquirer Offices | In-state acquirer % of total | Out-of-state acquirer Offices | Out-of-state acquirer % of total |
|---|---|---|---|---|---|---|---|---|---|---|
| ALL | 2,588,517,311 | 2,471,853,956 | 95.5 | 116,663,355 | 4.5 | 41615 | 39,044 | 93.8 | 2,571 | 6.2 |
| 2000 | 98,344,720 | 91,997,404 | 93.5 | 6,347,316 | 6.5 | 2837 | 2,595 | 91.5 | 242 | 8.5 |
| 2001 | 219,787,415 | 207,173,219 | 94.3 | 12,614,196 | 5.7 | 4649 | 4,211 | 90.6 | 438 | 9.4 |
| 2002 | 87,308,313 | 68,757,197 | 78.8 | 18,551,116 | 21.2 | 1747 | 1,473 | 84.3 | 274 | 15.7 |
| 2003 | 67,877,014 | 62,460,785 | 92.0 | 5,416,229 | 8.0 | 1776 | 1,650 | 92.9 | 126 | 7.1 |
| 2004 | 488,711,932 | 479,605,591 | 98.1 | 9,106,341 | 1.9 | 8496 | 8,226 | 96.8 | 270 | 3.2 |
| 2005 | 82,993,846 | 74,607,139 | 89.9 | 8,386,707 | 10.1 | 1972 | 1,754 | 88.9 | 218 | 11.1 |
| 2006 | 188,070,266 | 181,282,706 | 96.4 | 6,787,560 | 3.6 | 2857 | 2,684 | 93.9 | 173 | 6.1 |
| 2007 | 227,620,907 | 218,540,393 | 96.0 | 9,080,514 | 4.0 | 3319 | 3,078 | 92.7 | 241 | 7.3 |
| 2008 | 855,540,691 | 849,591,083 | 99.3 | 5,949,608 | 0.7 | 9670 | 9,562 | 98.9 | 108 | 1.1 |
| 2009 | 186,321,236 | 165,793,419 | 89.0 | 20,527,817 | 11.0 | 2831 | 2,601 | 91.9 | 230 | 8.1 |
| 2010 | 85,940,971 | 72,045,020 | 83.8 | 13,895,951 | 16.2 | 1461 | 1,210 | 82.8 | 251 | 17.2 |