The Federal Reserve's Balance Sheet and Earnings: A primer and projections1
Seth Carpenter, Jane Ihrig, Elizabeth Klee, Daniel Quinn, and Alexander Boote2
September 2013
Abstract
Over the past few years, the Federal Reserve's use of unconventional monetary policy tools has received a vast amount of public attention, from discussing how these asset purchases have put downward pressure on longer-term interest rates and thus supported economic activity to evaluating the implications for Federal Reserve remittances to the Treasury and the effect on monetary and fiscal policy. As the economic recovery has gained some momentum of late, the focus has turned to issues associated with the normalization of monetary policy. In this paper, we consider a variety of scenarios consistent with statements by Federal Reserve officials about how the FOMC will normalize policy, including whether to sell mortgage-backed securities and the timing of lifting the federal funds rate off from the zero lower bound. In addition, we analyze the potential costs associated with using reserve-draining tools, which could become an important expense during the years of normalization. In each of these scenarios, we discuss the implications of these normalization policies on the size and composition of Federal Reserve asset holdings, which provides some indicate the length of time unconventional monetary policy will be in place, and on remittances of earnings to the Treasury, which capture the interest rate risk of these normalization policies.
1 Introduction
In response to the financial crisis that began in 2007 and the subsequent recession, the Federal Reserve has been employing a variety of nontraditional monetary policy tools that have garnered a vast amount of public discussion. Some discussion has focused on the expanding size and changing composition of the Federal Reserve's balance sheet, and specifically, the Federal Reserve's holdings of securities in the System Open Market Account (SOMA) (Federal Reserve Bank of New York (2013)). This expansion of holdings of securities has led to deeper discussions about the effects of unconventional monetary policy on interest rates (Li and Wei (2013), Krishnamurthy and Vissing-Jorgensen (2011)) as well as the implications for Federal Reserve remittances to the Treasury and the effect on monetary and fiscal policy (Rudebusch (2011), Greenlaw et al. (2013), and Carpenter et al. (2013)).
More recently, as the economic recovery has gained some momentum, the discussion has turned to questions about the normalization of monetary policy. In various venues, Federal Open Market Committee (FOMC) participants have expressed their views about normalizing the stance of monetary policy. In particular, Chairman Bernanke provided commentary on policy normalization and the long-run composition of the balance sheet during the press conference that followed the June 2013 FOMC meeting. In addition, recent FOMC statements clearly tie the rise in the federal funds rate to the outlook for unemployment and inflation. For example in its June 2013 statement the Committee stated that it anticipated that a 0 to 25 basis point "range for the federal funds rate will be appropriate at least as long as the unemployment rate remains above 6-1/2 percent, inflation between one and two years ahead is projected to be no more than a half percentage point above the Committee's 2 percent longer-run goal, and longer-term inflation expectations continue to be well anchored." In this paper, we consider how the Federal Reserve's balance sheet, and the income that derives from the balance sheet, might evolve under a variety of assumptions about the path of monetary policy and approaches to the normalization of policy. For example, we consider both the June 2011 exit principles that included sales of mortgage-backed securities (MBS) as part of the normalization process, as well as the approach laid out by the Chairman at his June 2013 press conference that suggests that such sales would not be a prominent part of policy normalization. In addition, given the evolving views in markets about the likely timing of the first increase in the federal funds rate, we also consider a scenario where the date of lift off is pushed out, consistent with a lower unemployment rate threshold, and analyze the effect of that timing for the path of the balance sheet. Finally, we discuss some of the possible implications for Federal Reserve expenses from using reserve-draining tools during the normalization process.
In analyzing each of these normalization scenarios, we report the length of time until the Federal Reserve's balance sheet returns to a normal size; the evolution of the size composition of the balance sheet determines the effect of the asset purchases on interest rates (see, for example Ihrig, et al. (2012)). We also project how MBS holdings will evolve, given that holdings of MBS are a particularly novel development for the Federal Reserve and minutes from FOMC meetings suggest that their acquisition has been a source of some debate. In addition, we look at the interest-rate risk of different exit strategies that appear to be under consideration. Such considerations may be important if, as Greenlaw et al. (2013) suggest, a period of zero remittances might result in negative political pressures (see Greenlaw et al. (2013)).
The projections in this paper are constructed to be consistent with Federal Reserve accounting principles; Carpenter et al. (2013) discusses Federal Reserve accounting and the methodology employed.3 Our projections rely on the FOMC's guidance regarding monetary policy normalization principles, the forecasts in the June 2013 Primary Dealer Survey conducted by the Federal Reserve Bank of New York, as well as the June 2013 Blue Chip forecast. In the near-term, we assume large-scale asset purchases that are in line with the median projection from the Dealer survey, with purchases in 2013 and 2014 totaling about $1.1 trillion. Following the public statements by Federal Reserve officials, we assume that the Federal Reserve will continue to reinvest the proceeds from maturing or prepaying securities in order to keep the size of its balance sheet roughly constant in the time between the end of asset purchases until just before the first increase in the target for the federal funds rate. Consistent with the June 2011 FOMC exit principles, we assume that the first step to normalize the stance of monetary policy involves the FOMC allowing SOMA holdings to mature or prepay without reinvestment. Beyond that first move, we analyze a variety of alternative normalization policies mentioned above. A summary is of the key results is shown in Table 1.
In the baseline projection, we assume no MBS sales, consistent with the Chairman's comments in his June 2013 press conference. The size of the SOMA portfolio will normalize by August 2020. Despite the normalization of the size of the portfolio, the composition of the portfolio will still reflect the nontraditional policy choices; at the end of our projection period in 2025, over $400 billion of MBS will remain on the Federal Reserve's books. Annual remittances to the Treasury are projected to remain sizable over the near term and cumulate from 2009-2025 to about $910 billion. Overall, this scenario suggests that large-scale asset purchases will have a net positive effect on income relative to a scenario with no purchases, but the Federal Reserve will continue to hold MBS for some time.
Under the June 2011 exit strategy principles, sales of MBS were included because of a desire to return to a Treasury only portfolio.4 Sales of MBS accelerate the date of normalizing the size of the portfolio by about a year relative to the scenario with no MBS sales. However, sales of MBS would also likely result in realized capital losses on the MBS, an outcome that would most likely reduce annual remittance to zero for a few years and result in the Federal Reserve recording a small deferred asset. In pursuing this normalization strategy, the FOMC presumably would need to evaluate, among other considerations, the tradeoffs of reducing MBS holdings to zero with the possibility of zero remittances. In addition, selling seasoned MBS that may have a coupon that is very different from prevailing market interest rates might also be seen as risking unnecessary volatility or illiquidity in fixed income markets at the critical point when the FOMC is trying to firm the stance of policy.
Another recent policy option noted by Chairman Bernanke in his June 2013 post-FOMC press conference is to lower the unemployment threshold, which, if all else were unchanged, would imply a later date for the funds rate to lift off from the zero lower bound. This change would delay the date of normalization of the size of the balance sheet somewhat. Moreover, this alternative path for the balance sheet combined with a different path for interest rates would have implications for Federal Reserve income and, as a result, remittances to the Treasury. In our analysis, this delay in lift off would boost remittances but result in more MBS holdings at the end of the projection period.
Finally, we examine the use of reserve-draining tools. The baseline analysis does not explicitly model reserve-draining tools, one interpretation of which is that no such tools are needed, or that the use of reverse repurchase agreements (RRPs) or term deposits by the Federal Reserve would be at same cost as interest on excess reserves (IOER). FOMC communications have noted the likely use of these reserve-draining tools, and it is possible that some of the operations will involve transactions with terms longer than overnight, and as a result, a rate that is above the IOER rate. A priori, we have little information to gauge the likely cost of these tools. To provide a rough gauge as to how costly could possibly be, we assess the effects on Federal Reserve net income if the interest expense is 50 basis points higher than the projected level of the federal funds rate. 50 basis points is roughly one standard deviation of the historical spread between the federal funds rate and the yield on the three-month Treasury bill. Although interest expenses rise, there is only a modest effect on the Federal Reserve's cumulative remittances.
The above analysis assumes interest rates follow the path forecasted by the Primary Dealers and Blue Chip respondents. To explore the interest rate sensitivity of our results, we also consider a case where interest rates are 200 basis points higher after liftoff, for both the baseline and MBS sales scenarios. This scenario provides a rough notion of the interest rate risk embedded in the SOMA portfolio. Compared to the baseline, the higher interest rate path implies greater interest expense on reserve balances, lower net income, and consequently lower remittances to the Treasury. In the case of MBS sales, the higher interest rate path also leads to greater realized capital losses, which further reduce net income and remittances. In these high interest rate scenarios, we project at least three years of zero remittances to the Treasury. Zero remittances do not preclude the FOMC from conducting monetary policy; in fact, foreign central banks, such as the Czech National Bank, have operated with negative equity.5
Table 1 - Summary Statistics of Alternative Normalization Policies
| SOMA size normalizes: Date | SOMA composition normalizes: Date | 2025 MBS holdings ($ billions) | 2009-2025 Cumulative remittances ($ billions) | Trough remittances (date) ($ billions) | |
|---|---|---|---|---|---|
| Baseline | Aug 2020 | - | $407 | $908 | $17 (2018) |
| MBS sales | May 2019 | Mar 2020 | $0 | $841 | $0 (2018-2019) |
| Threshold UR 6.0% | Jun 2021 | - | $512 | $1,052 | $31 (2019) |
| Reserve Draining tools +50bp | Aug 2020 | - | $407 | $870 | $12 (2018) |
| Higher Interest Rates +200bp | |||||
| Baseline | Aug 2020 | - | $407 | $869 | $0 (2017-19) |
| MBS sales | Jun 2019 | Jun 2020 | $0 | $804 | $0 (2017-21) |
The remainder of the paper is organized as follows. Section 2 outlines the assumptions used as inputs to the projections of the balance sheet. The baseline balance sheet and income projections are discussed in Section 3. Section 4 considers the alternative normalization policies. Section 5 provides the sensitivity analysis. Section 6 concludes.
2 Projections assumptions
In order to construct projections of the Federal Reserve's balance sheet, assumptions about many of the details of the macroeconomy as well as the Federal Reserve's balance sheet and its evolution must be made. The following subsections review key assumptions made to project the balance sheet and income; a detailed description of these and all other balance sheet line items is in Carpenter et al. (2013).
2.1 Interest rate assumptions
To evaluate the current and future value of the SOMA portfolio, to project the future interest expense of reserve balances, and to project the future interest income from the portfolio, assumptions must be made about the path of interest rates over the projection period. For this analysis, we
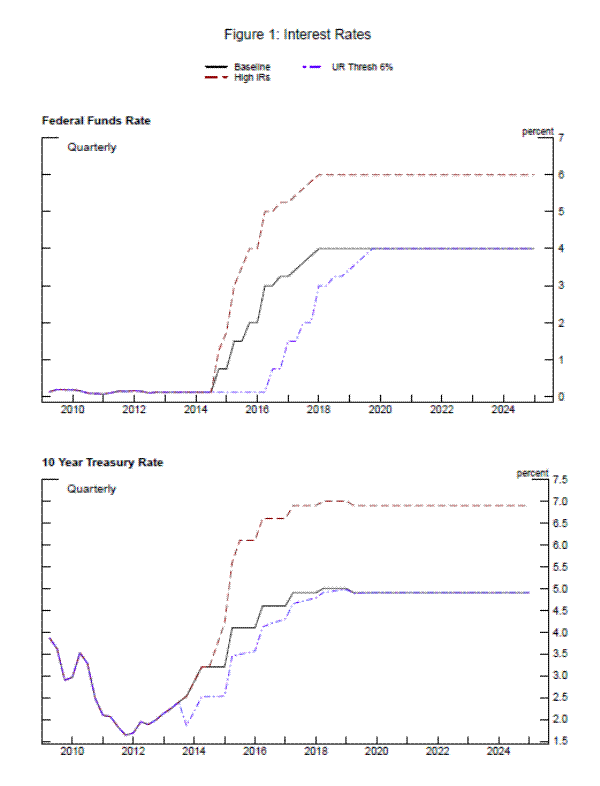
rely on the median interest rate projection from the June 2013 Primary Dealer Survey (PDS) for the federal funds rate and the Blue Chip forecast for the ten-year Treasury rate.6 The assumed path for the federal funds rate and the yield on the ten-year Treasury note are shown in Figure 1. The federal funds rate remains in the 0 to ¼ percent range until the third quarter of 2015.![]() This liftoff date coincides with an unemployment rate of roughly 6.5 percent in the PDS, consistent with the threshold communications by Federal Reserve officials. After that point, the rate is projected to rise and stand at 4 percent in 2025. The
yield on the ten-year Treasury note also rises, from the average 2013:Q2 rate of 1.9 percent to 4.9 percent at the end of the projection period. With these two rates, we project the entire yield curve at each point in time.7
This liftoff date coincides with an unemployment rate of roughly 6.5 percent in the PDS, consistent with the threshold communications by Federal Reserve officials. After that point, the rate is projected to rise and stand at 4 percent in 2025. The
yield on the ten-year Treasury note also rises, from the average 2013:Q2 rate of 1.9 percent to 4.9 percent at the end of the projection period. With these two rates, we project the entire yield curve at each point in time.7
2.2 Near-term balance sheet assumptions
This subsection reviews our projection methodology for selected asset and liability items that are of particular interest.
2.2.1 SOMA portfolio
The evolution of the SOMA portfolio is intended to be consistent with the FOMC statement on June 19, 2013. In particular, we assume:
- Holdings of securities are increased at a pace of $45 billion per month in longer-term Treasury securities and $40 billion per month in agency MBS until December 2013. At that time, the pace of purchases is reduced over the first half of 2014 and the expansion of the portfolio ends in June 2014. As a result, total expansion in holdings of Treasury securities and MBS over 2013 and 2014 is about $1.1 trillion. This path is consistent with the median response to the June 2013 PDS.
- Reinvestment of principal payments from agency securities into agency MBS continues until the FOMC begins to unwind the current accommodative monetary policy stance. Specifically, maturing or prepaying securities are assumed to be reinvested until six months prior to the first projected increase in the federal funds rate.
Given the initial composition of the SOMA portfolio on May 31, 2013, the portfolio evolves reflecting these two primary assumptions and the fact that, over time, securities held in the portfolio age, mature, or prepay. The interest earned on securities already in the portfolio is known. The
interest rate on securities purchased in the future is calculated as a function of projected interest rates at the time of purchase. Moreover, the composition of future purchases imposes the assumed constraint announced by the Federal Reserve Bank of New York that SOMA holdings that any one CUSIP
will remain below 70 percent of the total amount outstanding in that CUSIP.8![]()
It is important to note that Federal Reserve accounting records the securities holdings at face value and records any unamortized premium as a separate asset or unamortized discount as a separate negative asset. Consequently, we must project both the face value of the portfolio and the associated premiums. To project premiums on future securities purchases we need to calculate the market value of securities in the future, which we assume is the present discounted cash flow of these securities.
2.2.2 Liabilities and capital
In our modeling, projections of Reserve Bank liabilities and capital are also critical. In the near term, the size of the balance sheet is driven primarily by securities purchases boosting the asset side of the balance sheet and reserve balances increasing on the liabilities side as the primary offsetting accounting entry. Prior to the financial crisis, however, the liabilities side of the balance sheet typically determined the size of the balance sheet. Reserve balances were fairly small, so increases in currency were the main driver of the balance sheet, with Reserve Bank capital also contributing, but to a lesser extent. Normalization of the size of the balance sheet, therefore, can be thought of as the point when the size of the balance sheet is once again driven by the liabilities side of the balance sheet. For simplicity, we assume that Federal Reserve notes grow in line with the Blue Chip forecast for nominal GDP.9 Capital paid in is assumed to grow at its decade average of 15 percent per year, and surplus is equated to capital paid in.10 This growth rate plays a role in the long-run trend growth rate of the SOMA portfolio.
As noted above, until the size of the balance sheet is normalized, we allow reserve balances to be endogenous, calculated as the residual of assets less other liabilities less capital. When reserve balances fall to $25 billion as the portfolio shrinks, however, we assume that the Federal Reserve does not allow them to fall further. As currency and Reserve Bank capital are still expanding at that point, purchases of Treasury securities are assumed to restart. Holdings of Treasury securities expand at the same rate as currency and Reserve Bank capital, keeping reserve balances at the assumed $25 billion level. To maintain reserve balances at $25 billion, we assume that the Desk begins to purchase Treasury bills. Purchases of bills continue until these securities comprise one-third of the Federal Reserve's total Treasury security holdings -about the average proportion of Treasury holdings prior to the crisis. Once this proportion of bills is reached, we assume that the Desk buys coupon securities in addition to bills to maintain an approximate composition of the portfolio of one-third bills and two-thirds coupon securities.
2.3 Exit strategy assumptions for the balance sheet
We tie our modeling of the normalization of policy to the forecasted initial increase in the federal funds rate. We rely on the general principles for the exit strategy that the FOMC outlined in the minutes of the June 2011 FOMC meeting, but update our assumptions based on the Chairman's comments from his June 2013 press conference, which noted that the majority of FOMC participants do not want to sell MBS. Specifically, we assume that the reinvestment of securities ends six months before the federal funds lifts off from the zero lower bound. Although the FOMC guidelines note that reserve-draining tools will be used prior to raising the funds rate, to support the implementation of increase in the federal funds rate when appropriate, we abstract from this detail in the baseline projection.11 The key assumptions used in the baseline and alternative normalization projections are summarized in appendix table A1.
3 Baseline
With the assumptions in place, this section presents the baseline balance sheet and income projections. This scenario illustrates one path for monetary policy normalization that is generally consistent with current FOMC communications. Critical assumptions for this scenario, as well as all other scenarios, are found in appendix table A1.
3.1 Balance sheet
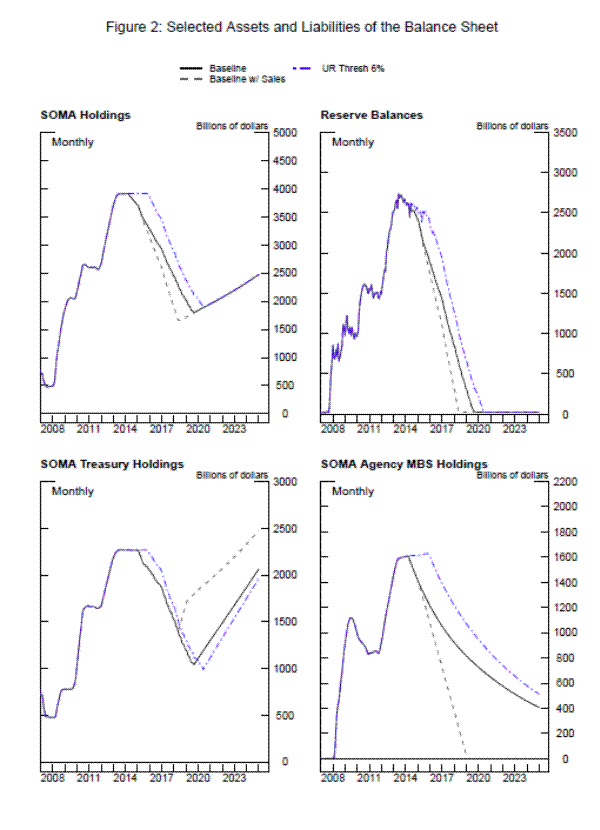
Figure 2 presents the projections of key balance sheet line items (the solid lines). As shown in the top left panel, SOMA holdings move up slightly through the middle of 2014 reflecting the continuation of the asset purchase program. In mid-2014, with no further purchases, the portfolio remains fairly steady at its mid-2014 level of $3.9 trillion. This portfolio is much larger than the size of SOMA immediately prior to the financial crisis, which was roughly $800 billion, and about $1.2 trillion above Federal Reserve notes in mid-2014. Securities holdings in excess of Federal Reserve notes can be considered one indicator for the presence of unconventional monetary policy in the economy.
After purchases end, under the assumption that the FOMC begins to allow all asset holdings to roll off the portfolio as the first step in the exit strategy, SOMA holdings should begin to decline. However, because the Federal Reserve sold or redeemed almost all of the Treasury securities with less than three years remaining maturity in the portfolio as part of the maturity extension program in 2011-2012, the portfolio holds very few shorter-dated Treasury securities at the time redemptions begin. Therefore, as shown in the bottom left panel, when roll off begins in February 2015, only a minimal amount of securities are maturing, and Treasury securities do not immediately decline. As shown in Table 2, Treasury securities that are maturing become sizeable in 2016 and then Treasury holdings decline quickly.
Table 2 - Projected maturing Treasury securities ($ billions)
| 2015:H1* | $1.9 |
| 2015:H2 | $1.6 |
| 2016 | $215.5 |
| 2017 | $185 |
| 2018 | $342.2 |
*Rolloffs begins in February 2015.
While Treasury securities do not decline until sometime after liftoff, MBS holdings, the bottom right panel, begin to contract immediately. Still, these holdings decline modestly, as prepayments are projected to be only about $20 billion per quarter around the time of lift off, and then slow further as rates rise. By the end of 2025, MBS holdings are roughly $400 billion. Recall that in Chairman Bernanke's press conference he noted "in the longer run, limited sales could be used to reduce or eliminate residual MBS holdings." This projection suggests residual holdings are still a sizable amount.
The decline in Treasury and MBS securities implies the size of the balance sheet is normalized in August 2020 with $1 trillion in Treasury securities holdings and $755 billion in MBS holdings. This is suggestive that unconventional monetary policy is putting downward pressure on interest rates through this date. Afterwards, SOMA begins to expand in line with the growth of currency and capital. Purchases of Treasury securities can be strategic to move the portfolio toward the FOMC's desired composition in the longer run.
The level of reserve balances throughout the projection roughly reflects the asset program minus currency in circulation. As shown in the top right panel, reserve balances top out at $2.7 trillion in May 2014, as the SOMA portfolio peaks with the end of asset purchases. Further out in the projection, the reduction in the size of the SOMA portfolio, along with the projected growth of Reserve Bank capital and Federal Reserve notes, results in declines in the level of reserve balances. Since we assume that reserve balances do not fall below $25 billion, by early 2019 the Desk again starts to reinvest maturing Treasury securities and begins purchases of Treasury securities.12 If one were to consider a higher level of steady-state reserve balances, then normalization would occur slightly earlier.
3.2 Income
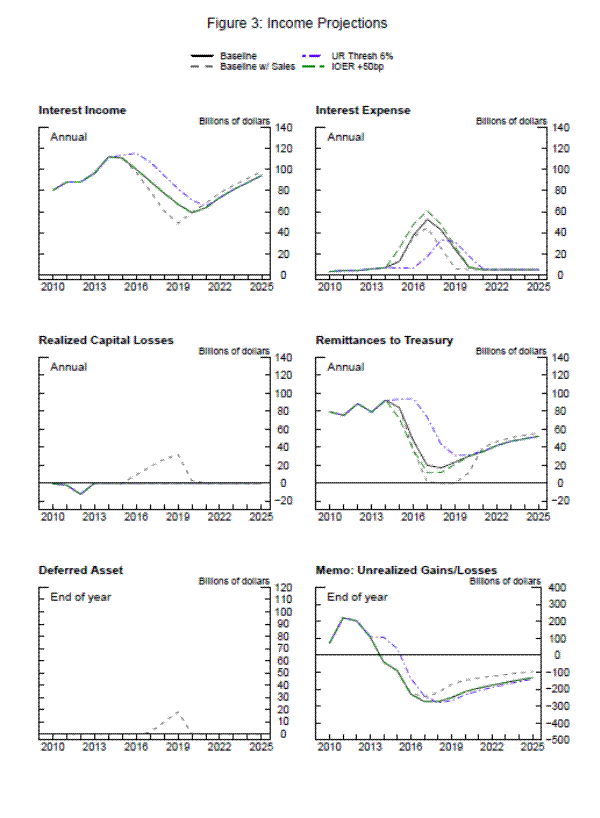
Figure 3 shows the path of Reserve Bank net income. Because of the large size of the SOMA portfolio, combined with the (relatively high) coupons on the securities, interest income is elevated through 2015.13 As the SOMA portfolio begins to contract with the assumed steps in the exit strategy, interest income declines through mid-2018. After reserve balances reach $25 billion, Treasury purchases resume, expanding the portfolio, causing interest income to rise.
Interest expense reflects both the level of the federal funds rate and the level of reserve balances. The federal funds rate in the Dealer survey begins to rise in 2015, and interest expense rises with it. However, in 2016, interest expense begins to moderate, as the decline in reserve balances more than offsets the rise in the federal funds rate.
On net, annual remittances to the Treasury remain elevated by historical standards through 2015, but then decline. The trough in remittances is $17 billion in 2018, a level that is not much lower than the $25 billion average remittances in the decade prior to the financial crisis. Cumulative remittances from 2009 through 2025 are nearly $910 billion, above the level predicted by a trend growth in remittances. Of course, the overall effect on the federal government's finances is more complicated than just the impact from Federal Reserve remittances. For example, if asset purchases provide meaningful economic stimulus, the increase in government revenues from faster economic growth could more than offset any lull in remittances. Further, if the asset purchases lower interest rates, the interest expense of the federal government is lower.
Although only realized gains or losses affect the Federal Reserve's income, we project the unrealized gain or loss on the portfolio. Given the large SOMA portfolio and the projected rise in interest rates, under the baseline projections, the portfolio is in an unrealized loss position beginning at the end of 2014. This unrealized loss position continues to grow through the beginning of 2017, but subsequently diminishes as the portfolio shrinks through redemptions and sales.
3.3 Deferred asset
One aspect of Federal Reserve Bank accounting that will be important in some scenarios is the deferred asset. When Reserve Bank income is not sufficient to cover interest expense, realized losses, operating and other expenses, a deferred asset is created. For example, as shown on the H.4.1 Statistical Release from November 3, 2011, the Federal Reserve Bank of New York recorded a deferred asset that week and the subsequent week.14 The deferred asset reflects the amount by which earnings failed to cover expenses and, as a result, the amount of future earnings that must be withheld as a result. Put differently, if a Reserve Bank were to incur an overall loss, its capital would not fall, rather it would suspend remitting to the Treasury until such time as it had returned to positive earnings and had earned back any losses to date. This accounting concept is similar to deferred tax accounting for the private sector. A Reserve Bank deferred asset does not bear interest. Because there has never been a deferred asset of any meaningful size, there is little guidance as to the whether or not there is a limit to the potential size of the asset. It may be plausible to assume that it would not be allowed to exceed the value of all future earnings, possibly in present discounted terms, given the fact that it is paid down through future earnings. As will be clear in these projections, a scenario that would result in a deferred asset in excess of the present value of future earnings is difficult to contemplate.
Most other central banks do not record deferred assets and instead use different accounting policies. For example, many central banks smooth remittances each year, by transferring an average amount of net income back to the government and saving the "excess" net income for times with negative shocks. Other central banks allow for negative remittances - that is, transfers from rather than to the government--if the loss is too large. The infusion of funds from their governments in cases of large negative shocks avoids deferred assets for these institutions. One example of a central bank with a form of a deferred asset is the Czech National Bank. This institution has operated for a number of years with a negative equity position and zero remittances.
4 Alternative normalization strategies
The baseline assumption of how the FOMC may choose to unwind unconventional monetary policy is one of many alternatives available to the Committee. Here we consider a few alternative normalization strategies and compare the effects on the balance sheet and income to the baseline projection, as well as note the implications for interest rates.
4.1 MBS sales
The June 2011 FOMC minutes laid out exit strategy principles, which included selling MBS over a period of three to five years at some date after the funds rate moved above the zero lower bound. In addition, FOMC members have expressed a desire to remove MBS from the portfolio, in part reflecting their view that the Federal Reserve should minimize the extent to which the Federal Reserve portfolio might affect the allocation of credit across sectors of the economy (FOMC, 2011).15 In this projection, we consider selling MBS holdings over four years, commencing six months after liftoff. Selling MBS after the funds rate starts to rise is not only a way to remove MBS from the portfolio, but also to reduce the amount of unconventional monetary policy in place at a time when the FOMC wants to firm monetary policy. A consequence of selling MBS is that the Federal Reserve will realize capital loses, reflecting selling relatively low coupon MBS in an environment with rising interest rates. While this strategy may result in no remittances to the Treasury and the booking of a deferred asset, it will not impede monetary policy implementation.
The implications of assuming MBS sales on the balance sheet are shown in figure 2. With MBS sales (the dashed lines), MBS holdings drop much faster than in the baseline. Consequently, the balance sheet with MBS sales normalizes in size around May 2019, implying that unconventional monetary policy is unwound one year earlier than in the baseline.
The income projection is a bit different from the baseline. Because of MBS sales, as shown in Figure 3, there are less securities in SOMA and so interest income is lower in the medium term than in the baseline. Interest expense is also lower, because of the reduction in reserve balances. Under this path of interest rates, with sales come capital losses.16 Over the four-year sales period, February 2016 to January 2020, these losses average roughly $18 billion per year. Putting the pieces together, remittances fall to zero from 2018 through 2019, and a deferred asset is booked. That is, when earnings are insufficient to cover costs resulting in an -an operating loss in some period, no funds are remitted until earnings, through time, have been sufficient to cover that loss. As explained above, the deferred asset is the value of the earnings that will be retained to cover this loss and is booked as a negative liability on the Federal Reserve's balance sheet under the line item "Interest on Federal Reserve notes due to the U.S. Treasury." Cumulative remittances from 2009 to 2025 are $840 billion, about $65 billion less than in the baseline.
Of course, zero remittances does not mean the Federal Reserve cannot conduct monetary policy. In fact, other central banks have operated with losses. For example, the Swiss National Bank experienced an operating loss in 2008 and 2010, as a result of their currency interventions in support of the Swiss Franc.17 Despite these losses, the ability of the Swiss National Bank to influence monetary conditions was relatively unaffected.
Overall, there are tradeoffs of implementing this normalization policy. MBS sales will remove credit allocation to the housing sector and return monetary policy to normal operations more quickly than the baseline. There will be, however, a noticeable impact on Federal Reserve income from this policy. Some commentators, (such as Greenlaw et al. (2013)) have suggested that very low or zero remittances may involve negative political pressure. It may also be the case that selling seasoned MBS with coupons that are noticeably different than prevailing market rates might risk introducing illiquidity or volatility into fixed-income markets.
4.2 Unemployment rate threshold of 6 percent
Since December 2012, the FOMC has provided forward guidance about the federal funds rate in terms of a threshold for the unemployment rate. The FOMC statement explicitly notes that the funds rate will remain in "this exceptionally low range ...at least as long as the unemployment rate remains above 6-1/2 percent...." In his June 2013 press conference, Chairman Bernanke opened up the possibility that the FOMC might lower the threshold. Here, we consider the impact of lowering the threshold to 6 percent.
Lowering the threshold affects our projections in two ways. First, all else equal, the lower threshold will delay the timing of the liftoff of the federal funds rate. Under our assumptions regarding the timing of stopping of reinvestment, the contour of the balance sheet will change, delaying the decline in the portfolio and therefore the normalization of the size of the balance sheet. Second, the delay in lift off alters the interest rate path, which affects income. Of course, a critical question is how fast will rates rise after liftoff, during the critical period when reserve balances are still elevated and interest expense is sizable. In our analysis, we hold the federal funds rate at the lower bound until the Blue Chip forecast for the unemployment rate falls below 6 percent.18 This implies lift off in mid-2017, compared to August 2015 in the baseline. We assume the funds rate moves up at the same pace as the baseline scenario, as illustrated in Figure 1. We also assume that rolloff begins 6 months before liftoff, delaying the start to roll off by six quarters from the baseline. The 10-year yield is adjusted by a simple approximation of the expected change in the rate as implied by the expectations hypothesis. That is, we lower the 10 year yield by the average decrease in the path of the federal funds rate over the next 40 quarters.
Figure 2 illustrates the evolution of the balance sheet (dashed-dotted lines). The delayed start to stopping reinvestment implies larger MBS holdings throughout the projection period, with about $500 billion in holdings at end-2025.19 For Treasury securities, however, the delayed start to allowing the securities to roll off the portfolio when they mature is not as dramatic, reflecting the fact that the MEP resulted in few securities maturing in 2015 (see Table 2). Hence, projected Treasury holdings in the medium term are not that different from the baseline. Of course, later in the period, Treasury holdings are less than the baseline since there are more MBS holdings in this scenario. Taken together, the evolution of the securities holdings implies normalization of the size of the balance sheet is delayed by 10 months relative to the baseline, implying a longer period for unconventional monetary policy to be in place.
Figure 3 shows that this policy would boost remittances to the Treasury by a sizable amount. Interest income is boosted through the medium run by the higher securities holdings. Interest expense is generally lower than the baseline, reflecting the fact that delayed start to the rise in the federal funds rate allows more Treasury securities to roll off the books and reduce reserve balances faster once the federal funds rate rises. These two factors imply that remittances are much higher through the medium term, with a trough of roughly $30 billion. Cumulative remittances are $1,052 billion, $144 billion more than the baseline. This scenario shows that if the FOMC chose to lower the threshold, for whatever reason, unconventional monetary policy would be unwound a bit more slowly, while remittances would be boosted relative to the baseline scenario. Again, MBS holdings would be sizable at the end of 2025.
4.3 Reserve-draining tools
So far, our analysis has assumed that the Federal Reserve has not engaged in any active liability management, and as a result, reserve balances passively decline as securities mature and roll off the portfolio. As noted in the June 2011 exit principles, the Committee may elect to incorporate liability management tools to reduce or "drain" reserve balances into its exit strategy in order to support conditions in which the federal funds rate trades near the intended target policy rate. Tools that could be used to drain reserve balances include reverse repurchase agreements and term deposits. While these operations would not alter the overall size of the portfolio, they would affect the composition of the Federal Reserve's liabilities, leaving less reserve balances and more of these other items.
If the Federal Reserve were to use draining operations, there would be the possibility that the interest expense on liabilities would increase, as counterparties would demand a higher rate of return on a financial instrument with potentially a longer maturity or less liquidity than reserve balances. To illustrate the point, we assume that all liabilities pay 50 basis points above IOER, the extreme. This scenario is calibrated to a one standard deviation of the historical spread between the federal funds rate and selected one- and three-month money market rates.
The size of the balance sheet is unchanged in this scenario, though reserve balances would fall 1:1 with the use of term deposits and reverse repurchase agreements. Interest expense would rise, with an increase of 50 basis points per each dollar drained. Assuming all reserve balances are drained, an extreme example, as shown in table 3 and figure 3, even in this case, overall remittances are only marginally affected. This result is because the balance sheet is shrinking at the time interest expense is rising. The impact of higher costs is modest and reduces cumulative remittances by about a $40 billion. Given the magnitude of the other costs and revenues, the expense associated with draining tools appear to be relatively modest.
Table 3 - Projected Remittances, $ billions
| 2015 | 2016 | 2017 | 2018 | 2019 | 2020 | Cumulative 2009-2025 | |
| Baseline | 84.1 | 47.5 | 19.7 | 17.1 | 23.3 | 30.2 | 908.9 |
| Costly Draining* | 71.6 | 37.2 | 11.8 | 11.8 | 20.8 | 29.9 | 869.8 |
*Draining tools implemented on all reserve balances from liftoff to when reserve balances are normalized.
5 Interest rate sensitivity
To illustrate the sensitivity of our projections to the interest rate path, we consider two alternative scenarios - with and without MBS sales--where interest rates are 200 basis points higher after liftoff than in the baseline projection. This shock to interest rates will not have a meaningful impact on the size of the balance sheet; hence, the implications for the unwinding of unconventional monetary policy are basically unaffected. However, higher interest rates affect Federal Reserve income. The results will highlight the point discussed in the December 2012 minutes: "Depending on the path for the balance sheet and interest rates, the Federal Reserve's net income and its remittances to the Treasury could be significantly affected during the period of policy normalization."
Figure 1 shows the projection for the higher interest rate scenarios (the dashed line). The federal funds rate and ten-year Treasury yield rise at a faster pace at lift off, and after one year are 200 basis points higher than the baseline rates over the remainder of the projection In the baseline interest rate projection, the ten-year Treasury yield rises by 1 percentage point between end-2014 and end-2016. By contrast, the 200 basis point shock implies the ten-year Treasury yield is increasing by 3 percentage points over those two years.
There are a couple of ways to put the size of this shock in perspective. To start, this size shock is 1.2 percentage points above the average forecast of the top 10 highest respondents in the June 2013 Blue Chip survey (roughly 20 percent of the sample), and thus is probably comfortably above most market participants' interest rate projections. In addition, for a historical comparison, from 1978 to present, the standard deviation of the two-year change in the ten-year Treasury yield is 1.6 percentage points. As a result, this higher-interest rate scenario should be seen as a somewhat unlikely scenario, but not an implausible one. Of course, to the extent that inflation expectations have become better anchored through time, this increase in interest rates may be even less probable than the historical record may suggest.
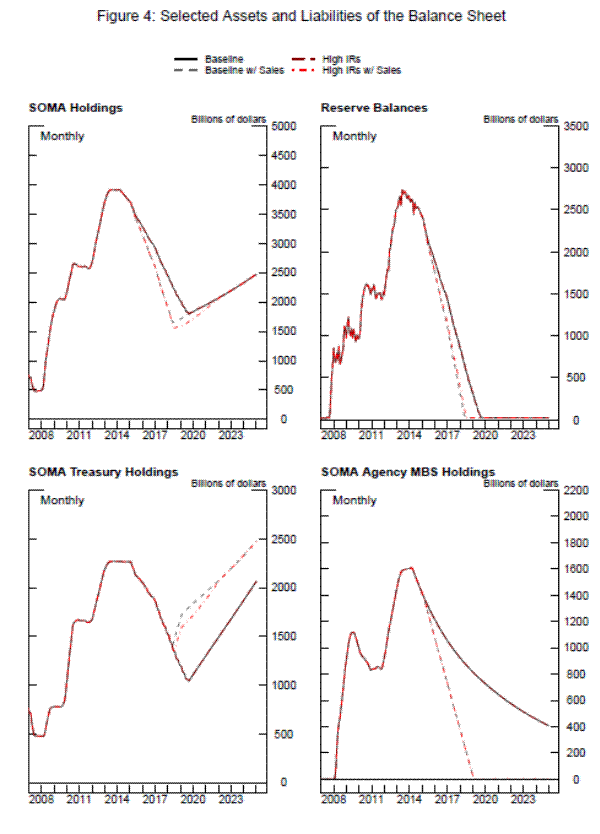
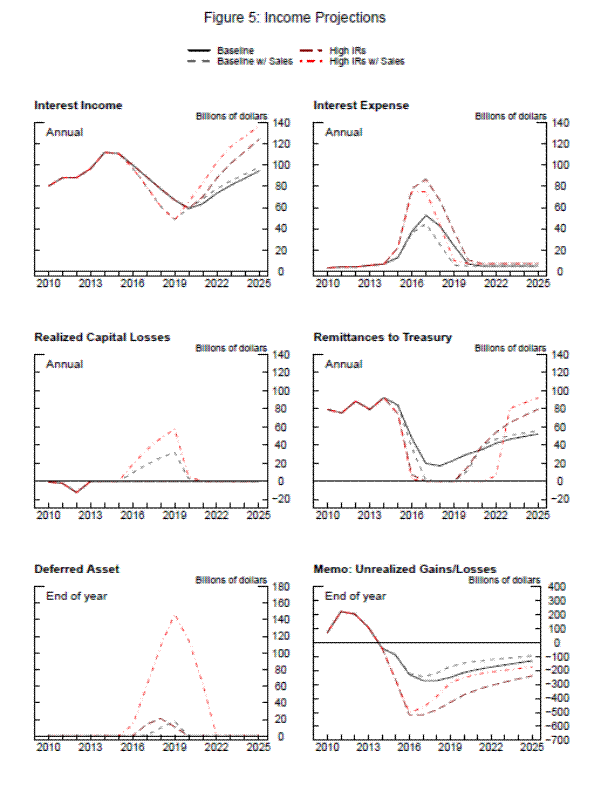
Focusing on the baseline, no MBS sales scenario, Figure 4, the interest rate shock does not materially change the Federal Reserve's balance sheet projections.20 The income projection, as shown in Figure 5, does change, however. The higher federal funds rate implies greater interest expense. Once combined with noninterest income and expenses, remittances to the Treasury fall to zero for a few years and a deferred asset is booked for 2017 through 2019. Cumulative remittances from 2009 to 2025 are $869 billion, about $40 billion less than in the baseline.
Turning to a scenario where MBS are sold, the higher interest-rate path does not change the balance sheet by much, but with higher interest expense and larger capital losses, a deferred asset peaks at nearly $150 billion. Moreover, remittances to the Treasury are halted for 6½ years. Cumulative remittances from 2009 to 2025 are $805 billion, about $100 billion less than in the baseline. Of course, at the June 2013 post-FOMC press conference, Chairman Bernanke noted "a strong majority now expects that the Committee will not sell agency mortgage-backed securities during the process of normalizing monetary policy." Therefore, this scenario is unlikely to play out under current expectations.
These sensitivity scenarios illustrate that in some circumstances the Federal Reserve could have years with no remittances to the Treasury and a deferred asset on its books. It is important, however, that these scenarios be viewed within a macroeconomic framework. As noted above, to the extent that asset purchases are effective in stimulating the economy, overall government revenues would be boosted on net, despite the capital losses at the Federal Reserve. In addition, one should consider the Federal Reserve's remittances over the entire period of unconventional monetary policy. Overall, average annual remittances to the Treasury even in these shock scenarios remain well above the average annual remittances of $25 billion recorded prior to the crisis.
6 Conclusion
In this paper, we have outlined a variety of ways the FOMC may unwind the unconventional monetary policy that it has instituted over the past several years. The different policies have implications for the length of time unconventional policy is in place, the composition of the Federal Reserve's balance sheet for many years to come, and remittances to the Treasury. The Federal Reserve's balance sheet is substantially larger than it had been historically and will remain elevated for some time. How fast unconventional monetary policy unwinds depends on FOMC actions, some possibilities of which we outlined here.
7 Bibliography
Board of Governors of the Federal Reserve System. 1976. Banking and Monetary Statistics, 1914-1941.
Carpenter, Seth, Ihrig, Jane, Klee, Elizabeth, Boote, Alexander, and Quinn, Daniel. 2013. "The Federal Reserve's Balance Sheet and Earnings: A Primer and Projections," Finance and Economics Discussion Series no. 2013-1, Federal Reserve Board, January.
Chung, Hess, Laforte, Jean-Philippe, Reifschneider, David, and Williams, John C. 2011. "Have We Underestimated the Likelihood and Severity of Zero Lower Bound Events?" Federal Reserve Bank of San Francisco Working Paper 2011-01, January.
Edwards, Cheryl E. 1997. "Open Market Operations in the 1990s," Federal Reserve Bulletin, p. 859-874.
Federal Reserve Bank of New York. 2013. "Domestic Open Market Operations in 2012," available for download at http://www.newyorkfed.org/markets/Domestic_OMO_2012_FINAL.pdf
Garbade, Kenneth D., Partlan, John C., and Santoro, Paul J. 2004. "Recent Innovations in Treasury Cash Management," Current Issues in Economics and Finance, Federal Reserve Bank of New York, vol. 10, no. 11, November.
Greenlaw, David, Hamilton, James D., Hooper, Peter, and Mishkin, Frederic. 2013. "Crunch Time: Fiscal Crises and the Role of Monetary Policy," February 22.
Gurkayank, Refet, Sack, Brian, and Wright, Jonathan. 2007. "The U.S. Treasury yield curve: 1961 to the present," Journal of Monetary Economics, p. 2291-2304, November.
Ihrig, Jane, Klee, Elizabeth, Li, Canlin, Schulte, Brett, and Wei, Min. 2012. "Expectations about the Federal Reserve's Balance Sheet and the Term Structure of Interest Rates," forthcoming Federal Reserve Finance and Economics Discussion Series paper.
Judson, Ruth, and Porter, Richard. 1996. "The Location of U.S. Currency: How Much is Abroad?", Federal Reserve Bulletin, vol. 82, p. 883-903, October.
Krishnamurthy, Arvind, and Vissing-Jorgensen, Annette. 2011. "The Effect of Quantitative Easing on Interest Rates: Channels and Implications for Monetary Policy," Brookings Papers on Economic Activity, Fall.
Li, Canlin, and Wei, Min. 2013. "Term Structure Modeling with Supply Factors and the Federal Reserve's Large-Scale Asset Purchase Programs," International Journal of Central Banking, vol. 9, no. 1, pp. 3-39.
Meltzer, Allan. 2010. A History of the Federal Reserve, Volume 2, 1951-1986, University of Chicago Press.
Rudebusch, Glenn D. 2011. "The Fed's Interest Rate Risk," Economic Letters, Federal Reserve Bank of San Francisco, April 11.
Table A1 - Key assumptions of the projections
| Assumption | Baseline | Baseline w/ Sales | 6.0% UR Threshold |
|---|---|---|---|
| Current Portfolio Strategy: Agency reinvestments | Agency MBS | Agency MBS | Agency MBS |
| Treasury Purchases: Total Amount (2013-2014) | $610 billion | $610 billion | $610 billion |
| Treasury Purchases: Jan-13 to Nov-13 | 45 | 45 | 45 |
| Treasury Purchases: Dec-13 | 30 | 30 | 30 |
| Treasury Purchases: Jan-14 to Feb-14 | 25 | 25 | 25 |
| Treasury Purchases: Mar-14 | 15 | 15 | 15 |
| Treasury Purchases: Apr-14 to May-14 | 10 | 10 | 10 |
| Treasury Purchases: Jun-14 | 0 | 0 | 0 |
| MBS Purchases: Total Amount (2013-2014) | $535 billion | $535 billion | $535 billion |
| MBS Purchases: Jan-13 to Nov-13 | 40 | 40 | 40 |
| MBS Purchases: Dec-13 | 30 | 30 | 30 |
| MBS Purchases: Jan-14 to Feb-14 | 25 | 25 | 25 |
| MBS Purchases: Mar-14 | 15 | 15 | 15 |
| MBS Purchases: Apr-14 | 0 | 0 | 0 |
| Exit Strategy: Fed Funds liftoff | Aug-15 | Aug-16 | Jun-17 |
| Exit Strategy: Redemptions start | Feb-15 | Feb-15 | Dec-16 |
| Exit Strategy: Sales start | N/A | Feb-16 | N/A |
| Exit Strategy: Sales end | N/A | Jan-20 | N/A |