
Board of Governors of the Federal Reserve System
International Finance Discussion Papers
Number 815, August 2004--Screen Reader Version*
Look at Me Now: The Role of Cross-Listing in Attracting U.S. Investors
NOTE: International Finance Discussion Papers are preliminary materials circulated to stimulate discussion and critical comment. References in publications to International Finance Discussion Papers (other than an acknowledgment that the writer has had access to unpublished material) should be cleared with the author or authors. Recent IFDPs are available on the Web at http://www.federalreserve.gov/pubs/ifdp/. This paper can be downloaded without charge from the Social Science Research Network electronic library at http://www.ssrn.com/.
Abstract:
We use a comprehensive 1997 survey to examine U.S. investors' preferences for foreign equities. We document a variety of firm characteristics that can influence U.S. investment, but the most important determinant is whether the stock is cross-listed on a U.S. exchange. Our selection bias-corrected estimates imply that firms that cross-list can increase their U.S. holdings by 8 to 11 percent of their market capitalization, roughly doubling the amount held without cross-listing. All else equal, we find that firms experience smaller increases in U.S. shareholdings upon cross-listing if they are Canadian, from English speaking countries, are members of the MSCI World index, or had higher quality accounting standards prior to cross-listing. We argue that these findings suggest that improvements in information production explain U.S. investors' attraction to foreign stocks that cross-list in the United States.
Keywords: Cross-Listing, ADR, Home Bias, Selection Bias
JEL Classification: G11, F21, C35
*Ammer, Smith, and Warnock are staff economists in the Division of International Finance of the Board of Governors of the Federal Reserve System. Holland is a Ph.D. candidate at the Haas School of Business, University of California at Berkeley. Smith is visiting at the Carlson School of Management, University of Minnesota and Warnock is visiting at the Darden Graduate School of Business Administration, University of Virginia. The authors thank Christa Bouwman, Mark Carey, Greg Nini, Mark Seasholes, Bent Sorensen, Mark Spiegel, Michael Weisbach, and seminar participants at Binghamton University (SUNY), Darden Business School, European Central Bank, Federal Reserve Board, Federal Reserve System SCIEA Meetings, Stockholm Institute for Financial Research, and University of Houston for helpful comments; Nathanael Clinton for extracting and assembling components of the data that came from Datastream; and Frank Sinatra for inspiring the title. The views expressed in this paper are solely the responsibility of the authors and should not be interpreted as reflecting the views of the Board of Governors of the Federal Reserve System or of any other employee of the Federal Reserve System. The statistical analysis of security-level data on U.S. investors' holdings reported in this study was conducted at the International Finance Division of the Board of Governors of the Federal Reserve System under arrangements that maintained legal confidentiality requirements. Email addresses for the authors are [email protected], [email protected], [email protected], and [email protected]. Return to text
1 Introduction
The willingness of outside investors to hold a firm's equity could depend on a variety of factors. At a basic level, investors need to be aware that the firm exists before holding its stock. Investors might also want at least rudimentary information about the stock and the institutional environment in which it trades. For instance, investors may care about how the stock covaries with the rest of their portfolio, the amount and quality of information disclosed by the firm, how safe their investment is in the hands of firm management, and whether or not they face an information disadvantage relative to other investors.
At the same time, firms seeking to raise capital or improve the valuation of their existing shares will have an incentive to mitigate the frictions that make investors reluctant to invest. For instance, Merton (1987) argues that firms can improve their value by broadening the group of investors that have information about their stock, a process he terms ``expanding the investor base.'' Recent theories have extended Merton's intuition by arguing that firms can attract investor interest in at least three ways: by improving disclosure practices, by making themselves more familiar in general, or by committing to good corporate governance.
To better understand the factors that influence the willingness to hold equity shares, this paper uses a unique and comprehensive dataset to examine the extent to which publicly traded firms domiciled outside the United States are able to attract U.S. investors. Such an examination is pertinent because the well-known ``home bias'' implies that U.S. investors are generally reluctant to hold foreign equities (French and Poterba, 1991; Tesar and Werner, 1995). The dataset, which is based on a U.S Treasury/ Federal Reserve Board survey of financial institutions and custodian banks, includes virtually all U.S. holdings of foreign equity as of year-end 1997. We focus on the subset of 12,236 publicly listed firms from Worldscope for which we can also gather firm-specific data.
Consistent with the presence of home bias, we find that for the vast majority of foreign firms--those that are not cross-listed on U.S. exchanges--U.S. investment is quite low, averaging only 3 percent of firm market capitalization. But there is considerable variation in U.S. holdings around this average. For example, of the 11,755 firms in our sample that are not cross-listed in the United States, more than one-quarter attract no U.S. investment, yet U.S. investors also hold more than 20 percent of the market capitalization in over 200 of the non cross-listed firms. Among the non cross-listed stocks, we show that U.S. investors favor large firms, nonfinancial enterprises, and members of the Morgan Stanley Capital International (MSCI) World index. U.S. investments are also higher in firms that pay dividends, maintain high quality accounting standards, have high market-to-book values, and come from countries in which U.S. residents face low dividend withholding tax rates.
The most important determinant of U.S. investor interest, however, appears to be whether or not the stock cross-lists on a U.S. exchange. U.S. investors hold 17 percent of the outstanding shares of the average cross-listed firm, 14 percentage points greater than their holdings of the average foreign firm that is not cross-listed. Taken alone, this difference suggests that cross-listing in the United States substantially increases the willingness for U.S. investors to purchase foreign equity.1
But this simple comparison suffers from two potentially significant empirical problems, either of which could cause the cross-listing effect to be systematically overstated. First, the average holdings of cross-listed firms could be biased by selection if, as is likely, a firm's propensity to cross-list on a U.S. exchange is correlated with other characteristics of the firm that affect U.S. investors' holding decisions. In particular, firms that cross-list in the United States may tend to be of the types that U.S. investors would hold anyway, whether they were cross-listed or not. Second, the simple comparison does not incorporate the possibility that a firm might be induced to cross-list in the United States for the specific purpose of increasing U.S. investor holdings, perhaps to expand its investor base. In other words, the cross-listing decision could be endogenous with respect to U.S. portfolio decisions, with causation between cross-listing and U.S. holdings running in both directions.
To address these empirical challenges, we jointly model the cross-listing and holding decisions using a system of simultaneous equations adapted from a study of unionization and wages by Lee (1978). This framework not only allows us to correct for the effects of selection bias, but also produces structural estimates of the relation between holding and listing. Thus, we obtain consistent estimates of the average cross-listing effect, while also characterizing the influence of U.S. portfolio preferences on the cross-listing decision. We buttress the parametric results by also estimating the cross-listing effect using semi-parametric propensity score matching (or ``p-matching'') and non-parametric ``difference-in-differences'' methods of selection-bias adjustment.
The three estimation strategies produce consistent results. U.S. investors would have held an average of 6 to 8 percent of the market capitalization of U.S.-listed firms even if these firms had not listed in the United States, distinctly more than the average 3 percent held in unlisted firms. Nonetheless, after adjusting for selection bias, firms that cross-list experience an economically and statistically significant increase in U.S. holdings, equivalent to 8 to 11 percent of the firms' equity. All three estimators suggest that cross-listing roughly doubles U.S. investment in a foreign stock.
Given the bias-corrected estimates, we next turn to the question of what drives the cross-listing effect. We conjecture that, holding all else constant, firms receiving the largest increase in U.S. holdings from cross-listing are ones in which cross-listing reduces impediments to investment. We exploit this intuition to investigate several hypotheses about the benefits to cross-listing, particularly in the United States. Our findings support the idea that cross-listing improves investor access to value-relevant information about foreign stocks which, in turn, increases their attractiveness to investors. Specifically, firms most likely to gain from an enriched information environment experience statistically large increases in U.S. investment, conditional on listing. For example, firms that use poor accounting practices, or that are from countries with weak accounting standards, experience a relatively large cross-listing effect, suggesting that requisite U.S. disclosures reduce the financial opacity of these companies. We also consider the possibility that cross-listing improves the name recognition of foreign stocks among U.S. investors that favor familiarity. However, using a company's foreign sales as a proxy, we find no evidence that less familiar stocks enjoy a relatively larger cross-listing effect. Finally, our results provide little support for the idea that firms from countries with weak shareholder protection increase their attractiveness by ``bonding'' themselves to U.S. securities laws. Indeed, U.S. investors actually place a greater weight on cross-listed firms from countries providing stronger protections to minority shareholders, as if they viewed a U.S. listing as a complement to such provisions, rather than a substitute.
We also use our parametric model to examine whether U.S. investor interest affects a firm's decision to cross-list in the United States. We estimate that an anticipated increase in U.S. share ownership of one percentage point increases a firm's cross-listing probability by roughly 0.15 percent, consistent with the idea that an anticipated expansion in investor base positively influences cross-listing decisions. However, the standard errors on this estimate are typically large. Further, we document a positive, though statistically weak, relation between the probability of cross-listing and the level of U.S. shareholdings in the firm without cross-listing. We interpret this result as implying that firms cross-list in part to service their existing shareholder clientele.
Our paper is related to three areas of recent study. The first, which includes the studies of Kang and Stulz (1997), Grinblatt and Keloharju (2000), Dahlquist and Robertsson (2001), and Cai and Warnock (2004), examines the portfolio choices of foreign investors within a specific national stock market. Our paper represents a multi-market extension of these papers in which U.S. residents are the ``foreign'' investors in each of many markets. Indeed, U.S. residents are formidable global investors, representing about half of all global non-domestic investment in non-U.S. stocks. A second branch of the literature focuses on U.S. investment behavior in foreign companies as a means for gaining insight into causes of home bias.2 Examples include Ahearne, Griever, and Warnock (2004) and Dahlquist, Pinkowitz, Stulz, and Williamson (2003), which use the U.S. Treasury/Federal Reserve Board survey at the country level; Bradshaw, Bushee, and Miller (2004), which exploits Securities and Exchange Commission (SEC) Form 13(f) filings; Aggarwal, Klapper, and Wysocki (2003), which examines emerging-market allocations of U.S. mutual fund managers; and Edison and Warnock (2004), which examines U.S. investment in nine emerging markets. Like our paper, these works conclude that cross-listing on a U.S. exchange is associated with attenuated home bias. However, these studies are conducted on limited data sets, generally ignore sample selection problems, and do relatively little to investigate the underlying causes of the link between cross-listing and U.S investment. A third set of papers, which includes the studies of Pagano, Röell, and Zechner (2002), Lang, Lins, and Miller (2003), Doidge, Karolyi, and Stulz (2004), and Sarkissian and Schill (2004) examine the reasons that firms cross-list. Our paper provides new insight into the motivations for cross-listing by exploring the interaction between a firm's decision to cross-list and U.S. investors' decision to purchase its shares.
We organize the remainder of the paper as follows. The next section of the paper provides a description of the data, including basic summary statistics. Section 3 introduces our simultaneous equation model of cross-listing and U.S. holdings, and lays out the Lee (1978) estimation framework. Section 4 explains our choices of instruments. The estimation results are reported in Section 5. Sections 6 and 7 focus on quantifying and explaining the cross-listing effect. The final section concludes.
2 Data Description
2.1 The U.S. Holdings Survey Data and Construction of U.S. Portfolio Share Measures
Our investigation begins with comprehensive security-level data on U.S. holdings of foreign stocks as of December 1997. The data are collected confidentially through benchmark surveys conducted jointly by the U.S. Treasury Department and the Federal Reserve Board.3 The surveys are sent to all U.S. custodians and U.S. institutional investors, including mutual funds, pension funds, insurance companies, endowments, and foundations. These institutions are required to report the foreign stock and bond holdings of all clients that are U.S. residents. Reporting on the survey is mandatory, and penalties may be imposed for noncompliance.
Custodians are the main source of information, covering 97 percent of the market value of the securities in the 1997 survey. Institutional investors report in detail on their ownership of foreign securities only if they do not entrust the safekeeping of these securities to U.S.-resident custodians. If they do use U.S.-resident custodians, institutional investors report only the names of the custodians and the amounts entrusted. Of the 1,209 U.S. financial institutions that reported data in the survey, 863 reported the names and amounts they had entrusted to U.S. custodians. The requirement that institutional investors identify their U.S.-resident custodians has the beneficial side effect of ensuring that all sizable U.S.-resident custodians holding foreign securities are included in the survey, because any custodian identified by an institutional investor is instructed to report. The requirement also makes it possible to check the survey for accuracy, as the amount of foreign holdings each custodian should report can be estimated by summing the amounts that institutional investors as a group have entrusted to each custodian.
Accurately pricing and categorizing the universe of foreign securities -370,000 records on equity holdings were collected in the 1997 survey - is difficult, as commercial sources on foreign securities are generally less complete than for U.S. securities, custodian data in asset surveys tend to have some errors and omissions, and unexpected local market quirks can lead to misinterpretations of reported data. In editing and cleaning the data, attempts have been made to cross-check the holdings data with other sources, although each of these complementary sources has its own problems.4
2.2 Sample Selection and Summary Statistics
We limit our investigation to U.S. holdings of non-U.S. companies tracked by Worldscope. This enables us to utilize the company financial and accounting information reported in Worldscope, and provides us with International Securities Identification Numbers (ISINs) for each of the company's outstanding securities. Obtaining the ISINs allows us to link more easily with other electronic databases, such as Datastream. We use the May 1999 release of Worldscope, which contains 1997 data on 13,445 non-U.S. companies domiciled in 52 different countries.
In our tests, we normalize firm-level U.S. holdings by the market capitalization (market value of equity) of the company. Datastream, which provides the broadest international coverage of market price data, is our primary source for firm-level market capitalizations. When a value is missing in Datastream, we turn to reports from Morgan Stanley, which provide reliable market data for companies included in the MSCI All-country World index, or Worldscope, which provides December market capitalizations for those companies that complete their fiscal year at the calendar year-end. We also use Morgan Stanley and Worldscope to cross-check the Datastream numbers for recording errors. In total, we are able to calculate market capitalization figures for 12,236 of the original 13,445 Worldscope firms.
We define two different measures of firm-level U.S. investor holdings. The first measure is constructed as the ratio of dollar holdings in a stock to the firm's market capitalization, and thus is equivalent to the proportion of shares held by U.S. residents. Our second measure uses a different denominator, an estimate of the stock's ``market float,'' the market value of shares that are not closely held by insiders. Dahlquist, Pinkowitz, Stulz, and Williamson (2003) argue that such closely held shares are unlikely to be made available to outside investors, because insiders receive benefits from control that are not reflected in a stock's price. We calculate market float by scaling market capitalization down by the figure given in Worldscope's ``closely held share'' field, which reports the fraction of equity owned by corporate officers, directors and their family members, individual shareholders with more than 5 percent holdings, other corporations, and by the firm's own pension funds and trusts. However, we first adjust these Worldscope figures to exclude the value of depositary institution holdings, which are sometimes mistakenly counted in the closely held fields.5 Because of missing data on insider holdings, we can calculate market float for only 8,528 of our original observations.
Table I reports the aggregate U.S. holdings share for firms in each of the 46 countries represented in our sample.6 Even at the national level, U.S. holdings shares vary considerably. As of the end of 1997, U.S. investors owned nearly a quarter of the market capitalization of Argentine firms, and about a fifth of the market in Finland, Ireland, the Netherlands, Hungary, and Mexico. Meanwhile, Americans held just 9 percent of the market capitalization for the 46 countries in aggregate, and less than 5 percent of Belgium, Greece, China, Colombia, and Taiwan. U.S. investor holdings also were relatively dispersed within the 46 countries, with non-zero stakes in 8,785 of the 12,236 stocks in the sample, ranging from very small firms to the world's largest non-U.S. companies.
Table II reports summary statistics for our market capitalization and market float samples. The Worldscope-based sample of 12,236 firms had an end-1997 market capitalization of $11,080 billion, representing more than 90 percent of the value of all non-U.S. equity (IFC, 1998). U.S. investors' $1,020 billion stake in these companies accounted for 88 percent of their total foreign equity holdings and 9.2 percent of the market capitalization of the companies. On a market float-adjusted basis, U.S. investors held 13.5 percent of the Worldscope companies. As noted by Dahlquist, Pinkowitz, Stulz, and Williamson (2003), the market-float adjustment accounts for some part of the observed home bias in U.S. holdings.
The bottom half of Table II breaks down the sample according to whether or not the sample firms are cross-listed on a U.S. exchange, defined to include both direct listings and American Depositary Receipts (ADRs) listed on the New York Stock Exchange (NYSE), NASDAQ, or American Stock Exchange.7 Of the 12,236 sample firms, 481 were cross-listed on a U.S. exchange at the end of 1997. U.S. investors held an (equal-weighted) average of 17.4 percent of the market capitalization of these firms, compared to an average stake of just 3.3 percent of the other 11,755 (not cross-listed) foreign firms; as a proportion of market float, the figures are 25.9 percent and 5.7 percent. Disentangling the underlying causes of this large difference between U.S. holdings of cross-listed and non cross-listed firms is the focus of the rest of the paper.
3 Simultaneous Determination of U.S. Cross-Listing and U.S. Holdings of Foreign Stocks
In this section, we introduce the methodology that allows us to simultaneously model the cross-listing and U.S. investment decisions. The underlying framework based on Lee (1978) provides a convenient and economically intuitive mechanism for addressing the two sources of endogeneity in our model.
3.1 Modeling the cross-listing decision
The first part of the joint estimation involves modeling a firm's decision to cross-list on a U.S. exchange. We motivate the decision by considering the potential benefits and costs of cross-listing.
One of the primary benefits that both practitioners and researchers cite as a reason for cross-listing is to increase the set of investors that can, at low cost, access information and trade shares in the firm.8 This in turn may improve risk sharing, pricing, and the liquidity of a firm's stock. Accordingly, firms that can increase their appeal to U.S. investors the most through a U.S. listing might have the strongest incentive to cross-list. Firms may also list in the U.S. to reduce institutional frictions associated with maintaining their existing investor base. For example, if a firm already has U.S. investors, it may cross-list to make it easier for those investors to manage their stock portfolios. Similarly, foreign firms with operations in the U.S. may also list in the United States to lower the cost of compensating U.S. employees with stock, or to improve their image among U.S. consumers.
There are both direct and indirect costs associated with listing in the United States that could make firms reluctant to cross-list. Most cross-listed firms face a host of direct registration, disclosure, and compliance costs. They must register with the U.S. Securities and Exchange Commission (SEC) and submit periodic filings that are in English and include financial statements reconciled to U.S. generally accepted accounting principles (GAAP). They must meet the listing requirements of the U.S. exchange, which are often stricter than those in the firms' home country, and pay both listing fees to the exchange and filing fees to the SEC. Firms that cross-list to raise new capital must also register their securities under the SEC 1933 Securities Act and the 1934 Exchange Act. One significant exception to these registration and disclosure requirements is granted to Canadian firms. Under the Multi-Jurisdictional Disclosure System (MJDS) agreement between the SEC and the Canadian Securities Administration, Canadian firms can cross-list on a U.S. exchange without conforming to U.S. GAAP and with only minimal reporting to the SEC.
Indirect costs include the commitments that cross-listed firms make to abide by U.S. regulations and law. Firms that violate exchange regulations risk fines and the threat of delisting. Those that violate SEC regulations face potential shareholder lawsuits and civil or criminal penalties under U.S. law. As noted by Doidge, Karolyi, and Stulz (2004), closely held firms may be especially reluctant to cross-list if the increased level of disclosure and legal oversight gives more power to minority shareholders.
Let
![]() represent
the net benefits that flow to firm
represent
the net benefits that flow to firm ![]() from cross-listing on a U.S exchange. We assume that
these benefits can be described by the following relation,
from cross-listing on a U.S exchange. We assume that
these benefits can be described by the following relation,
We do not observe
![]() . Instead,
we observe realizations of the indicator variable X
. Instead,
we observe realizations of the indicator variable X![]() ,
,
| (2) |
| (3) |
X
3.2 Modeling the holdings decision
The second part of our joint framework models U.S investor preferences for holding foreign equity. We consider a variety of factors that could influence the willingness of U.S. investors to invest in a foreign firm.
First, U.S investors may want fundamental information about a foreign stock before deciding to purchase it. The ability to obtain information about a company will depend, among other things, on the accounting and disclosure practices of the company. Therefore, U.S. investors may favor companies that provide an accurate and timely accounting of their financial performance (Leuz and Verrecchia, 2004), and may be attracted to foreign stocks domiciled in countries with forthright accounting practices (Lang, Lins, and Miller, 2003). Moreover, investors might obtain valuable insights from press and analyst coverage, so that firms that enjoy a greater media and analyst following may be preferred to firms that pass unnoticed (Baker, Nofsinger, and Weaver, 2002).
Second, U.S. investors may favor buying foreign stocks that are familiar. Huberman (2001), Barber and Odean (2003), Ackert, Church, Tomkins, and Zhang (2003), Kaniel, Li, and Starks (2003), and Grullon, Kanatas, and Weston (2004) present evidence suggesting that investor purchases of equity can depend on simple name recognition arising through product endorsements and branding, advertising, news coverage, or even abnormal trading volume. These papers attribute investment in familiar stocks to a behavioral motivation that is distinct from seeking better information about stock fundamentals.9
Third, U.S. investors may care about the safety of their investment in the hands of managers who operate outside U.S. borders. LaPorta, Lopez-de-Silanes, Shleifer, and Vishny (1999, 2002) document substantial cross-country variation in how well legal systems protect outside shareholders from expropriation by firm insiders. Durnev and Kim (2004), among others, show that the quality of corporate governance within a country can vary greatly across firms. Thus, U.S. investors could tilt their investments toward countries with strong legal protections of minority investors and seek out firms with a reputation for good corporate governance.
There are a variety of other factors that could influence U.S. preferences for investing in foreign stocks, including bankruptcy risk, tax considerations, and whether the stock is a component of a benchmark index. In Section 4 below, we detail the instrument choices that we adopt to capture factors that could influence the holdings decision. But first we describe the setup for the holdings equations and the procedure for estimating the simultaneous model.
Following Lee (1978), we specify two linear equations: One describes U.S. holdings for firms that are cross-listed in the United States and the other describes U.S. holdings for firms that are not cross-listed,
| (4) |
| (5) |
The instrument sets
Because the holdings variables ![]() and
and ![]() are measured as shares of a firm's equity
value, they are well-defined only over the range from zero to one.
This implies that (4) and (5) cannot be estimated
consistently using ordinary least squares because the limited range
induces dependence between the instruments Z
are measured as shares of a firm's equity
value, they are well-defined only over the range from zero to one.
This implies that (4) and (5) cannot be estimated
consistently using ordinary least squares because the limited range
induces dependence between the instruments Z![]() and
the residual.10 We
circumvent this problem by transforming the holdings data by the
inverse of the logistic function. However, because the inverse
logistic is defined only on the open
interval from zero to one, and we have a number of firms in our
sample with no reported U.S. holdings, we shift the domain of the
inverse logistic to the left by a small fixed amount, S,
and
the residual.10 We
circumvent this problem by transforming the holdings data by the
inverse of the logistic function. However, because the inverse
logistic is defined only on the open
interval from zero to one, and we have a number of firms in our
sample with no reported U.S. holdings, we shift the domain of the
inverse logistic to the left by a small fixed amount, S,
| (6) |
Figure 1 graphs the `` shifted'' F
| (7) |
| (8) |
3.3 Estimation
Lee (1978) proposes a multi-stage method for consistently estimating a system like ours in which a first-stage, reduced-form probit generates Heckman (1979)-type correction terms for the holdings equations (7) and (8). The corrected second-stage estimation of the holdings equations produces consistent estimates of the relation between the instruments and (transformed) holdings, and makes it possible to calculate fitted holdings values as a function of the instruments. The final stage of estimation involves using the fitted holdings for estimation of the structural probit in equation (1).
In order to implement the Lee (1978) estimation framework, we
need to make a few additional assumptions and a slight modification
to our specification. Both of these issues relate to the joint
statistical distribution of the residuals in the three equations.
First, the error terms from the listing equation (
![]() and the two holdings equations (
and the two holdings equations (
![]() must be
jointly normally distributed,
must be
jointly normally distributed,
| (9) |
where
| (10) |
Under assumption (9), the probit model implied by equations (10), (2), and (3) can be estimated jointly with the linear specifications in equations (7) and (8), as long as certain identification restrictions are met. Lee (1978) has shown that multi-stage estimation will produce estimates of structural parameters that are consistent in the presence of selection bias.
One advantage of this framework is that although we only observe
![]() for firms that
have a U.S. listing and
for firms that
have a U.S. listing and ![]() for firms that do not, we can use our
parameter estimates to make inferences about what U.S. holdings of
a firm's stock would have been had the firm made the counterfactual
choice about whether to cross-list. Furthermore, we can generate
estimates of the cross-listing effect--i.e., the impact of
cross-listing on U.S. holdings (
for firms that do not, we can use our
parameter estimates to make inferences about what U.S. holdings of
a firm's stock would have been had the firm made the counterfactual
choice about whether to cross-list. Furthermore, we can generate
estimates of the cross-listing effect--i.e., the impact of
cross-listing on U.S. holdings (
![]() --either unconditionally or
conditional on specific firm characteristics.
--either unconditionally or
conditional on specific firm characteristics.
As noted above, in the first stage of the Lee (1978)
methodology, the two holdings equations (7) and (8)
are substituted into the listing probit (10) to form a
reduced-form listing equation that can be estimated on a
stand-alone basis by numerical maximum likelihood. The set of
independent variables (Z![]() ) for the first-stage reduced-form
probit specification consists of all of the instruments in the
structural equations for listing and holdings:
) for the first-stage reduced-form
probit specification consists of all of the instruments in the
structural equations for listing and holdings:
| (11) |
We can write the first-stage equation as
| (12) |
where
| (13) |
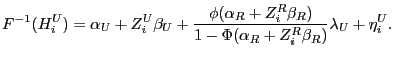
The estimates from the probit model embodied in equations (12), (2), and (3) can be used to construct the selectivity-bias correction in the holdings-equations residuals (
|
(14) |
where the variance of
|
(15) |
is often referred to as the `` inverse Mills ratio''. Estimates of the ratio form the basis for standard corrections for selectivity bias when inclusion in an estimation sample is contingent on a discrete outcome (see Heckman, 1979 or Maddala, 1983). Intuitively, the inverse Mills ratio accounts for the unobserved correlation between the listing decision and holdings. There is also a similar, but less frequently used correction for selectivity bias for the non-selected observations,
|
(16) |
The second stage of the Lee procedure involves estimating the holdings equations by ordinary least squares by rewriting them as
|
(17) |
and
|
(18) |
Note that
As noted by Lee (1978), it is possible to construct consistent
standard errors for equations (17) and (18) after
making a correction for heteroscedasticity associated with the
selectivity terms. However, inferences about the distribution of
the estimated parameters in the listing decision equation (10) are complicated by the use of the generated variables
E(F![]() Z) in the
final-stage probit estimation. Furthermore, for judgments about how
the cross-listing effect on U.S. holdings varies across different
types of firms (i.e., the conditional
cross-listing effect), we construct statistics that involve
parameter estimates from more than one equation. Accordingly, we
opt to estimate the distribution of the full set of model
parameters via non-parametric bootstrap simulations. Specifically,
for each of the three versions of the model we estimated, we
randomly drew 1,000 hypothetical samples with the same number of
observations (with replacement), re-estimating the full model and
computing the statistics of interest with each simulation.
Z) in the
final-stage probit estimation. Furthermore, for judgments about how
the cross-listing effect on U.S. holdings varies across different
types of firms (i.e., the conditional
cross-listing effect), we construct statistics that involve
parameter estimates from more than one equation. Accordingly, we
opt to estimate the distribution of the full set of model
parameters via non-parametric bootstrap simulations. Specifically,
for each of the three versions of the model we estimated, we
randomly drew 1,000 hypothetical samples with the same number of
observations (with replacement), re-estimating the full model and
computing the statistics of interest with each simulation.
4 Choosing Instruments for the Simultaneous Model
Identification of our model parameters depends on our ability to find at least some instruments that directly determine one of the two endogenous variables, but not the other. Our choices of which variables to exclude from which equation are based largely on informal theoretical considerations, but we draw wherever possible upon the relevant literature. For example, we hypothesize that the importance of a stock market within a country, as measured by stock market activity relative to the country's size, should not influence U.S. investor preferences for holding stocks from that country. However, a company operating within a country may ``outgrow'' its home market if that market is relatively small, meaning that the size or activity of the home market could directly influence a firm's incentives to cross-list. Thus, a measure of firm's home-country stock market activity relative to size can help identify our cross-listing specification. Conversely, a country's dividend tax policy, or whether or not it has a tax treaty with the United States, should not influence a firm's decision to list here, beyond the implied impact that the policy would have on holdings. Thus we exclude the tax treaty withholding rate from the listing equation, but include it in the holdings equations.
We briefly motivate the choice of the variables below. Detailed definitions of all of these instruments, as well as all of the remaining variables, appear in the Appendix Table A-I.
Two of the instruments in ![]() are unique to the cross-listing
equation:
are unique to the cross-listing
equation:
Home-country trading volume / GDP. The benefits from cross-listing might be particularly high for firms that quickly `` outgrow'' their underdeveloped home equity markets.
Germanic language dummy. The direct costs of complying with U.S. regulations may be lower for managers who are more comfortable with the English language. We conjecture that native speakers of other Germanic languages will find it easier to produce information in English than non-Germanic speakers. (The variable is set equal to one for firms domiciled in a country in which Danish, Dutch, English, German, Norwegian, or Swedish is an official language).
Five other of the instruments in ![]() also are used in
also are used in ![]() and
and ![]() in the U.S. holdings
equations, because it seems plausible for them to have a direct
influence on both the listing and holdings decisions:
in the U.S. holdings
equations, because it seems plausible for them to have a direct
influence on both the listing and holdings decisions:
Proportion of shares held by insiders. Both holdings equations contain the proportion of shares held by insiders and large blockholders to account for the possibility that closely held shares reduce the supply of available float. As in Doidge, Karolyi, and Stulz (2004), the variable also proxies for the cost of relinquishing private control benefits through increased disclosure and monitoring associated with cross-listing. Investors may shy away from firms that are closely held, fearing the power of insiders to expropriate firm resources at the expense of minority shareholders.11
Log of total (book) assets. This standard measure of firm size will be important for the listing decision if there are economies of scale in the direct costs of listing, including regulatory compliance and accounting disclosure. We allow firm size to influence holdings behavior, as well, because it may be easier to obtain information on larger firms, and these firms may be in general be more familiar to U.S. investors. In addition, pension funds, mutual funds, and other large investors are often constrained by liquidity considerations to investing in only relatively large firms.
Financial firm dummy. This is included for two reasons. First, with log assets also included as an instrument, we use it as a control for systematic differences between the typical level of log assets for financial and non-financial firms. In the heavily-leveraged financial-sector, asset values are likely to overstate the true size of financial firms relative to non-financials. Beyond the different interpretations of size, financial firms hold assets that could be more difficult to value than that of non-financial firms, are subject to more regulatory, rather than public disclosure, and often view public information disclosures to be potentially harmful to their business.12
Canada dummy.
Cross-listing should be less costly for Canadian firms. Because of
the bilateral MJDS agreement, disclosure and reporting requirements
for Canadian firms are lax compared to non-Canadian firms. All else
equal, this may reduce the transparency of cross-listed Canadian
firms relative to other cross-listed firms, so we include this
dummy in ![]() . But
institutional similarities and ties within North America may make
Canadian firms that are not
cross-listed more familiar and transparent to U.S. investors, so we
also include the dummy in
. But
institutional similarities and ties within North America may make
Canadian firms that are not
cross-listed more familiar and transparent to U.S. investors, so we
also include the dummy in ![]() .
.
National accounting quality index. We posit
that firms from countries with weak accounting standards will find
it more costly to prepare financial statements in accordance with
U.S. GAAP. Similarly, for firms that have not cross-listed and
reconciled their financial statements to U.S. GAAP, weak accounting
standards may be a deterrent to U.S. investors, so we include this
index in ![]() (but
not in
(but
not in
![]() .13
.13
The following instruments are included in ![]() and
and ![]() in the holdings equations,
but are not in
in the holdings equations,
but are not in ![]() :
:
Market value / Book value. We take low market value to be a rough indicator of financial distress, which tends to increase conflicts of interests among stakeholders in the firm in a way that might be particularly problematic for cross-border minority investors.
MSCI member dummy. MSCI index members are selected on the basis of liquidity, size, and market representation. U.S. investors may prefer more liquid stocks and stocks that are tracked by a popular market index for a number of reasons. Illiquidity can reflect asymmetric information (Easley, Hvidkjaer, and O'Hara, 2002) that would put U.S. investors at a disadvantage. Investors may also be induced, either by formal mandates or by performance criteria, to focus on MSCI member firms in order to keep portfolio returns in line with this benchmark index.
Shareholder rights index. U.S. investors may choose to underweight firms from markets with weak protections of minority shareholders.14
Dummy for dividend-paying firms. A company's dividend-paying record can be viewed as a commitment device, with the willingness to dispense cash signaling a commitment not to expropriate funds from minority shareholders.15
Home-country dividend tax withholding rate faced by U.S. investors. Withholding taxes can cause U.S. investors to face higher tax rates on dividends originating from a given foreign country than on U.S. stock dividends. This would make stocks from the foreign country less attractive to U.S. investors, particularly if other potential investors in stocks from the two countries did not face the same tax rate differential (otherwise, prices could adjust to equilibrate after-tax expected returns). Often a U.S. investor can obtain a tax credit that fully offsets a dividend tax that has been withheld by a foreign government. However, U.S. pension funds are not taxed directly on dividends, so tax credits are of no use to them, and thus taxes charged on foreign dividends generally will represent a differential between the foreign and domestic dividend tax rates that U.S. pensions face (the domestic rate is zero). Thus at least one important investor group is clearly affected by dividend withholding tax rates.
Foreign sales as a proportion of total sales. Companies that do substantial foreign business might be more recognizable to U.S. investors through advertising, the media, and direct consumer purchases. We use this variable as our main proxy for `` familiarity.'' Because the coverage of this variable by Worldscope is incomplete, we do not include this variable in all specifications.
And our last two instruments are included only in ![]() , because the requisite
reconciliation to U.S. GAAP and other disclosure requirements
associated with a U.S. listing render them moot for cross-listed
firms:
, because the requisite
reconciliation to U.S. GAAP and other disclosure requirements
associated with a U.S. listing render them moot for cross-listed
firms:
Firm-level accounting quality index. As with the national accounting quality index, investors may avoid stocks for which it is difficult to obtain credible accounting information. This variable measures variation in firm-specific accounting quality not picked up by the national accounting quality variable.
English home language dummy. Among firms that lack a U.S exchange listing, investors may favor companies that are guaranteed to disclose information in English.
5 Results from the Simultaneous Model on Determinants of Cross-Listing and U.S. Holdings
Table III reports estimates of our structural model of cross-listing and U.S. holdings. In the baseline specification reported in Panel A, holdings are scaled by market capitalization. Panel B reports the results when holdings are scaled by market float. For both of these panels, we estimate the simultaneous model using the cross-section of 8,067 stocks for which data on all instruments are available. Panel C of Table III reports results for a specification that is similar to the baseline, except that it includes as a variable the proportion of a firm's sales that are foreign. Because this variable is missing from Worldscope in many cases, including for most of the financial firms, the results in Panel C exclude all missing cases and omit the few remaining financial firms. A total of 5,155 usable observations remain for estimation in Panel C.
5.1 Reporting interpretable estimates
Because our structural equations (10), (17), and (18) are nonlinear, the estimated parameters of the model are difficult to interpret. Therefore, we report rescaled functions of the estimates that are more readily interpretable. Specifically, for the coefficients on instruments in the listing decision equation, we calculate the marginal effect of a one-unit change in the instrument on the percentage point probability of cross-listing, estimated using each of 8,067 firms in the sample (or the 5,155 firms used in Panel C),
![]() ,
where (19)
,
where (19)
![]() . (20)
. (20)
|
(21) |
|
(22) |
The reported figures represent the median marginal impact on the cross-listing probability of changes in (H
Similarly, the coefficients (
![]() in the
holdings equations are scaled to reflect the marginal effect of a
change in the instrument on the holdings share of U.S. investors
(measured in percentage points),
in the
holdings equations are scaled to reflect the marginal effect of a
change in the instrument on the holdings share of U.S. investors
(measured in percentage points),
![]() ,
,
![]() ,
,
![]() .
(23)
.
(23)
We then report the median estimated effect, which varies with the slope of the logistic transformation function (F).
5.2 Estimates from the cross-listing equation
In accordance with our intuition about factors that reduce the costs of cross-listing, the estimates in Panels A - C reveal that firms are more likely to cross-list on a U.S. exchange if they are large, have better home-country accounting standards, or are domiciled in Canada. For example, in Panel A, the total assets coefficient of 0.472 implies that doubling the size of a firm increases its chances of cross-listing by nearly half of a percentage point, relative to an average cross-listing incidence of about 3.3 percent (270 out of 8,067).
The two variables that uniquely identify the listing equation enter strongly with estimated signs that are in line with our expectations. Firms from countries with relatively large home equity markets are less likely to cross-list, consistent with a less urgent need to raise capital abroad, while firms from Germanic-language countries are more likely to cross-list, suggesting that they may have a cost advantage to producing information in English.
Overall, these results are consistent with the findings in Pagano, Röell, and Zechner (2002), Doidge, Karolyi, and Stulz (2004), and Sarkissian and Schill (2004), who also study the determinants of cross-listing, and suggest that firms that are more likely to cross-list in the United States are those that can do so at a relatively low cost.
Turning to the impact of holdings on the cross-listing decision,
our evidence is mixed. The Panel B (float-adjusted) estimates imply
that both the expected increase in U.S. investment from
cross-listing and the level of U.S. holdings prior to listing can
positively influence the cross-listing probability. These results
are consistent with the idea that firms cross-list to both expand
their investor base and service their existing U.S. investor base.
But the statistical certainty of the positive sign is more tenuous
for the estimates in Panels A and C, which creates some doubt about
the robustness of the results. To some extent, the imprecision in
the estimates arise because of uncertainty about (
![]() , given
that the cross-listed holdings equation (17) is estimated
with relatively few observations.
, given
that the cross-listed holdings equation (17) is estimated
with relatively few observations.
5.3 Estimates from the holdings for firms that are not cross-listed
Results for the holdings equations (17) and (18) appear in the middle columns, starting with the estimates from the equation of firms that are not cross-listed. One important thing to keep in mind when examining the holdings equations is that any significant position taken by a U.S. investor must be offset by a reduced position from a non-U.S. investor. Thus, our coefficients provide information, strictly speaking, only on the choices of U.S. vis-à-vis non-U.S. investors.
Among firms that are not cross-listed, most of the explanatory variables are significant with signs that typically accord with intuition. U.S investors prefer firms that are larger, nonfinancial, included in the MSCI World index, have high market-to-book ratios, and pay dividends. They are also attracted to firms that have strong firm-level accounting standards and high foreign sales. Ceteris paribus, U.S. investors prefer firms from countries that use English as an official language, particularly Canadian firms, and firms from countries with high national accounting standards and low dividend tax withholding rates. The latter result indicates that an additional reason that a home bias might exist is that U.S. investors shy away from international investments when cross-border dividend withholding rates are high.
A number of the non cross-listed holdings estimates indicate that U.S. investors are sensitive to the amount and quality of information available on foreign-traded firms. For instance, efficiencies in information production, high regulatory oversight, and frequent press coverage are likely to increase the amount of reliable information available on large firms. Similarly, information in English is more readily accessible to the English-speaking U.S. public and commonalities between the United States and Canada should make Canadian companies, ceteris paribus, more transparent to U.S. investors.16 In addition, the apparent distaste of U.S. investors for foreign financial firms is consistent with a preference for transparency, and the estimate on the dividend-paying dummy implies that U.S. investors favor firms that choose to distribute dividends rather than keeping earnings within the firm. Finally, the positive sign on the accounting variables, measured at both the firm and country level, suggest that U.S. investors value high-quality disclosure.17
But some of our estimated coefficients are also consistent with the idea that U.S. investors tend to favor familiar foreign stocks. Perhaps the most convincing evidence appears in Panel C, where we find larger U.S. holdings for companies with higher foreign sales, which are more likely to be familiar to U.S. consumers than those that operate primarily in their home market. Firms that originate from a native English country and firms from the culturally and geographically proximate country of Canada are also more likely to be familiar to investors in the United States. All else equal, large foreign firms and firms tracked by MSCI are more likely to familiar to U.S. investors.
One puzzling finding is the negative association between holdings and the level of shareholder rights protection provided by a firm's home country. This result holds whether we use the LaPorta, Lopez-de-Silanes, Shleifer, and Vishny (1998) index of anti-director rights (as reported), or country-level estimates of the blockholder premium in share prices from Dyck and Zingales (2004) (not reported). The willingness of American investors to undertake relatively large positions in countries in which minority shareholders are vulnerable suggests a relative lack of concern about institutional enforcement of their property rights, at least at the time of the 1997 survey. But it is also at least conceivable that excessive anxiety about shareholder rights on the part of portfolio investors in other countries depresses the affected stocks to bargain prices.18
The negative sign on the proportion of shares held by insiders implies that U.S. investors hold fewer shares in firms with large insider holdings. This finding is consistent with the idea that closely held insider shares reduce the supply of available float. But U.S. investors may also avoid such firms if close insider ownership implies a higher likelihood that resources will be diverted to the private benefit of the insiders (Lins and Warnock, 2004). One way to separate the two effects--the supply effect and the corporate governance effect--would have been to include the insider holdings variable in the float-adjusted specifications in Panel B. But doing so induces measurement error with a positive bias, rendering an estimate that is difficult to interpret.19 This bias, along with the fact that our insider holdings variable is a blunt measure that includes the holdings of large, unaffiliated shareholders, leads us to exclude insider holdings from the right-hand-side variables in Panel B.
Finally, the selectivity correction variable enters significantly only in Panel B. The negative sign implies that the set of firms that are unlisted have unobservable characteristics that make their stock less likely to be held by U.S. investors. In other words, holding all else constant, the mean holdings of the unlisted sample would be higher if the sample were drawn randomly from a group of firms with the same observable characteristics.
5.4 Estimates from the holdings for cross-listed firms
Only a few instruments enter significantly into the listed
holdings equation, and our adjusted R![]() ranges only from 5 to 15 percent. This suggests
either that U.S. investors in aggregate have relatively indistinct
preferences among cross-listed firms--that is, among these firms
the most important attribute is that they have cross-listed--or
that we do not observe enough heterogeneity in the relevant
dimensions in our sample to tease out these preferences. Only the
proportion of shares held by insiders, which mainly captures an
arithmetic supply effect on the denominator of the U.S. holdings
share, is significantly different from zero at the 5 percent level
in the baseline specification. Across the two other specifications,
U.S. investors appear to shy away from financial firms and favor
high market-to-book firms and firms with extensive foreign sales
even after they have cross-listed.
ranges only from 5 to 15 percent. This suggests
either that U.S. investors in aggregate have relatively indistinct
preferences among cross-listed firms--that is, among these firms
the most important attribute is that they have cross-listed--or
that we do not observe enough heterogeneity in the relevant
dimensions in our sample to tease out these preferences. Only the
proportion of shares held by insiders, which mainly captures an
arithmetic supply effect on the denominator of the U.S. holdings
share, is significantly different from zero at the 5 percent level
in the baseline specification. Across the two other specifications,
U.S. investors appear to shy away from financial firms and favor
high market-to-book firms and firms with extensive foreign sales
even after they have cross-listed.
The bottom rows of each panel in Table III show that the cross-listed firm selectivity correction is not significant in any of the specifications. However, even though the unobserved components of the model do not induce a significant selectivity effect, we will demonstrate with the results in our next table that correctly adjusting for the observed components can be economically important.
6 The Average Cross-Listing Effect for Cross-Listed Stocks
Selection biases arise when a researcher attempts, for comparison purposes, to treat two different populations as if they are similar. This problem is common because it is often impossible to observe the same population under the two scenarios to be compared. For example, we cannot observe the amount U.S. investors would have held in the listed firms in December of 1997 if those firms had not been listed. Because listing is not a randomly selected process, selection biases are likely to afflict any comparison.
In this section we apply several estimators, beginning with one constructed directly from our structural model parameter estimates in Table III, to assess what average U.S. holdings across cross-listed firms would have been had the firms not cross-listed. We define the average `` cross-listing effect'' to be the mean difference between actual U.S. holdings in cross-listed firms and the generated estimates. In statistical terms, the average cross-listing effect is an estimate of
| (24) |
where
6.1 Model-based estimator
For the first estimator, we substitute cross-listed firm
observations into the estimated non cross-listed holdings equations
reported in the first two panels of Table III, and compute fitted
holdings values. The average of these fitted values represents a
valid estimate of
![]() assuming that the parameters of
(18) accurately describe the distribution of holdings of non
cross-listed firms for a given value of Z.
assuming that the parameters of
(18) accurately describe the distribution of holdings of non
cross-listed firms for a given value of Z.
As reported in the top panel of Table IV, at the end of 1997
U.S. investors held an average of 16.3 percent of the market
capitalization of the 270 cross-listed firms in the sample (an
average that is slightly less than for the somewhat larger sample
in Table II). Shown in row 2, the average of the fitted holdings
values -- that is our model-based estimate of
![]() -- is 5.4 percent of market capitalization. Consistent with
selection-bias intuition, the estimate implies that U.S. investors
would have held a larger mean share of these firms had they not
cross-listed than the 3.3 percent average holding in firms that
were not actually cross-listed (see Table II). Nonetheless, this
implies a statistically significant average cross-listing effect of
10.8 percent of market capitalization (15.0 percent in terms of a
firm's measured float).21 In other
words, the structural model estimates imply that U.S. holdings in a
typical cross-listed stock are 10.8 percentage points higher than
they would be without the U.S. listing.22
-- is 5.4 percent of market capitalization. Consistent with
selection-bias intuition, the estimate implies that U.S. investors
would have held a larger mean share of these firms had they not
cross-listed than the 3.3 percent average holding in firms that
were not actually cross-listed (see Table II). Nonetheless, this
implies a statistically significant average cross-listing effect of
10.8 percent of market capitalization (15.0 percent in terms of a
firm's measured float).21 In other
words, the structural model estimates imply that U.S. holdings in a
typical cross-listed stock are 10.8 percentage points higher than
they would be without the U.S. listing.22
6.2 P-matching estimator
Our second estimator for
![]() uses the propensity-score method of matching, also termed ``
p-matching,'' originally developed by Rosenbaum and Rubin
(1983).23 The
method matches each cross-listed firm with a non cross-listed firm
(or a set of non cross-listed firms) based on the closeness of
their fitted probabilities from the reduced-form cross-listing
probit in equation (12)). The idea is that the holdings of
p-matched non cross-listed firms are likely to be similar to what a
listed firm's holdings would have been if unlisted, so the average
holdings of p-matched firms can be used to estimate
uses the propensity-score method of matching, also termed ``
p-matching,'' originally developed by Rosenbaum and Rubin
(1983).23 The
method matches each cross-listed firm with a non cross-listed firm
(or a set of non cross-listed firms) based on the closeness of
their fitted probabilities from the reduced-form cross-listing
probit in equation (12)). The idea is that the holdings of
p-matched non cross-listed firms are likely to be similar to what a
listed firm's holdings would have been if unlisted, so the average
holdings of p-matched firms can be used to estimate
![]() .
The asymmetry of our data sample makes p-matching a particularly
attractive method for estimating
.
The asymmetry of our data sample makes p-matching a particularly
attractive method for estimating
![]() because we have a large set of firms from which to select a match
(roughly 30 non cross-listed firms for each of our cross-listed
firms). However, one drawback to this methodology is that it does
not account for selection bias that arises as a result of
unobserved correlation between the holdings and cross-listing
decisions.
because we have a large set of firms from which to select a match
(roughly 30 non cross-listed firms for each of our cross-listed
firms). However, one drawback to this methodology is that it does
not account for selection bias that arises as a result of
unobserved correlation between the holdings and cross-listing
decisions.
To implement the p-matching methodology, we first remove observations from the unlisted sample that lie outside the `` support'' (i.e., range) of the explanatory variables of the listed firms. Heckman, Ichimura, Smith and Todd (1998) show that such an exercise improves the statistical properties of the matching estimator by eliminating non cross-listed firms that are obviously unlike the cross-listed firms.24 This exercise disqualifies 529 firms from the unlisted sample. We then run the equation (12) probit regression on the reduced sample (using the same specification as for the first two panels of Table III). We next calculate fitted cross-listing probabilities for all firms in the regression sample, and match each cross-listed firm to the non cross-listed firm that has the fitted probability closest to that of the cross-listed firm in terms of absolute difference.
We obtain a wide range of fitted probabilities for both
cross-listed firms and non cross-listed firms. The cross-listed
firms' probabilities range between 0.0 percent and 76.1 percent,
with a mean cross-listing probability of 20.4 percent. The
probabilities for the matched unlisted firms share a very similar
range and mean. This is important because the statistical
properties of the matching estimator are much better when large
overlap exists in the fitted probabilities of the two groups
(Heckman, Ichimura, Smith, and Todd, 1998). The two groups also
match closely on the basis of their means of each of the variables
in ![]() .
.
The p-matching methodology produces results that are close to
the corresponding model-based estimates. As shown in row 4 of Table
IV, this methodology yields an estimate of 6.7 percent of market
capitalization (9.4 percent of market float) for
![]() ,
implying a statistically significant listing effect equivalent to
9.6 percent of market capitalization (16 percent of market
float).
,
implying a statistically significant listing effect equivalent to
9.6 percent of market capitalization (16 percent of market
float).
The p-matching methodology can also provide some insight into the size of the group of good ``candidates'' for cross-listing--that is, those firms with high propensity scores (fitted probabilities)--that had chosen not to cross-list. In our sample, 298 non cross-listed firms had propensity scores that exceeded the median listing propensity of the 270 cross-listed firms. An interesting research question not addressed in this paper is why so many apparently viable candidates for cross-listing choose not do so.
6.3 Difference-in-differences estimator
We generate our third estimate of the average cross-listing effect using the ``difference-in-differences'' estimator (Heckman and Robb, 1985; Heckman, LaLonde, and Smith, 1999). This estimator requires holdings observations on cross-listed firms prior to their cross-listing. For this, we draw upon U.S. holdings data from an earlier 1994 survey. The difference-in-differences estimator compares the change in holdings of a firm that was not cross-listed in 1994 but cross-listed by 1997 to firms that remained non cross-listed between 1994 and 1997. That is, the cross-listing effect is given by
| (25) |
where i indexes a firm that cross-lists between the 1994 and 1997 surveys, j indexes a firm that remains non cross-listed in both surveys, and bars over the variables reflect sample means across the i and j categories. Unlike the p-matching estimator, the difference-in-differences estimator can account for the unobservable components of selection bias, assuming that the characteristics of a type-i firm do not change in a way that is left uncontrolled by the type-j firms. The key drawback of the difference-in-differences estimator is that it relies on a relatively narrow subset of firms that were traded only in their home market in 1994, but cross-listed by 1997.
The bottom panel of Table IV reports the
difference-in-differences estimates of the listing effect for
holdings scaled by market capitalization. U.S. holdings increased
by 8.9 percent of market capitalization for those firms that
cross-listed between March 31, 1994 and December 31, 1997, while
over the same period holdings in firms that remained unlisted
increased by only 0.6 percent.![]() 25
Consistent with the model-based and matched estimates, this implies
a sizable listing effect of 8.3 percentage points.
25
Consistent with the model-based and matched estimates, this implies
a sizable listing effect of 8.3 percentage points.
7 What Drives the Cross-Listing Effect?
Table IV showed using three estimators of the mean cross-listing effect that, after controlling for selection biases, foreign firms that cross-list on a U.S. exchange experience a statistically and economically significant boost in U.S. shareholdings, equivalent to 8 to 11 percent of the firm's market value, and between 14 and 16 percent of the firm's measured float. To better understand what drives this cross-listing effect, this section examines how the effect varies across cross-listed firms.
We conjecture that firms experiencing the largest cross-listing effect are those for which cross-listing most sharply reduces impediments to investment. This intuition can be used to examine several hypotheses related to the benefits from cross-listing, assuming that changes in U.S. shareholdings provide either a direct or indirect signal of the value to cross-listing.
One hypothesis, implied in the studies of Lang, Lins, and Miller (2003), Baker, Nofsinger, and Weaver (2002), and Khanna, Palepu, and Srinivasan (2003), relates cross-listing benefits to the improved availability and quality of value-relevant information, including disclosures associated with listing on an exchange and registering with the SEC, reconciliation of financial figures to U.S. GAAP, and closer scrutiny by analysts and the press. Under this hypothesis, financially opaque firms and firms with weak accounting standards prior to cross-listing should experience the largest cross-listing effect.
The second hypothesis ties the boost in U.S. investor interest in a foreign stock to increased familiarity following a cross-listing. The NYSE, for example, cites increased visibility as one of the added benefits to listing on its exchange.26Baker, Nofsinger, and Weaver (2002) find that foreign stocks experience a significant increase in analyst buy recommendations and newspaper articles about the company following a cross-listing on the NYSE or London Stock Exchange. If this increased attention serves to improve a stock's name recognition without necessarily transmitting fundamental information, then stocks with low name-recognition in the United States could experience relatively large increases in investment upon cross-listing.
A third hypothesis, propounded by Stulz (1999), Coffee (2002), and Benos and Weisbach (2004), ties the benefits of cross-listing to the ``bonding'' inherent in committing to abide by U.S. securities laws that protect minority investors. Consistent with the bonding hypothesis, Reese and Weisbach (2002), Doidge (2004), and Doidge, Karolyi, and Stulz (2004) demonstrate that, upon U.S. cross-listing, firms raise more equity and experience larger positive stock revaluations when they are from a country with relatively weak shareholder rights protections.27 In our paper, the bonding hypothesis implies that firms from countries with weak protection of investor rights should experience the largest cross-listing effect as U.S investors become more interested in the firms once they have bonded themselves with U.S. law.
The first two columns in Table V, under the label
``Model-based'', report the differences in the structural model
estimates of the marginal impact of each instrument on U.S.
holdings, with and without cross-listing. These figures, which are
calculated as the difference between the third and second columns
of Table III, should be interpreted as the marginal sensitivity of
the cross-listing effect (
![]() to
the variable in question. Estimated p-values of a test that the
cross-listed and non cross-listed parameters are the same (i.e.,
their difference is zero) are from bootstrapped distributions and
are reported in parentheses below the estimates.28
to
the variable in question. Estimated p-values of a test that the
cross-listed and non cross-listed parameters are the same (i.e.,
their difference is zero) are from bootstrapped distributions and
are reported in parentheses below the estimates.28
The third and fourth columns of Table V report the results from
regressions of the firm-level difference-in-differences estimates
on various instruments. Specifically, we regress the 1994 to 1997
change in holdings of stocks that were not cross-listed in 1994 on
a cross-listing dummy, its interactions with instruments measured
as of 1994 and 1997, and the change in the value of instruments
over the 1994 to 1997 period,
![]() , (26)
, (26)
Data peculiarities handicap our chances of finding statistically strong relations in the cross-section. The parameters of the structural cross-listed holdings equation in Table III are measured imprecisely, making it difficult to confidently distinguish the signs on the conditional cross-listing effects in the first two columns. Moreover, 1994 firm-level data requirements further reduce the number of cross-listed firms available for analysis in the third and fourth columns of the table.
Nonetheless, several interesting patterns emerge in Table V that are relevant to the three hypotheses discussed above. First and foremost, a number of our results are consistent with the notion that improvement in the availability and quality of value-relevant information about a firm is a key aspect of cross-listing in U.S. markets. In particular, we obtain negative and statistically significant coefficient estimates for the firm-level accounting quality index in our difference-in-differences specifications, implying that improved accounting practices linked to cross-listing spurs U.S. investment in firms with previously weak accounting standards. Our model-based estimates also imply that opacity arising from either weak national accounting standards or uninformative disclosure choices at the firm level is a deterrent to U.S. investment in foreign stocks that are not cross-listed. Interestingly, in our difference-in-differences specifications, we also find a smaller listing effect for financial-sector firms, consistent with public accounting and disclosure requirements being less effective for financial firms. Further evidence for the importance of transparency comes in the smaller difference-in-differences estimate of the listing effect for Canadian firms, which have less stringent disclosure requirements than other foreign companies. We also find U.S. holdings react less to cross-listing by firms from English-speaking countries, for which information in English is likely more readily available at low cost. One further bit of evidence favoring an information explanation is the reduced listing effect for the more liquid stocks that are included in the MSCI World index. To the extent that illiquidity reflects asymmetric information between company insiders and other potential traders, as in the models of Kyle (1985), Glosten and Milgrom (1985), Amihud and Mendolsohn (1986), and Easley, Hvidkjaer, and O'Hara (2002), the enhanced disclosure requirements associated with cross-listing will tend to matter more for less liquid stocks.
Second, the results in Table V provide relatively little support for the idea that U.S. investors increase their weighting in foreign stocks merely because cross-listing makes the names of the underlying companies more familiar to the investors. If this were the case, we would expect firms with low foreign sales to gain more recognition from cross-listing relative to multinational firms and thus enjoy a larger increase in U.S. shareholdings, all else equal. But for our model-based conditional listing effect, we do not estimate a negative coefficient for the foreign sales proportion, as would be implied by this argument. Furthermore, we do not find a statistically robust relationship between total firm assets and the listing effect from either our model-based estimates or our difference-in-differences approach. Like multinational firms, larger firms seem more likely to be already familiar to U.S. investors without a cross-listing, so that the familiarity hypothesis suggests that the listing effect would be decreasing in firm size.
Finally, we do not find that U.S. investors respond to the enhanced protections of U.S. securities laws in the manner that has been suggested by proponents of the bonding hypothesis. In particular, the positive coefficients on the shareholder rights index in the difference-in-differences exercise indicate that, all else equal, cross-listing has a smaller impact on U.S. investors' holdings for firms from countries with weaker shareholder protection. Our result here does not imply that U.S. investors fail to value shareholder protection provided by other countries' legal systems, but is consistent with cross-listing complementing such legal rights. In fact, the disclosure requirements accompanying a U.S. listing typically include information about home-country legal risks that may leave some U.S. investors better informed about their rights.
8 Conclusion
We use a comprehensive 1997 survey of U.S. investor holdings in non-U.S. companies to show that cross-listing on a U.S. exchange substantially increases U.S investor holdings of a foreign stock, a phenomenon we term the ``cross-listing effect.'' Our selection bias-corrected estimates imply that firms can increase their U.S. holdings by 8 to 11 percent of their market capitalization by cross-listing in the United States, doubling or more the amount prior to cross-listing. Of course, this does not imply that every firm in the world could obtain a cross-listing effect of this magnitude, but our results suggest that our estimates are applicable to at least several hundred firms that are not yet cross-listed.
We find a smaller U.S. holdings increase from cross-listing for MSCI members and for firms with more transparent financial accounting. The second result is consistent with the requisite financial disclosure being a key element of cross-listing, from the point of view of U.S. investors. We do not find strong evidence that shareholder protection more generally is an important aspect of a U.S. listing, but this may be because variation in shareholder protection is more difficult to measure in our cross-section of firms than variation in transparency.
Despite the large average cross-listing effect on U.S. holdings, results from our simultaneous model of the cross-listing and holdings decisions offer only weak support for the idea that prospects for an expanded shareholder base are a key motive for cross-listing. We find some evidence that foreign firms are more likely to cross-list in the United States when they already have a large base of U.S. shareholders, suggesting that some firms cross-list to service their shareholder clientele. To the extent that cross-listing thus would tend to benefit disproportionately a relatively narrow group of a typical foreign firm's stakeholders, this motive is broadly consistent with the relatively small number of cross-listed firms.
9 References
Ackert, L., B. Church, J. Tomkins, and P. Zhang, 2003. What's in a name? An experimental examiniation of investment behavior. College of Business, Georgia Institute of Technology.
Aggarwal, R., L. Klapper, and P. Wysocki, 2003. Portfolio preferences of foreign institutional investors. Georgetown University working paper.
Ahearne, A., W. Griever, and F. Warnock, 2004. Information costs and home bias: an analysis of U.S. holdings of foreign equities. Journal of International Economics 62, 313-336.
Amihud, Y. and H. Mendelson, 1986. Asset pricing and the bid-ask spread. Journal of Financial Economics 17, 223-249.
Ammer, J,, N. Clinton, and G. P. Nini, 2004. Accounting Standards and Information: Inferences from Cross-Listed Financial Firms. Federal Reserve Board mimeo.
Baker, H. K., J. R. Nofsinger, and D. G. Weaver, 2002. International cross-listing and visibility. Journal of Financial and Quantitative Analysis 37, 495-521.
Barber, B. M. and T. Odean, 2003. All that glitters: The effect of attention and news on the buying behavior of individuals and institutional investors. University of California at Davis working paper.
Benos, E. and M. Weisbach, 2004. Private benefits and cross-listings in the United States. Emerging Markets Review, forthcoming.
Bertaut, Carol C., and Linda S. Kole, 2004. What makes investors over or underweight? Explaining international appetites for foreign equities. Federal Reserve Board mimeo.
Bradshaw, M. T., B. J. Bushee, and G. S. Miller, 2004. Accounting choice, home bias, and U.S. investment in non-U.S. firms. Journal of Accounting Research, forthcoming.
Bushman, R., J. Piotroski, and A. Smith, 2003. What determines corporate transparency? Kenan-Flagler School of Business, UNC-Chapel Hill working paper.
Cai, F., and F. Warnock, 2004. International diversification at home and abroad. Federal Reserve Board International Finance Discussion Paper #793.
Coval, J., and T. Moskowitz, 1999. Home bias at home: Local equity preference in domestic portfolios. Journal of Finance 54, 2045-2073.
Coval, J., and T. Moskowitz, 2001. The geography of investment: Informed trading and asset prices. Journal of Political Economy 109, 811-841.
Coffee, J., 2002. Racing towards the top? The impact of cross-listings and stock market competition and its implications. Northwestern University Law Review 93, 641-708
Dahlquist, M., and G. Robertsson, 2001. Direct foreign ownership, institutional investors, and firm characteristics. Journal of Financial Economics 59, 413-440.
Dahlquist, M., L. Pinkowitz, R. Stulz, and R. Williamson, 2003. Corporate governance and the home bias. Journal of Financial and Quantitative Analysis 38, 87-110.
Doidge, C., 2004. U.S. cross-listings and the private bene?ts of control: evidence from dual-class ?rms. Journal of Financial Economics 72, 519-553.
Doidge, C., G.A. Karolyi, and R. Stulz, 2004. Why are foreign firms listed in the U.S. worth more? Journal of Financial Economics 71, 205-238.
Durnev, A. and H. Kim, 2004, To Steal or Not to Steal: Firm Attributes, Legal Environment, and Valuation. Journal of Finance, forthcoming.
Dyck, A.and L. Zingales, 2004. Private Benefits of Control: An International Comparison. Journal of Finance 59(2), 537-600.
Easley, D., S. Hvidkjaer, and M. O'Hara, 2002. Is information risk a determinant of asset returns? Journal of Finance 57(5), 2185-2221.
Easterbrook, F., 1984. Two Agency Cost Explanations of Dividends. American Economic Review 74(4), 650-659.
Edison, H. J., and F. Warnock, 2004. U.S. Investors' Emerging Market Equity Portfolios: A Security-Level Analysis. Review of Economics and Statistics 84(3).
Faccio, M., L. Lang, and L. Young, 2001. Dividends and Expropriation. American Economic Review 91(1), 54-78.
Fanto, J., and R. Karmel, 1997. A report on the attitudes of foreign companies regarding a U.S. listing. Stanford Journal of Law, Business and Finance 24, 763-812.
Feng, L., and M. S. Seasholes, 2004. Location effects and portfolio tilting. UC-Berkeley working paper.
Foerster, S. R., and G. A. Karolyi, 1999. The effects of market segmentation and investor recognition on asset prices: Evidence from foreign stocks listing in the United States. Journal of Finance 54, 981-1013.
French, K., and J. Poterba, 1991. Investor diversification and international equity markets. American Economic Review, Papers and Proceedings, 222-226.
Glosten, L. R. and P. R. Milgrom, 1985. Bid, Ask, and Transaction Prices in a Specialist Market with Heterogeneously Informed Traders. Journal of Financial Economics 14(1):71-100.
Gompers, Paul A., Joy L. Ishii, and Andrew Metrick, 2003. Corporate Governance and Equity Prices. Quarterly Journal of Economics 118(11):107-155.
Griever, W., G. Lee, and F. E. Warnock, 2001. The U.S. system for measuring cross-border investment in securities: a primer with a discussion of recent developments. Federal Reserve Bulletin, 87(10): 633-650.
Grinblatt, M. and M. Keloharju, 2000. The investment behavior and performance of various investor types: A study of Finland's unique data set. Journal of Financial Economics 55, 43-68.
Grullon, G., G. Kanatas, and J. P. Weston, 2004. Advertising, breath of ownership, and liquidity. Review of Financial Studies 17: 439-461.
Heckman, J. J., 1979. Sample selection bias as a specification error. Econometrica 47, 153-161.
Heckman, J., H. Ichimura, J. Smith, and P. Todd, 1998, Characterizing selection bias using experimental data. Econometrica, 66, 1017-1098.
Heckman, J., R. LaLonde, and J. Smith, 1999. The economics and econometrics of active labor market programs, in O. Ashefelter and D. Card, eds, Handbook of Labor Economics, Amsterdam: Elsevier.
Heckman, J. and R. Robb Jr., 1985, Alternative methods for evaluating the impact of interventions. in Longitudinal Analysis of Labor Markets Data, ed. By J. Heckman and B. Singer. New York: Cambridge University Press, pp. 156-245.
Huberman, G., 2001. Familiarity breeds investment. Review of Financial Studies, 14(3):659-680.
Imbens, G. W. 2004. Nonparametric estimation of average treatment effects under exogeneity: a review. Review of Economics and Statistics 86, 1, 4-29.
International Finance Corportation, 1998. Emerging Stock Markets Factbook.
Ivkovic, Z., and S. Weisbenner, 2003. Local does as local is: information content of the geography of individual investors' common stock investments. NBER Working Paper 9685.
Jensen, M., 1986. Agency Cost of Free Cash Flow, Corporate Finance, and Takeovers. American Economic Review (Papers and Proceedings) 76(2), 323-329.
Johnson, S., R. La Porta, F. Lopez-de-Silanes, and A. Shleifer, 2000. Tunneling. American Economic Review (Papers and Proceedings) 90, 22-27.
Kalcheva, I., and K. Lins, 2004. International evidence on cash holdings and expected managerial agency problems. University of Utah working paper.
Kang, J., and R. Stulz, 1997. Why is there a home bias? An analysis of foreign portfolio equity ownership in Japan. Journal of Financial Economics, 46:3-28.
Kaniel, R., D. Li, and L. T. Starks, 2003. The investor recognition hypothesis: International evidence and determinants. Duke University, Fuqua School working paper.
Karolyi, G.A., and R. Stulz, 2002. Are financial assets priced locally or globally? NBER Working Paper #8994.
Khanna, T., K. Palepu, and S. Srivanasan, 2003. Disclosure practices of foreign companies interacting with U.S. markets. Harvard Business School working paper No. 03-081
Kyle, A.S., 1985. Continuous Auctions and Insider Trading. Econometrica 53(6):1315-1336.
Lane, P., and G. M. Milesi-Ferretti, 2004. International investment patterns. Trinity College and IMF mimeo.
Lang, M., K. Lins, and D. Miller, 2003. ADRs, analysts, and accuracy: Does cross listing in the U.S. improve a firm's information environment and increase market value? Journal of Accounting Research, forthcoming.
La Porta, R. F. Lopez-de-Silanes, A. Shleifer, and R. Vishny, 1998. Law and finance. Journal of Political Economy 106, 1113-1155.
La Porta, R. F. Lopez-de-Silanes, A. Shleifer, and R. Vishny, 1999. Corporate ownership around the world. Journal of Finance 54, 471-515.
La Porta, R., F. Lopez-de-Silanes, A. Shleifer, and R. Vishny, 2002, Investor Protection and Corporate Valuation, Journal of Finance, Vol. 57, No. 3, 1147-1170.
Lee, L.F., 1978, Unionism and wage rates: A simultaneous equations model with qualitative and limited dependent variables, International Economic Review, 19, 415-433.
Lewis, K., 1999. Trying to explain the home bias in equities and consumption. Journal of Economic Literature, 37:571-608.
Lins, K., 2003, Equity Ownership and Firm Value in Emerging Markets, Journal of Financial and Quantitative Analysis, 38, 159-184.
Lins, K., and F. Warnock, 2004. Corporate governance and the shareholder base. International Finance Discussion Paper 816, Board of Governors of the Federal Reserve System.
Leuz, C., and R.E. Verrecchia, 2004. Firms' capital allocation choices, information quality, and the cost of capital. Wharton School, University of Pennsylvania, working paper.
Maddala, G., 1983. Limited-Dependent and Qualitative Variables in Econometrics. Cambridge Press.
Merton, R. C., 1987. A simple model of capital market equilibrium with incomplete information. Journal of Finance 42, 483-510.
Miller, D., 1999. The market reaction to international cross-listings: evidence from depositary receipts. Journal of Financial Economics 51, 103-123.
Morgan, D. P., 2002. Rating banks: Risk and uncertainty in an opaque industry. American Economic Review 92, 874-888.
Pagano, M., A. Roell, and J. Zechner, 2002. The geography of equity listing: Why do companies list abroad? Journal of Finance, 57(6): 2651-2694.
Rajan, R. G., and L. Zingales, 2002. The great reversals: the politics of financial development in the twentieth century. Journal of Financial Economics 65, 5-50.
Rosenbaum, P. R. and D. B. Rubin. 1983. The central role of the propensity score in observational studies for causal effects. Biometrika 70, 41-55.
Reese, W., and M. Weisbach, 2002. Protection of minority shareholders interests, cross-listings in the United States, and subsequent equity offerings. Journal of Financial Economics, 66( 1): 65-104.
Sarkissian, S. and M. J. Schill, 2004. The overseas listing decision: New evidence of proximity preference. Review of Financial Studies, 17, 739-767.
Siegel, J., 2003. Can foreign firms bond themselves effectively by renting U.S. securities laws? Journal of Financial Economics, forthcoming.
Stuart, E., 2004. Matching methods for causal inference: Designing observational studies. Harvard University Department of Statistics mimeo.
Stulz, R., 1999. Globalization of equity markets and the cost of capital. Paper prepared for the SBF/NYSE Conference on Global Equity Markets.
Tesar, L., Werner, I., 1995. Home bias and high turnover. Journal of International Money and Finance 14,467- 493.
Table I: U.S. Holdings by Country, December 31, 1997
The table shows the proportion of market capitalization held by U.S. investors and the number of firms with positive U.S. holdings among the 12,236 stocks in our sample, sorted by country. Data on the value of U.S. holdings are from the U.S. Treasury/Federal Reserve Board survey of U.S. holdings of foreign securities. Market capitalization data are from Worldscope.
| Country | Percent of Market Capitalization Held by U.S. Investors | Number of
Firms with
Positive U.S. Holdings |
Country | Percent of Market Capitalization Held by U.S. Investors | Number of Firms with
Positive U.S. Holdings |
|---|---|---|---|---|---|
| Argentina | 24 | 38 | Korea | 10 | 248 |
| Australia | 10 | 268 | Luxembourg | 8 | 8 |
| Austria | 8 | 54 | Malaysia | 5 | 348 |
| Belgium | 4 | 66 | Mexico | 19 | 83 |
| Brazil | 13 | 128 | Netherlands | 19 | 136 |
| Canada | 11 | 484 | New Zealand | 14 | 47 |
| Chile | 7 | 63 | Norway | 13 | 120 |
| China | 4 | 85 | Pakistan | 12 | 42 |
| Colombia | 4 | 17 | Peru | 18 | 20 |
| Czech Republic | 5 | 41 | Philippines | 9 | 96 |
| Denmark | 8 | 88 | Poland | 17 | 39 |
| Finland | 21 | 74 | Portugal | 13 | 50 |
| France | 11 | 403 | Russia | 9 | 20 |
| Germany | 6 | 271 | Singapore | 7 | 162 |
| Greece | 4 | 64 | South Africa | 5 | 150 |
| Hong Kong | 7 | 332 | Spain | 11 | 104 |
| Hungary | 21 | 19 | Sweden | 14 | 153 |
| India | 6 | 186 | Switzerland | 11 | 144 |
| Indonesia | 8 | 107 | Taiwan | 1 | 174 |
| Ireland | 21 | 56 | Thailand | 9 | 192 |
| Israel | 11 | 49 | Turkey | 9 | 77 |
| Italy | 10 | 143 | United Kingdom | 10 | 1,446 |
| Japan | 6 | 1,876 | Venezuela | 14 | 14 |
| Total | 9 | 8,785 |
Table II: Summary Statistics for Sample, December 31, 1997
The table reports aggregate U.S. holdings, the number and market capitalization of the sample firms, and U.S. holdings in cross-listed and non cross-listed firms. Data on the value of U.S. holdings are from the U.S. Treasury/Federal Reserve Board survey of U.S. holdings of foreign securities. Market capitalization figures and are from Worldscope. We calculate market float by subtracting from market capitalization an adjusted value of the holdings in Worldscope's ``closely held share'' field, which reports the fraction of firm shares held by corporate officers and directors, and large and institutional shareholders. We label a firm as cross-listed if it had cross-listed lists on the NYSE, AMEX, or NASDAQ.
| Firm Market Capitalization Available (46 countries) | Firm Market Float Available (46 countries) | |
|---|---|---|
| Number of Firms Available | 12,236 | 8,528 |
| Total market value of equity (billions of US$) | $11,080 | $5,927 |
| Value of U.S. holdings (billions of US$) | $1,020 | $802 |
| Implicit share held by U.S. investors | 9.2% | 13.5% |
| Firms Cross-Listed on a U.S. Exchange | 481 | 281 |
| Average share held by U.S. investors | 17.4% | 25.9% |
| Firms Not Cross-Listed on U.S. Exchange | 11,755 | 8,247 |
| Average share held by U.S. investors | 3.3% | 5.7% |
Table III: Determinants of Listing Probability and U.S. Holdings Share
The table reports multi-stage estimates of a three-equation system that includes a probit specification of a firm's decision to cross-list and two additional equations that determine the proportion of shares held by U.S. investors--one conditional on cross-listing on a U.S. exchange as of December 31, 1997, and one conditional on not cross-listing. The dependent variable in the latter two equations is a shifted inverse logistic distribution function of the proportion (of either market capitalization or market float) of the value of U.S. holdings. Because each equation involves a non-linear function, all of the estimated slope coefficients are scaled for readier interpretation. For the cross-listing equation, the reported figures are scaled to reflect the marginal impact on the percent probability of listing of a unit change in the variable in question. The marginal impact reported is the median impact over the firms in the sample. Similarly, for the U.S. holdings share equations, the reported figures are scaled to reflect the marginal impact on the percent of shares held of a unit change in the variable in question. Again, the marginal impact reported is the median impact over the firms in the sample (whether listed or not). The Gain in U.S. Holdings Share
from Cross-Listing (%) is the endogenously estimated forecast of the change in holdings resulting from cross-listing. The U.S. Holdings Share without Cross-Listing (%) is the endogenously determined estimate of what U.S. holdings would be if a firm does not cross-list. The other variables, which are assumed exogenous to the system, are defined in Appendix A-I. Bootstrapped p-values corresponding to a null hypothesis of a zero median impact appear in parentheses below each reported figure.
Table III (continued): Determinants of Listing Probability and U.S. Holdings Share
| Panel A: Baseline | Cross-Listing % Probability |
U.S. Holdings Share (%) of Market Cap. if: Not Cross-Listed |
U.S. Holdings Share (%) of Market Cap. if: Cross-Listed |
U.S. Holdings Share (%) of Market Cap. if: Difference |
|---|---|---|---|---|
| Gain in U.S. Holdings Share
from Cross-Listing (%) |
0.206 (0.271) |
|||
| U.S. Holdings Share
without Cross-Listing (%) |
0.547 (0.077) |
|||
| Home-country trading volume/GDP | -0.757 (0.005) |
|||
| Germanic home language dummy | 0.484 (0.033) |
|||
| Proportion of Shares Held
by Insiders (%) |
0.034 (0.268) |
-0.024 (0.000) |
-0.156 (0.000) |
-0.132 (0.000) |
| Financial firm dummy | -1.811 (0.017) |
-0.962 (0.000) |
-0.349 (0.493) |
0.613 (0.389) |
| Canada dummy | 3.948 (0.004) |
0.711 (0.138) |
-1.310 (0.319) |
-2.035 (0.251) |
| Log |
0.473 (0.011) |
0.261 (0.000) |
-0.221 (0.281) |
-0.484 (0.125) |
| National accounting quality index | 0.118 (0.001) |
0.035 (0.001) |
||
| Market value/Book value | 0.007 (0.023) |
0.059 (0.158) |
0.051 (0.211) |
|
| MSCI member dummy | 3.176 (0.000) |
-1.161 (0.281) |
-4.346 (0.005) |
|
| Shareholder rights index | -0.424 (0.000) |
-0.603 (0.114) |
-0.174 (0.309) |
|
| Dummy for dividend-paying firms | 0.631 (0.000) |
-1.461 (0.379) |
-2.106 (0.297) |
|
| Home-country dividend withholding tax rate faced by U.S. investors | -0.054 (0.000) |
-0.020 (0.428) |
0.034 (0.382) |
|
| Firm-level accounting quality index | 0.383 (0.000) |
|||
| English home language dummy | 0.919 (0.000) |
|||
| Selectivity correction (normalized
by its own standard deviation) |
0.118 (0.110) |
0.037 (0.437) |
||
| Adjusted R-squared | 0.25 | 0.26 | 0.10 | |
| Number of observations | 8067 | 7797 | 270 |
Table III (continued): Determinants of Listing Probability and U.S. Holdings Share
| Panel B: Float-Adjusted | Cross-Listing % Probability |
U.S. Holdings Share (%) of Market Float if: Not Cross-Listed |
U.S. Holdings Share (%) of Market Float if: Cross-Listed
|
U.S. Holdings Share (%) of Market Float if: Difference |
|---|---|---|---|---|
| Gain in U.S. Holdings Share
From Cross-Listing (%) |
0.161 (0.052) |
|||
| U.S. Holdings Share
without Cross-Listing (%) |
0.378 (0.014) |
|||
| Home-country trading volume/GDP | -0.753 (0.002) |
|||
| Germanic home language dummy | 0.441 (0.092) |
|||
| Proportion of Share Held
by Insiders (%) |
-0.005 (0.098) |
|||
| Financial firm dummy | -0.667 (0.141) |
-1.967 (0.000) |
-6.170 (0.056) |
-4.117 (0.128) |
| Canada dummy | 2.649 (0.001) |
2.700 (0.012) |
-0.837 (0.385) |
-3.549 (0.148) |
| Log |
0.250 (0.020) |
0.600 (0.000) |
0.786 (0.194) |
0.167 (0.475) |
| National accounting quality index | 0.099 (0.000) |
-0.002 (0.413) |
||
| Market value/Book value | 0.017 (0.007) |
0.089 (0.039) |
0.071 (0.115) |
|
| MSCI member dummy | 5.334 (0.000) |
-1.774 (0.208) |
-7.133 (0.000) |
|
| Shareholder rights index | -0.719 (0.000) |
0.175 (0.530) |
0.896 (0.248) |
|
| Dummy for dividend-paying firms | 0.963 (0.000) |
-5.942 (0.083) |
-6.965 (0.056) |
|
| Home-country dividend withholding tax rate faced by U.S. investors | -0.075 (0.000) |
0.016 (0.447) |
0.091 (0.312) |
|
| Firm-level accounting quality index | 0.816 (0.000) |
|||
| English home language dummy | 2.555 (0.000) |
|||
| Selectivity correction (normalized
by its own standard deviation) |
-0.348 (0.048) |
-3.419 (0.101) |
||
| Adjusted R-squared | 0.26 | 0.19 | 0.05 | |
| Number of observations | 8067 | 7797 | 270 |
Table III (continued): Determinants of Listing Probability and U.S. Holdings Share
| Panel C: Non-financial | Cross-Listing % Probability |
U.S. Holdings Share (%) of Market Cap. if: Not Cross-Listed |
U.S. Holdings Share (%) of Market Cap. if: Cross-Listed |
U.S. Holdings Share (%) of Market Cap. if: Difference |
|---|---|---|---|---|
| Gain in U.S. Holdings Share
from Cross-Listing (%) |
0.104 (0.217) |
|||
| U.S. Holdings Share
without Cross-Listing (%) |
0.215 (0.154) |
|||
| Home-country trading volume/GDP | -0.806 (0.004) |
|||
| Germanic home language dummy | 0.995 (0.001) |
|||
| Proportion of Share Held
By Insiders (%) |
0.011 (0.308) |
-0.027 (0.000) |
-0.132 (0.000) |
-0.104 (0.005) |
| Foreign sales as a proportion of total sales (%) | 0.007 (0.172) |
0.018 (0.000) |
0.050 (0.045) |
0.031 (0.134) |
| Canada dummy | 2.668 (0.008) |
0.731 (0.203) |
-0.171 (0.474) |
-0.903 (0.388) |
| Log |
0.451 (0.006) |
0.334 (0.000) |
-0.010 (0.453) |
-0.344 (0.224) |
| National accounting quality index | 0.058 (0.010) |
0.023 (0.055) |
||
| Market value/Book value | 0.007 (0.034) |
0.118 (0.101) |
0.111 (0.123) |
|
| MSCI member dummy | 3.148 (0.000) |
-1.874 (0.232) |
-5.040 (0.006) |
|
| Shareholder rights index | -0.406 (0.000) |
0.242 (0.392) |
0.651 (0.227) |
|
| Dummy for dividend-paying firms | 0.704 (0.000) |
-0.447 (0.483) |
-1.156 (0.399) |
|
| Home-country dividend withholding tax rate faced by U.S. investors | -0.037 (0.000) |
-0.302 (0.097) |
-0.264 (0.121) |
|
| Firm-level accounting quality index | 0.206 (0.001) |
|||
| English home language dummy | 1.026 (0.000) |
|||
| Selectivity correction (normalized
By its own standard deviation) |
-0.032 (0.425) |
0.001 (0.452) |
||
| Adjusted R-squared | 0.29 | 0.30 | 0.15 | |
| Number of observations | 5155 | 4974 | 181 |
Table IV: Average Cross-Listing Effect for Cross-Listed Stocks (December 31, 1997)
The table infers the average cross-listing effect on the U.S. holdings share
for 270 cross-listed firms from three alternative estimates of the share that
would be held in the firm by U.S. investors without a cross-listing in U.S.
markets, i.e.,
![]() . Panel A presents estimates as of
December 31, 1997. The ``model-based'' estimates are constructed by fitting a
holdings share equation estimated with data on non cross-listed firms to data
on the cross-listed firms. Parameter estimates for these equations appear in
the second column of the first two panels of Table III. The ``p-matching''
estimates are actual holdings shares of a sample of not-cross-listed firms
that have been paired with the cross-listed sample on the basis of the
estimated ex ante probability of cross-listing. The instruments used to
estimate this ex ante probability of cross-listing are the same as for the
reduced form of the model generating the model-based estimates. Panel B
presents differences-in-differences estimates using data on U.S. holdings (as
a percentage of market capitalization) for March 31, 1994 and December 31,
1997. The sample in Panel B is restricted to stocks that were not cross-listed
in U.S. markets in the earlier period, with the columns distinguishing between
stocks that cross-listed before the second period and those that did not.
Standard errors are shown in parentheses.
. Panel A presents estimates as of
December 31, 1997. The ``model-based'' estimates are constructed by fitting a
holdings share equation estimated with data on non cross-listed firms to data
on the cross-listed firms. Parameter estimates for these equations appear in
the second column of the first two panels of Table III. The ``p-matching''
estimates are actual holdings shares of a sample of not-cross-listed firms
that have been paired with the cross-listed sample on the basis of the
estimated ex ante probability of cross-listing. The instruments used to
estimate this ex ante probability of cross-listing are the same as for the
reduced form of the model generating the model-based estimates. Panel B
presents differences-in-differences estimates using data on U.S. holdings (as
a percentage of market capitalization) for March 31, 1994 and December 31,
1997. The sample in Panel B is restricted to stocks that were not cross-listed
in U.S. markets in the earlier period, with the columns distinguishing between
stocks that cross-listed before the second period and those that did not.
Standard errors are shown in parentheses.
| Panel A: Model-Based and Method-of-Matching |
U.S. investors' aggregate holdings as percentage of: Market capitalization |
U.S. investors' aggregate holdings as percentage of: Market Float |
|---|---|---|
| 1. Actual Mean Holdings of Cross-Listed Stocks | 16.3 | 25.4 |
| 2. Mean Projected Holdings if Not Cross-Listed | 5.5 | 10.4 |
| 3. Model-Based Cross-Listing Effect | 10.8 (0.7) |
15.0 (1.2) |
| 4. Holdings of Matched (Not Cross-Listed) Stocks | 6.7 | 9.4 |
| 5. P-Matching Cross-Listing Effect | 9.6 (0.8) |
16.0 (1.2) |
| Panel B: Difference-in-Differences | Stocks Cross-listed on U.S. exchange by December 1997 | Stocks not Cross-listed on U.S. exchange by December 1997 | |
|---|---|---|---|
| 6. Holdings: March 31, 1994 | 8.8 | 2.3 | |
| 7. Holdings: December 31, 1997 | 17.7 | 2.9 | |
| 8. Change in Holdings (1994-1997) | 8.9 | 0.6 | |
| 9. Difference-in-Differences Cross- | 8.3 (0.6) |
||
| 10. Number of Observations | 129 | 9473 |
Table V: Determinants of Cross-Listing Effect
The table reports cross-sectional analyses of firm-level estimates of the cross-listing effect as a function of firm and country instruments. The model-based estimates are calculated as the different between first and third panels of Table III. Reported in the difference-in-differences columns are coefficient estimates from a regression of the change in U.S. holdings (as a percentage of market capitalization) between March 31, 1994 and December 31, 1997 on a cross-listing dummy interacted with 1994 values of the instrument. The sample is restricted to stocks that were not cross-listed in U.S. markets in the earlier period. A dummy variable for cross-listing between 1994 and 1997, first-period values of the instruments, and changes in the instruments (between the first and second period) are included as control variables, in addition to the reported interactions between the instruments and cross-listing. p-values are shown in parentheses.
Model-based: Baseline |
Model-based: Non-financial |
Differences-in-differences | Differences-in-differences | |
|---|---|---|---|---|
| Proportion of Shares Held
by Insiders (%) |
-0.132 (0.000) |
-0.104 (0.005) |
||
| Financial firm dummy | 0.613 (0.389) |
-6.786 (0.000) |
-6.254 (0.000) |
|
| Canada dummy | -2.035 (0.251) |
-0.903 (0.388) |
-5.565 (0.004) |
-4.551 (0.033) |
| Log |
-0.484 (0.125) |
-0.344 (0.224) |
-0.273 (0.263) |
|
| National accounting quality index | -0.035 (0.001) |
-0.023 (0.055) |
0.166 (0.203) |
0.240 (0.065) |
| Market value/Book value | 0.051 (0.211) |
0.111 (0.123) |
-0.651 (0.000) |
|
| MSCI member dummy | -4.346 (0.005) |
-5.040 (0.006) |
-5.195 (0.000) |
-3.339 (0.023) |
| Shareholder rights index | -0.174 (0.309) |
0.651 (0.227) |
2.631 (0.000) |
3.062 (0.000)
|
| Dummy for dividend-paying firms | -2.106 (0.297) |
-1.156 (0.399) |
-1.021 (0.515) |
|
| Home-country dividend withholding tax rate faced by U.S. investors | 0.034 (0.382) |
-0.264 (0.121) |
||
| Firm-level accounting quality index | -0.383 (0.000) |
-0.206 (0.001) |
-1.399 (0.003) |
-3.307 (0.000) |
| English home language dummy | -0.919 (0.000) |
-1.026 (0.000) |
-4.535 (0.040) |
-7.727 (0.002) |
| Foreign Sales as a proportion of total sales (%) | 0.031 (0.134) |
|||
| Number Not Cross-Listed | 7797 | 4974 | 9190 | 7286 |
| Number Cross-Listed | 270 | 181 | 124 | 95 |
| Adjusted R-squared | 0.05 | 0.06 |
![]()
![]() Standard errors are from ``not cross-listed'' specification in
Table III under the assumption that the cross-listed coefficients equal zero.
Standard errors are from ``not cross-listed'' specification in
Table III under the assumption that the cross-listed coefficients equal zero.
Table A-I Definitions of Explanatory Variables
This table provides definitions and sources for the explanatory variables
(instruments) used in the simultaneous estimation of the cross-listing and
U.S. investment decisions. The table also indicates the instrument sets in
which a variable is included.
![]() is set of instruments for
the cross-listing equation (1),
is set of instruments for
the cross-listing equation (1),![]() the set for the listed holdings
equation (4), and
the set for the listed holdings
equation (4), and ![]() the set for the unlisted holdings equation (5).
the set for the unlisted holdings equation (5).
Variable Firm-level variables |
Included in: |
Definition |
|---|---|---|
| Total assets |
|
Logarithm of the 1997 book value of firms' assets from Worldscope, included as measures of firm size. |
| Financial firm dummy |
|
Dummy variable that takes on the value of one when a firm is identified by Worldscope as belonging to industry SIC Codes 60-69 in 1997. |
| Proportion of shares held by insiders (%) |
|
Worldscope's 1997 value for the number of closely held shares as a percentage of common shares outstanding, adjusted to remove those stakes mistakenly counted as insider ownership by Worldscope. These include holdings by the Bank of New York, Morgan Guarantee Trust, and Citibank, because these shares are holdings for ADR programs, and the New Zealand Central Securities Depository. |
| MSCI index membership dummy |
|
Dummy variable equal to one when a firm is included as a member of the MSCI All-country World index at the end of 1997. |
| Dummy for dividend-paying firm |
|
Dummy variable equal to one when a firm pays a dividend in 1997, as reported by Worldscope. |
| Market-to-book value ratio |
|
Year-end closing share price divided by the per-share book value of equity in 1997, as reported by Worldscope. |
| Foreign sales as a proportion of total sales (%) | Proportion of sales generated from operations in foreign countries relative to total sales in 1997, as reported by Worldscope. | |
| Canada dummy | Dummy variable set equal to one for Canadian firms. | |
| Firm-level accounting quality index | The firm-level accounting quality measure ranges from zero to four and is calculated using criteria from Aggarwal, Klapper, and Wysocki (2003). Each of the four dummy variable components takes a value of one if the firm used a BigSix auditor, received a clean audit report, used international accounting standard or US GAAP, or had consolidated reports. The measure is the sum of the four components. |
Variable Country-level variables |
Included in: |
Definition |
|---|---|---|
| Home-country trading value/GDP(%) | |
1997 dollar volume of trading in the home market of a firm, normalized by the dollar value of the country's 1997 gross domestic product (GDP). The volume data are obtained from the IFC (1998) and the GDP figures are collected from the International Monetary Fund's International Financial Statistics. |
| Home-country dividend withholding tax rate faced by U.S. investors | For countries maintaining a bilateral tax treaty with the United States, we use the treaty tax rate, as reported in the IRS publication 901, U.S. Tax Treaties. For countries with no U.S. tax treaty, we calculate dividend withholding rates from 1997 gross and net dividend payments to holders of ADRs, as reported in Bloomberg's Corporate Action Calendar. | |
| Germanic home language dummy | |
Dummy variable set equal to one for firms domiciled in a country in which a Germanic language--Danish, Dutch, English, German, Norwegian, or Swedish--is an official language. |
| English home language dummy | Dummy variable that equals one if the company's domicile is a country in which English is an official language. | |
| National accounting quality index |
|
Values for 1995 reported by Bushman, Piotroski, and Smith (2003). Compiled by the Center for Financial Analysis and Research, the index averages across firms within a given country the number of items, out of a possible maximum of 90, that are included as part of a firm's financial statements. |
| Shareholder rights index |
|
Calculated by La Porta, Lopez-de-Silanes, Shleifer, and Vishny (1998). Index takes on a value between 0 and 6 depending on how many of the following applies to a country's equity market: percentage of outstanding shares required to call an extraordinary meeting less than or equal to 10 percent, cumulative voting or proportional representation of minority interests on board, voting by mail permitted, mechanisms in place for oppressed minority investors, preemptive right that can only be waived by a shareholder vote, and protection of shareholders from requirements that shares be deposited before a shareholder meeting. |
Figure 1: Shifted Inverse Logistic Distribution Function
![Figure 1 displays the shifted inverse logistic distribution function, along with a straight line. The range of the x-axis is [0,1]; the range of the y-axis is [-3,+7]. The shifted inverse logistic distribution function starts at (x,y)=(0,-2.2), initially slopes steeply and positively upward but with diminishing positive slope, inflects at (0.5, 0), then slopes increasingly steeply to (0.9, 6). A straight line is plotted from approximately (0,-1.8) to (0.8,1.8).](Figure1.gif)
Footnotes
1. A similar positive association between cross-listing and U.S. investor interest has been noted by Foerster and Karolyi (1999), Ahearne, Griever, and Warnock (2004), and Edison and Warnock (2004). Feng and Seasholes (2004) obtain a complementary result using regional data from Chinese stock markets. Return to text
2. For further discussion of home bias and evidence of home bias on the part of investors in other countries, see Lewis (1999), Karolyi and Stulz (2002), Bertaut and Kole (2004), and Lane and Milesi-Ferretti (2004). Return to text
3. Griever, Lee, and Warnock (2001) provide a primer on the survey, which excludes holdings for control purposes, defined to be individual holdings of 10 percent of shares outstanding. Excluding these large holdings is likely to have little impact in our sample because it is relatively uncommon for a single U.S. investor to hold more than 10 percent of a publicly traded foreign company. Complete details of the 1997 survey, including forms, instructions, and data, are available from http://www.ustreas.gov/tic/fpis.html. Return to text
4. For example, one cross-check involves comparing the subset of our survey data that overlaps with data on U.S. institutional investors' holdings as reported to the SEC on Form 13(f), which covers institutional holdings of non-U.S. securities that are traded in the United States. Two complications arise. First, 13(f) filings should exclude holdings in a foreign security underlying an American Depositary Receipt (ADR) and in securities that do not trade in U.S. markets. Second, holdings of foreigners are intermingled with U.S. holdings in 13(f) data because institutions are permitted to consolidate their 13(f) holdings across subsidiaries, including foreign ones. Return to text
5. Specifically, we exclude holdings by the Bank of New York, Morgan Guarantee Trust, and Citibank, because these shares are likely to be holdings for ADR programs, and the New Zealand Central Securities Depositary. There are other reasons to believe that the Worldscope measure of insider holdings contains significant measurement error. Worldscope coverage of the ``closely held shares'' field is uneven, and reporting requirements differ across countries. Moreover, it is unclear whether the classifications within Worldscope of what constitutes a closely held share conform well to theory on who gains private benefits from control and who would be willing to sell to a U.S. investor. For example, the measure includes holdings of large, unaffiliated blockholders. Return to text
6. We exclude six countries with some Worldscope coverage but minimal U.S. holdings: Egypt, Jordan, Morocco, Slovakia, Sri Lanka, and Zimbabwe. Worldscope has 1997 data for a total of 42 firms from these countries. Return to text
7. An ADR is a traded financial claim backed by a set number of equity shares in the underlying company. ADRs are created when firm initiates a relationship with a broker that buys the firm's shares and instructs a U.S. financial institution, called a ``depositary,'' to hold the shares in custody and issue negotiable securities backed by the shares, the ``receipts,'' to an interested investor. Only ``Level II'' and ``Level III'' ADRs list and trade on one of the major U.S. stock exchanges. Return to text
8. For the practitioner's perspective, see Fanto and Karmel (1997) or the cross-listing sales pitches on the ADR websites at the Bank of New York (www.adrbny.com) and JPMorgan (www.adr.com/research/about_ types.html). For academic arguments, see Merton (1987), Miller (1999), Foerster and Karolyi (1999), Karolyi and Stulz (2002), and Doidge, Karolyi, and Stulz (2004). Return to text
9. However, the term ``familiar'' has also been used to refer to how well-informed investors are about particular stocks. Merton's (1987) paper on expanding investor base required that new investors ``learn'' the first two moments of a stock's return. Moreover, Coval and Moskowitz (1999, 2001) and Ivkovic and Weisbenner (2003) study geographic preferences for holding stock and argue that investors ``buy local'' because they are better informed about companies that are close to where they live. In this context, familiarity implies that rational investors select stocks for which they have good information. Return to text
10. See, for example, the introductory discussion of truncated variables in Maddala (1983). In principal, U.S. holdings could be negative, but in practice, short positions are not reflected in the holdings survey. Similarly, with short positions held by others, it is conceivable that H could exceed 1, but in practice it is below 0.9. Return to text
11. For evidence demonstrating that outside investors avoid ownership in closely held companies, see La Porta, Lopez-de-Silanes, Shleifer, and Vishny (1999), Johnson, La Porta, Lopez-de-Silanes, and Shleifer (2000), and Lins and Warnock (2004). Return to text
12. For evidence on the opaqueness of financial firms, see Morgan (2002). Return to text
13. See Lang, Lins, and Miller (2003) and Khanna, Palepu, and Srinivasan (2003). Return to text
14. See La Porta, Lopez-de-Silanes, Shleifer, and Vishny (1998). Return to text
15. See Faccio, Lang, and Young (2001), Kalcheva and Lins (2004), Easterbrook (1984), and Jensen (1986). Return to text
16. Our English-language dummy variable could also capture cross-country institutional differences associated with legal origin because the legal system of most English-speaking countries grew out of English common law (see LaPorta, Lopez-de-Silanes, Shleifer, Vishny, 1998 and Rajan and Zingales, 2003). Return to text
17. Further evidence is provided by Ammer, Clinton, and Nini (2004), who find that either cross-listing in the United States or use of International Financial Reporting Standards reduces the bid-ask spreads of European financial firms in their home market, implying that disclosure is a key element of cross-listing. Return to text
18. La Porta, Lopez-de-Silanes, Shleifer, and Vishny (2002), Lins (2003), and Durnev and Kim (2004) find that non-U.S. firms are valued more highly when they are domiciled in a country with high-quality corporate governance, and have higher firm-level corporate governance. Gompers, Ishii, and Metrick (2003) find that U.S. firms with governance practices that promote shareholder rights outperformed the market during the 1990s, consistent with U.S. investors becoming increasingly attentive to shareholder rights. Return to text
19. To see this, let
![]() represent
our market-float adjusted holdings,
represent
our market-float adjusted holdings,
![]() represent
the market capitalization (unadjusted) holdings, and
represent
the market capitalization (unadjusted) holdings, and
![]() be our
measurement of the proportion of shares held by insiders. Then, by
definition,
be our
measurement of the proportion of shares held by insiders. Then, by
definition,
![]()
Suppose that the insider stake is measured with some error so
that
![]() where I
where I![]() is the insiders' true stake and
is the insiders' true stake and
![]() is some
white-noise error. Then,
is some
white-noise error. Then,
![]() In
other words, measurement error in the proportion of insider
holdings imparts a positive bias on the coefficient estimate in the
holdings model when scaled by market float. Intuitively, a positive
measurement error shock increase the right-hand-side variable
(measured proportion of shares held by insiders) as it also
increases the dependent variable (holdings, by reducing the
denominator). Return to
text
In
other words, measurement error in the proportion of insider
holdings imparts a positive bias on the coefficient estimate in the
holdings model when scaled by market float. Intuitively, a positive
measurement error shock increase the right-hand-side variable
(measured proportion of shares held by insiders) as it also
increases the dependent variable (holdings, by reducing the
denominator). Return to
text
20. Alternatively, one could
estimate the listing impact from the non cross-listed firms,
E(H![]() X=1) -
E(H
X=1) -
E(H![]() X=0), or use
both cross-listed and non cross-listed firms to generate an
unconditional listing impact, E(H
X=0), or use
both cross-listed and non cross-listed firms to generate an
unconditional listing impact, E(H![]() X=1) - E(H
X=1) - E(H![]() X=0). Heckman, Ichimura, Smith, and Todd (1998)
provide a nice overview of issues relating to the different
measures. Return to text
X=0). Heckman, Ichimura, Smith, and Todd (1998)
provide a nice overview of issues relating to the different
measures. Return to text
21. The standard error for the listing effect estimate is calculated as the observation-weighted standard deviation of the 270 paired differences. Return to text
22. Note that this result does not necessarily imply that any given stock in the unlisted sample could get the same surge in U.S. ownership from cross-listing. In fact, the outcome might be much different for an unlisted firm with characteristics that were much different from the typical stock in our cross-listed sample. Return to text
23. See Imbens (2004) and Stuart (2004) for recent reviews of the method-of-matching literature. Return to text
24. Our results are not sensitive to keeping or dropping the firms outside the support of listed firms. Return to text
25. In our sample, 23 of the 129 firms that cross-listed between the two survey dates also undertook seasoned equity offerings (SEOs). It is plausible that the combination of a SEO and cross-listing has different implications for U.S. holdings than a cross-listing alone, particularly if the issue targets U.S. investors. However, when we compare the change in U.S. holdings for cross-listing stocks with and without these SEOs, we find no statistically significant difference. Accordingly, we do not treat cross-listing firms that raise public equity differently from other cross-listing firms. For further evidence on the capital-raising behavior of cross-listed firms, see Reese and Weisbach (2002) and Henderson, Jegadeesh, and Weisbach (2004). Return to text
26. See ``Listed Companies FAQs'' page at www.nyse.com. Return to text
27. However, in a study of securities fraud cases involving Mexican cross-listed firms, Siegel (2004) argues that U.S. courts provided no protection or recourse for minority shareholders damaged by the fraudulent actions. Return to text
28. For the three variables--national accounting quality index, firm-level accounting quality index, and English home language home dummy--that are included in the non cross-listed holdings equation but excluded from the cross-listed holdings, we report the bootstrapped p-value and the negative of the estimate from the non cross-listed equation (i.e., we assume the coefficient on the excluded variables is the scalar zero). Return to text
This version is optimized for use by screen readers. A printable pdf version is available.