
Board of Governors of the Federal Reserve System
International Finance Discussion Papers
Number 961, December 2008 --- Screen Reader
Version*
Fiscal Policy in the European Monetary Union
NOTE: International Finance Discussion Papers are preliminary materials circulated to stimulate discussion and critical comment. References in publications to International Finance Discussion Papers (other than an acknowledgment that the writer has had access to unpublished material) should be cleared with the author or authors. Recent IFDPs are available on the Web at http://www.federalreserve.gov/pubs/ifdp/. This paper can be downloaded without charge from the Social Science Research Network electronic library at http://www.ssrn.com/.
Abstract:
A country entering the EMU surrenders its monetary policy, and its debt becomes denominated in terms of a currency over which it has no direct control. A country's promise to uphold the fiscal limits in the Maastricht Treaty and the Stability and Growth Pact is implicitly a promise not to allow its fiscal stance to deteriorate to a position in which it places pressure on the central bank to forgo its price level target to finance fiscal deficits. Violation of these limits has raised questions about potential fiscal encroachment on the monetary authority's freedom to determine the price level. We specify a simple model of fiscal policy in which the fiscal authority faces an upper bound on the size of its primary surplus. Policy is determined by a fiscal rule, specified as an error correction model, in which the primary surplus responds to debt and a target variable. We show that for the monetary authority to have the freedom to control price, the primary surplus must respond strongly enough to lagged debt. Using panel techniques that allow for unit roots and for heterogeneity and cross-sectional dependence across countries, we estimate the coefficients of the error correction model for the primary surplus in a panel of ten EMU countries over the period 1970-2006. The group mean estimate for the coefficient on lagged debt is consistent with the hypothesis that the monetary authority can control the price level in the EMU, independent of fiscal influence.
Keywords: European Monetary Union, monetary policy, fiscal policy, Fiscal Theory of the Price Level, panel cointegration, error correction
JEL classification: C32, C33, E42, E62, F33
1. Introduction
The joint responsibility of monetary and fiscal policy for price stability poses a potential problem for a monetary union. A single monetary authority and many fiscal authorities all have the potential to influence the price level. Recognizing possible conflicts of interest across national governments, the founders of the European Monetary Union (EMU) drafted limits in the Maastricht Treaty and the Stability and Growth Pact (SGP) to restrain fiscal expansion, by limiting deficits and debt relative to GDP. Their main objective was to eliminate fiscal influence on the price level, thereby assigning full responsibility for price stability to the European Central Bank (ECB). However, these fiscal limits have been violated by several countries with no apparent ill effects, seemingly strengthening arguments that the limits are unnecessary to minimize fiscal influence on the price level. This leaves an open question regarding the role of fiscal policy in determining the price level in the EMU.
We present a simple theoretical model of the joint behavior of real values for government debt and the primary surplus and use this model to derive the restrictions on fiscal policy necessary to give the monetary authority freedom to control the price level. We assume, consistent with actual practice, that governments issue nominal debt. Additionally, we assume that taxes are distortionary, implying that there is an upper bound on the value of taxes relative to output. The upper bound on the value of taxes in turn implies an upper bound on the value of the primary surplus and therefore an upper bound on the value of debt which the primary surplus must service. Fiscal policy is specified as a rule. We show that for the monetary authority to have freedom to control the price level in the presence of upper bounds, the fiscal rule must be restricted to eliminate paths along which debt explodes relative to output.
This work is related to empirical work on fiscal sustainability. Fiscal sustainability is interpreted as requiring satisfaction of the government's intertemporal budget constraint. The fiscal sustainability literature has typically focused on cointegration between real debt and real surplus measures (Trehan and Walsh 1991). However, Bohn (2007) demonstrates that cointegration is unnecessarily restrictive for satisfaction of the intertemporal budget constraint and argues that a positive response of the real primary surplus to real debt is sufficient. Bohn (2008) and Mendoza and Ostry (2006) provide estimates of the surplus response to debt to determine fiscal sustainability. Bohn finds a positive coefficient for the US, and hence sustainable fiscal policy, while Mendoza and Ostry find some emerging market countries have positive coefficients, while others do not.
This work is also related to papers which test whether fiscal policy is passive or active. A passive fiscal policy requires satisfaction of the intertemporal budget constraint for any sequence of prices and, hence, adjustment of the primary surplus to real debt. But since the government's intertemporal budget constraint holds in equilibrium even when fiscal policy is active, cointegration tests, based on the government's budget constraint, cannot distinguish between passive and active policies. VAR techniques, as in Canzoneri, Cumby, and Diba (2001), which determine how real debt responds to the surplus, are plagued by the fact that at low frequencies they move together (Cochrane 1998). Without an additional assumption on fiscal policy, determination of whether fiscal policy is passive or active is plagued by serious identification problems. Davig, Leeper, and Chung (2007) add the assumption, that fiscal policy follows a rule, to the model.2Under this assumption, the coefficient on debt can be used to infer whether fiscal policy is passive or active. Given a fiscal rule with time-invariant parameters, a positive coefficient on lagged debt is sufficient to assure that the present value of debt is always zero in the limit, irrespective of the initial real value of debt implied by the initial price level. This is a passive fiscal policy. Alternatively, if the coefficient on lagged debt is not positive, then the intertemporal budget constraint holds only for a unique initial real value of debt and hence for a unique initial price level. This is active fiscal policy, and equilibrium requiring intertemporal budget balance can be established only at the unique price level. Without the assumption that fiscal policy follows a rule, it would be impossible to reject the hypothesis of passive fiscal policy because the fiscal policy could change sometime in the future, a possibility unobservable to the econometrician, to assure intertemporal budget balance for any price level sequence.
The positive coefficient on lagged debt in a fiscal rule, required for fiscal policy to be sustainable and passive, is sufficient to imply that real debt is expected to grow more slowly than interest, but not to imply that it is expected to grow more slowly than its upper bound. When there is an upper bound on the value for debt, we use a simple theoretical model to determine the restrictions on the coefficients in the fiscal rule necessary to keep debt from exploding relative to its upper bound. We find that the primary surplus must rise in response to an increase in lagged debt by at least the value of the interest rate, and we refer to a fiscal policy with these restrictions as "strongly passive." If fiscal policy is not strongly passive, then the economy could be shocked into a position from which debt is expected to explode relative to its upper bound. Such a path cannot be an equilibrium. As in the Fiscal Theory of the Price Level (FTPL), this places pressure on the monetary authority to allow a price level jump such that the value of real debt jumps to a feasible path.3 Therefore, failure of fiscal policy to be strongly passive threatens the monetary authority's control of the price level.
We estimate the parameters of the fiscal rule with annual data on real debt and primary surpluses for a panel of ten EMU countries over the period 1970-2006. Our estimation technique for the fiscal rule differs from others in the literature by exploiting the time series characteristics of the data, with cointegration and error correction models. These variables are integrated of order one, and, in the presence of the upper bound, theory says that they should be cointegrated.4 Therefore, the fiscal rule can be expressed as an error correction model, and the objective of the empirical work is estimation of its parameters. Another advantage of our approach is that we estimate the parameters using panel data, allowing heterogeneity across countries in both the cointegrating parameters and in the loadings on the cointegrating vectors. Panel data techniques are increasingly used to test macroeconomic hypotheses like purchasing power parity and output convergence. Panels have greater power than the usual time series tests because they combine information from both the cross-section and the time dimension.
We find that over the sample period, fiscal policy has been sufficiently responsive to increases in debt in our panel of ten EMU countries to imply that it is strongly passive. This provides evidence that violation of the limits in the Maastricht Treaty and the SGP have not been serious enough to threaten the ability of the ECB to control the price level.
The paper is organized as follows. Section 2 describes the behavior of monetary and fiscal policy in a monetary union and derives the restrictions on the parameters of the fiscal rule necessary for a strongly passive policy. Section 3 contains the empirical analysis, and Section 4 provides conclusions.
2. Model
2.1 Goods and Asset Markets
We assume that countries in the monetary union are small enough that they cannot affect the world price level or world interest rate. There is a single good in the world, implying that equilibrium in goods markets requires the law of one price. Normalizing the world price level at unity and assuming no world inflation implies that, in equilibrium, the price level in the monetary union is the exchange rate.
We assume that international creditors are willing to buy and
sell government bonds in the monetary union as long as the interest
rate on these bonds
![]() satisfies interest rate
parity. Interest rate parity can be derived as the Euler equation
for a representative world agent when the covariance of the
monetary union interest rate with the world agent consumption is
zero, or when the world agent is risk neutral. Under the additional
assumption that the world interest rate
satisfies interest rate
parity. Interest rate parity can be derived as the Euler equation
for a representative world agent when the covariance of the
monetary union interest rate with the world agent consumption is
zero, or when the world agent is risk neutral. Under the additional
assumption that the world interest rate
![]() is constant, interest rate
parity can be expressed as
is constant, interest rate
parity can be expressed as
![$\displaystyle \frac{1}{1+r_{t}}=\left( \frac{1}{1+r}\right) E_{t}\left[ \frac{P_{t} }{P_{t+1}}\right] , $](img3.gif) |
(1) |
where ![]() denotes the expectation conditional on
time
denotes the expectation conditional on
time ![]() information and
information and ![]() denotes
the price level, and equivalently the exchange rate, in the
monetary union.
denotes
the price level, and equivalently the exchange rate, in the
monetary union.
The monetary authority can control expected inflation because it
can control the nominal interest rate
![]() . Interest rate parity
implies that the monetary authority's choice of the nominal
interest rate determines expected inflation.5 Leeper (1991)
demonstrated that in order for the monetary authority to control
the price level, fiscal policy must be passive. We show below that
in the presence of the upper bound, fiscal policy must be strongly
passive.
. Interest rate parity
implies that the monetary authority's choice of the nominal
interest rate determines expected inflation.5 Leeper (1991)
demonstrated that in order for the monetary authority to control
the price level, fiscal policy must be passive. We show below that
in the presence of the upper bound, fiscal policy must be strongly
passive.
2.2 Fiscal Policy
2.2.1 Government Flow Budget Constraint
Consider the flow government budget constraint for the
![]() country in a monetary union. Letting
country in a monetary union. Letting
![]() ,
, ![]() ,
,
![]() and
and ![]() denote,
respectively, nominal government spending, tax revenue, publicly
held government bonds, and the money supply backed by the
denote,
respectively, nominal government spending, tax revenue, publicly
held government bonds, and the money supply backed by the
![]() country's bonds at time
country's bonds at time ![]() ,
the
,
the ![]() government's nominal flow budget
constraint is given by
government's nominal flow budget
constraint is given by
Dividing by ![]() , the real values of debt and the
primary surplus can be expressed respectively as
, the real values of debt and the
primary surplus can be expressed respectively as
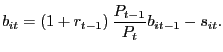
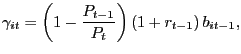
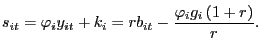
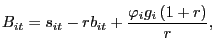
![$\displaystyle b_{it}=\frac{1}{P_{t}}\left[ B_{it}^{p}+\frac{1}{1+r_{t}}M_{it}\right] , $](img18.gif) |
![$\displaystyle s_{it}=\frac{1}{P_{t}}\left[ T_{it}+\frac{r_{t}}{1+r_{t}}M_{it} -G_{it}\right] . $](img19.gif) |
where
![]() is seigniorage
revenues returned to the
is seigniorage
revenues returned to the ![]() country by the monetary
authority.
country by the monetary
authority.
The government's real flow budget constraint can be expressed as
 |
(2) |
Imposing interest rate parity from equation (1) and defining
 |
(3) |
such that
![]() denotes positive inflation,
which reduces the real value of outstanding debt, the equation for
the evolution of real debt can be expressed as
denotes positive inflation,
which reduces the real value of outstanding debt, the equation for
the evolution of real debt can be expressed as
| (4) |
where
![]() represents unanticipated inflation or, equivalently, a price level
shock. Unanticipated inflation acts like a tax, which raises
revenue. Additionally, this equation reveals that real debt
accumulates in response to expectations of inflation, which are not
realized. Expectations of inflation raise the interest rate, and
when the inflation does not occur, debt accumulates in response to
the higher interest rate.
represents unanticipated inflation or, equivalently, a price level
shock. Unanticipated inflation acts like a tax, which raises
revenue. Additionally, this equation reveals that real debt
accumulates in response to expectations of inflation, which are not
realized. Expectations of inflation raise the interest rate, and
when the inflation does not occur, debt accumulates in response to
the higher interest rate.
2.2.2 Fiscal Policy Rule
Fiscal policy is defined by the behavior of the primary surplus. We assume that the fiscal authority is able to commit to a rule,6 and that the rule is determined by an optimization problem, which we do not explicitly model. The general nature of the optimization problem is as follows. Governments choose taxes and spending to maximize the expected present discounted value of utility of its own representative agent, subject to stochastic shocks and a flow budget constraint, allowing nominal debt to smooth the effect of shocks. Government spending yields utility, and taxes are distortionary with distortions increasing in the level of taxes as in Barro (1979). The distortionary nature of taxes implies that there is an upper bound on the value of taxes the government can raise. The upper bound on the value of taxes in turn implies an upper bound on the size of the primary surplus.7 Endowments, government spending, and taxes are subject to stochastic shocks due to politics, war, natural disasters, or business cycles. The fiscal rule we estimate is a parsimonious linear approximation to the reduced-form solution that such a model would imply.
The fiscal rule for the ![]() country is
given by
country is
given by
| (5) | |
| 0 |
where ![]() is a constant,
is a constant,
![]() measures
persistence in the primary surplus,
measures
persistence in the primary surplus,
![]() is the value for the target
surplus,
is the value for the target
surplus,
![]() is the upper bound on the
surplus, and
is the upper bound on the
surplus, and ![]() is a stochastic disturbance
representing fiscal shocks. The lagged value of the surplus
reflects the desire to smooth the effect of shocks over time.
Stochastic shocks reflect both politically-determined shocks to
taxes or government spending, and responses, perhaps
countercyclical or optimal tax, of the fiscal authority to the
fundamental shocks that affect the economy. The commitment to honor
debt for any sequence of shocks, which each country makes to enter
the monetary union, implies that the surplus should respond to
lagged debt. The surplus is assumed to adjust to a linear
combination of the target surplus and debt service with the weights
determined by
is a stochastic disturbance
representing fiscal shocks. The lagged value of the surplus
reflects the desire to smooth the effect of shocks over time.
Stochastic shocks reflect both politically-determined shocks to
taxes or government spending, and responses, perhaps
countercyclical or optimal tax, of the fiscal authority to the
fundamental shocks that affect the economy. The commitment to honor
debt for any sequence of shocks, which each country makes to enter
the monetary union, implies that the surplus should respond to
lagged debt. The surplus is assumed to adjust to a linear
combination of the target surplus and debt service with the weights
determined by
![]() . The assumption that each
government maximizes the utility of its own representative agent
implies that no government would choose to raise its surplus to
compensate for a low surplus in a member country,8
implying that the debt and surplus of other member countries have
no effect on the surplus.
. The assumption that each
government maximizes the utility of its own representative agent
implies that no government would choose to raise its surplus to
compensate for a low surplus in a member country,8
implying that the debt and surplus of other member countries have
no effect on the surplus.
To complete the model of fiscal policy, it is necessary to make
some assumptions about the behavior of the target surplus and the
upper bound on the surplus in an economy with growing income. We
assume that both the target
![]() and the upper
bound
and the upper
bound
![]() on the surplus
are linear in real GDP
on the surplus
are linear in real GDP
![]() and test the
assumption on the target surplus in the empirical implementation.
The target surplus and its upper bound are given respectively by
and test the
assumption on the target surplus in the empirical implementation.
The target surplus and its upper bound are given respectively by
| (6) |
| (7) |
where ![]() represents the country specific fixed
effects and
represents the country specific fixed
effects and
![]() represents the
heterogeneous country specific percentages of real GDP.
Substituting for the target surplus in equation (5) yields a fiscal
rule in which the surplus responds to the lagged surplus, lagged
debt, lagged output, and an error term.
represents the
heterogeneous country specific percentages of real GDP.
Substituting for the target surplus in equation (5) yields a fiscal
rule in which the surplus responds to the lagged surplus, lagged
debt, lagged output, and an error term.
Finally, we must specify a dynamic process for real GDP. We assume that real GDP is independent of the government surplus and debt and that it is integrated of order one, consistent with our empirical evidence presented below. Additionally, since the model for the surplus and debt is linear in levels, we approximate geometric growth in GDP with linear growth and assume that real GDP is determined by9
| (8) |
where ![]() reflects autocorrelation in growth,
reflects autocorrelation in growth,
![]() is the equilibrium growth rate, and
is the equilibrium growth rate, and
![]() is a well-behaved output shock.
is a well-behaved output shock.
The value for ![]() in equation (5) is determined
to allow an equilibrium in which the primary surplus equals its
target
in equation (5) is determined
to allow an equilibrium in which the primary surplus equals its
target
![]() , and the
growth in debt service
, and the
growth in debt service
![]() equals the growth in the
primary surplus
equals the growth in the
primary surplus
![]() . Letting
. Letting
![]() substituting into equation (5), and
rearranging yields
substituting into equation (5), and
rearranging yields
| (9) |
Equation (9) is an error correction representation of the fiscal rule with two error correction terms. Substituting equation (9) into the government's flow budget constraint, given by equation (4), yields
| (10) |
Equations (8), (9), and (10) are the dynamic equations of the model, written to reveal the nature of a stationary equilibrium. In a stationary equilibrium, the primary surplus equals its target and pays less than the interest rate on debt, allowing debt service to grow with output. The relationship between the variables in the stationary equilibrium is given by
 |
(11) |
Deviations from these values, due to shocks, are stationary with
the system expected to return to the equilibrium relationship in
the future. When equation (11) holds, the
primary surplus is expected to change by
![]() from equation
(10) and debt is expected to change by
from equation
(10) and debt is expected to change by
![]() from
equation (10). Since output is expected to change by
from
equation (10). Since output is expected to change by ![]() , variables are
expected to retain the relationship given by equation (11).
, variables are
expected to retain the relationship given by equation (11).
Note that the implications of the error correction model for the surplus are consistent with the implications of Barro's tax smoothing model (1979), except for the presence of the upper bound. A permanent increase in government spending should have no effect on the surplus as taxes optimally adjust and there is no shock to the surplus. A transitory increase in government spending is captured by a negative residual, creating a decrease in the surplus and an increase in debt. Next period, if the shock has vanished, the error correction terms begin to bring the surplus back up, reducing the debt. If the error is autocorrelated, the adjustment is delayed. In any event, the reduction in the surplus is temporary. The model differs from Barro because the upper bound implies that debt does not permanently increase, but must be brought down by future surpluses.
2.3 Stability and Dynamics in Equilibrium
Defnition 1 Given constant values for the world interest rate and the world price level, a time series process for each yit from equation (8), a fiscal rule for each of the i countries from equation (9), and an upper bound on each country's primary surplus from equation (7), an equilibrium is a set of time series processes for the monetary union price level, Pt, and for each country's primary surplus and debt, sit and bit, such that each government's flow budget constraint, given by equation (10), holds, the debt for each country is not expected to exceed its upper bound, and world agents expect to receive the return on assets determined by interest rate parity, equation (1).
The time paths for each country's surplus and debt can be determined by solving equations (8), (9), and (10). Denoting deviations of the primary surplus from its equilibrium values, given respectively by output and debt service, and deviations of output growth from its equilibrium value as
 |
the system can be rearranged as
Note, first, that the definition of equilibrium is inconsistent with paths along which debt and the primary surplus explode relative to their equilibrium values, determined by output. An exploding debt would increase the primary surplus toward its upper bound. Beyond that point the primary surplus could not increase further to service increasing debt, implying that agents would not lend along such a path in equilibrium. Therefore, a dynamic equilibrium requires that the dynamic system for each country be either globally stable or saddlepath stable. Stability implies that the deviations of the primary surplus about its equilibrium values should fluctuate about zero, and thus ruling out paths along which the surplus and debt explode relative to output. If the primary surplus, debt, and output are integrated of order one, then existence of either a saddlepath stable or a globally stable equilibrium implies cointegration among these variables. This is the first testable hypothesis of the model, but cointegration alone does not allow inference about whether fiscal policy is passive or active.10
Letting
![]() represent eigenvalues, the
characteristic equation for a country is given by
represent eigenvalues, the
characteristic equation for a country is given by
| (12) |
We assume that the eigenvalues of the characteristic equation for
each country are real and distinct. The ![]() are
empirically less than one.11 We also assume that the errors are
independent and identically distributed.12 If the remaining
eigenvalues of the characteristic equation for the
are
empirically less than one.11 We also assume that the errors are
independent and identically distributed.12 If the remaining
eigenvalues of the characteristic equation for the ![]() country are within the unit circle, then the economic
system for the
country are within the unit circle, then the economic
system for the ![]() country is globally stable.
Global stability for each country implies global stability for the
monetary union as a whole. With global stability, each country is
expected to reach an equilibrium, characterized by equation
(11), for any initial values of the state variables or shocks, where shocks
include the surplus shock
country is globally stable.
Global stability for each country implies global stability for the
monetary union as a whole. With global stability, each country is
expected to reach an equilibrium, characterized by equation
(11), for any initial values of the state variables or shocks, where shocks
include the surplus shock
![]() , the output shock
, the output shock
![]() , and the price
level shock
, and the price
level shock
![]() . This leaves
the monetary authority free to choose the price level in
equilibrium, which implies values of
. This leaves
the monetary authority free to choose the price level in
equilibrium, which implies values of
![]() for each
country.
for each
country.
Alternatively, if one of the eigenvalues of the characteristic
equation for one country is outside of the unit circle, then the
economic system is only saddlepath stable. If the system is to
reach an equilibrium, then one of the variables must be a jumping
variable in order to set the coefficient on the unstable eigenvalue
equal to zero. The only candidate is the real value of debt through
a price level surprise
![]() This implies
that if the system is to attain an equilibrium, then the monetary
authority is not free to choose the price level.
This implies
that if the system is to attain an equilibrium, then the monetary
authority is not free to choose the price level.
If two or more countries have a saddlepath-stable system, then the price level jump can only assure that debt for the monetary union as a whole is not explosive. Without upper bounds, Dupor's work (2000) can be used to show that monetary policy freedom to control price requires passive fiscal policy for the aggregated member countries, not for each member country. However, if one country's debt embarks upon an explosive path and union debt does not, then there is some member country whose debt in on an implosive path, as it taxes its citizens and transfers resources to the other country.13 Given the reasonable assumption that governments choose fiscal policy to maximize the welfare of their own citizens, no country would choose such a policy. Therefore, the relevant criterion for monetary policy freedom is strongly passive fiscal policy for each country, not for the set of aggregated countries. Note also, that explosive debt for a single country would violate the upper bound required for equilibrium, confirming that each country must have a stable system.
Equation (12) can
be used to show that global stability for each country requires
that all
![]() This assures that all roots
are within the unit circle.14 Our criteria is related to criteria
explored by other authors for fiscal policy to be sustainable and
for fiscal policy to be passive. Passive and sustainable fiscal
policy, in the absence of upper bounds, requires that the
government's intertemporal budget constraint hold, or,
equivalently, that the present value of debt go to zero in the
limit.15 This criteria, which requires only
This assures that all roots
are within the unit circle.14 Our criteria is related to criteria
explored by other authors for fiscal policy to be sustainable and
for fiscal policy to be passive. Passive and sustainable fiscal
policy, in the absence of upper bounds, requires that the
government's intertemporal budget constraint hold, or,
equivalently, that the present value of debt go to zero in the
limit.15 This criteria, which requires only
![]() is weaker than the one we
consider. Under passive fiscal policy, with the standard assumption
that the real interest rate exceeds the rate of growth of output,
debt and debt service could grow faster than output, eventually
exceeding any specific fraction of output. When taxes are
distortionary, this cannot represent an equilibrium.16
Passive fiscal policy restricts debt to grow more slowly than the
interest rate in the limit, while strongly passive policy restricts
it to grow more slowly than output in the limit.
is weaker than the one we
consider. Under passive fiscal policy, with the standard assumption
that the real interest rate exceeds the rate of growth of output,
debt and debt service could grow faster than output, eventually
exceeding any specific fraction of output. When taxes are
distortionary, this cannot represent an equilibrium.16
Passive fiscal policy restricts debt to grow more slowly than the
interest rate in the limit, while strongly passive policy restricts
it to grow more slowly than output in the limit.
To summarize, when governments maximize the welfare of their own
agents and taxes are distortionary, implying an upper bound on the
value of the debt, an equilibrium, in which the monetary authority
has freedom to choose the price level, requires that the system of
equations containing the debt and surplus for each country be
globally stable. Under the assumption that the fiscal authority
follows a rule with time-invariant parameters, global stability is
assured when the response of the primary surplus to debt is
sufficiently strong in each country, such that
![]() for all
for all ![]() countries.
countries.
It is important to recognize that the assumption that fiscal policy follows a rule with time-invariant parameters is an assumption. Even if we found that the response of the primary surplus to lagged debt were too small for both eigenvalues to be within the unit circle, the monetary authority could still control the price level if the government were expected to adjust the primary surplus in the future in some way that differs from the current estimated rule (Davig, Leeper, Chung 2007). However, promises of future changes to resolve current insolvency might not be credible. The justification for a rule is that it enhances transparency and credibility of policy and avoids problems of dynamic inconsistency.
3. Empirical Results
The purpose of the empirical work is to provide estimates of the
parameters in the fiscal rule, given by equation (9). The estimated
values for
![]() allow determination of whether
the ECB has the ability to control the price level or not.
Additionally, estimation of the fiscal rule provides parameter
values which other researchers can use to calibrate fiscal policy.
We have annual data on the real primary surplus,
allow determination of whether
the ECB has the ability to control the price level or not.
Additionally, estimation of the fiscal rule provides parameter
values which other researchers can use to calibrate fiscal policy.
We have annual data on the real primary surplus, ![]() , real debt,
, real debt, ![]() , and real GDP,
, and real GDP,
![]() , for the period 1970-2006 for a panel
of ten EMU countries.17 We assume that there is no
structural break in the fiscal rule over the sample and test this
assumption, failing to reject the null of no structural break, at
the end of the section.
, for the period 1970-2006 for a panel
of ten EMU countries.17 We assume that there is no
structural break in the fiscal rule over the sample and test this
assumption, failing to reject the null of no structural break, at
the end of the section.
First, we establish that the variables behave as unit root
processes,
![]() . We use panel unit root
tests which have more power than the time series unit root tests.
Following Im, Pesaran and Shin (2003), we test the null hypothesis
that all series in the panel contain a unit root, against the
alternative hypothesis that some of the series in the heterogeneous
panel are stationary. The test is based on the average of
. We use panel unit root
tests which have more power than the time series unit root tests.
Following Im, Pesaran and Shin (2003), we test the null hypothesis
that all series in the panel contain a unit root, against the
alternative hypothesis that some of the series in the heterogeneous
panel are stationary. The test is based on the average of
![]() individual augmented Dickey-Fuller (1979)
(ADF)
individual augmented Dickey-Fuller (1979)
(ADF) ![]() -statistics. The tests all include an
individual specific constant and trend. They are computed
alternately using one lag, two lags, and heterogeneous numbers of
lags across countries, with the lag order estimated using
consistent information criteria such as the Akaike and Schwarz
criteria. Table 1 reports the results with one lag. All the tests
fail to reject the null hypothesis of a unit root in
-statistics. The tests all include an
individual specific constant and trend. They are computed
alternately using one lag, two lags, and heterogeneous numbers of
lags across countries, with the lag order estimated using
consistent information criteria such as the Akaike and Schwarz
criteria. Table 1 reports the results with one lag. All the tests
fail to reject the null hypothesis of a unit root in ![]() ,
, ![]() and
and ![]() at the 5
percent level, implying that the variables
at the 5
percent level, implying that the variables ![]() ,
,
![]() and
and ![]() are
are
![]() .18
.18
Given that the variables in the fiscal rule appear to behave as unit root processes, equation (9) takes the form of an error correction model. There is a cointegrating vector between the real primary surplus and real GDP and between the real primary surplus and real debt, implied by the equilibrium relationships, which are represented as error correction terms. The real primary surplus adjusts to these two error correction terms.
Since the time dimension of our sample is not long enough to
allow estimation of an error correction model for each country with
inferences for values of each
![]() , we use panel techniques. In the
panel, we allow parameters in the fiscal rule to differ across
countries. We model heterogeneity across countries by allowing each
country's policy parameters to differ randomly from the EMU policy
parameters,
, we use panel techniques. In the
panel, we allow parameters in the fiscal rule to differ across
countries. We model heterogeneity across countries by allowing each
country's policy parameters to differ randomly from the EMU policy
parameters,
![]() , where
, where
![]() are the EMU panel policy parameters,
and
are the EMU panel policy parameters,
and
![]() have zero-means and
constant variances for all
have zero-means and
constant variances for all ![]() and
and
![]() . We obtain group mean panel estimates of
the EMU policy parameters,
. We obtain group mean panel estimates of
the EMU policy parameters, ![]() , which we call
, which we call
![]() . For the parameter of primary
interest,
. For the parameter of primary
interest, ![]() we test whether each country's
individual estimate of
we test whether each country's
individual estimate of
![]() differs from the
differs from the
![]() .
.
To estimate the error correction model in (9), we employ a
two-step procedure. In the first step, the cointegrating parameters
![]() and
and
![]() are estimated. Even
though theory implies that the real interest rates should be
identical across countries, we allow them to vary due to possible
differences in the definitions of debt or the primary surplus
across countries. In the second step, the estimated cointegrating
coefficients are used to obtain the group mean panel estimates of
the parameters,
are estimated. Even
though theory implies that the real interest rates should be
identical across countries, we allow them to vary due to possible
differences in the definitions of debt or the primary surplus
across countries. In the second step, the estimated cointegrating
coefficients are used to obtain the group mean panel estimates of
the parameters,
![]() and
and
![]() . The main focus of this paper
is obtaining an estimate of the parameter,
. The main focus of this paper
is obtaining an estimate of the parameter,
![]() and testing whether it is
significantly larger than one.
and testing whether it is
significantly larger than one.
Next, we confirm the existence of cointegrating relationships
between the real primary surplus and real debt, and between the
real primary surplus and real GDP using the group mean panel
cointegration ![]() tests suggested by Pedroni (1999,
2004).19 Both tests are residual-based
cointegration tests, which test the null hypothesis that the
variables of interest are not cointegrated for all the countries in
the panel against the alternative hypothesis that there exists a
heterogeneous cointegration vector for all the countries in the
panel. We estimate the following cointegrating model
tests suggested by Pedroni (1999,
2004).19 Both tests are residual-based
cointegration tests, which test the null hypothesis that the
variables of interest are not cointegrated for all the countries in
the panel against the alternative hypothesis that there exists a
heterogeneous cointegration vector for all the countries in the
panel. We estimate the following cointegrating model
| (13) |
where ![]() denotes the country specific fixed
effects,
denotes the country specific fixed
effects, ![]() is the real primary surplus,
is the real primary surplus,
![]() is the regressor,
is the regressor, ![]() or
or ![]() , and
, and ![]() is the cointegrating parameter,
is the cointegrating parameter, ![]() or
or
![]() . Under the null
hypothesis of no cointegration, the residuals,
. Under the null
hypothesis of no cointegration, the residuals,
![]() , are
, are
![]() . Denoting the
autoregressive coefficient of the
. Denoting the
autoregressive coefficient of the ![]() country's residuals by
country's residuals by
![]() , the group mean statistics test
the null hypothesis of no cointegration,
, the group mean statistics test
the null hypothesis of no cointegration,
![]() for all
for all ![]() ,
versus the heterogeneous alternative hypothesis,
,
versus the heterogeneous alternative hypothesis,
![]() for all
for all ![]() .
The alternative does not presume a common value for
.
The alternative does not presume a common value for
![]() . The first group mean test
uses semi-parametric corrections, while the second is a parametric
ADF test. The tests are extensions of the single time series
Phillips-Perron (1988)
. The first group mean test
uses semi-parametric corrections, while the second is a parametric
ADF test. The tests are extensions of the single time series
Phillips-Perron (1988) ![]() -test and the ADF
-test and the ADF
![]() -test.20 We account for cross-sectional
dependence and cross-member cointegration by using common time
effects.21 For the semi-parametric test we use
the Bartlett kernel and the Newey-West bandwidth selection
procedure, and for the parametric ADF-type test, we use the
step-down procedure to estimate the number of lags. The results,
reported in Table 2, indicate that both tests reject the null
hypothesis of no cointegration at the 5 percent level.22
Pedroni's tests provide strong evidence that
-test.20 We account for cross-sectional
dependence and cross-member cointegration by using common time
effects.21 For the semi-parametric test we use
the Bartlett kernel and the Newey-West bandwidth selection
procedure, and for the parametric ADF-type test, we use the
step-down procedure to estimate the number of lags. The results,
reported in Table 2, indicate that both tests reject the null
hypothesis of no cointegration at the 5 percent level.22
Pedroni's tests provide strong evidence that ![]() and
and ![]() are cointegrated and that
are cointegrated and that
![]() and
and ![]() are
also cointegrated.
are
also cointegrated.
We confirm that there are two cointegrating relations in the
trivariate model using the system panel cointegration test proposed
by Larsson, Lyhagen and Lothgren (2001). Their test is a panel
version of Johansen's (1988, 1995) full information maximum
likelihood method. The null hypothesis is that all of the
![]() countries in the panel have at most
countries in the panel have at most
![]() cointegrating relationships among the 3
variables,
cointegrating relationships among the 3
variables, ![]() cointegrating relations for all
cointegrating relations for all
![]() and the alternative is that all the
countries have 3,
and the alternative is that all the
countries have 3, ![]() cointegrating
relations for all
cointegrating
relations for all ![]() This is a sequential
procedure where first
This is a sequential
procedure where first ![]() is tested. If this
hypothesis is rejected,
is tested. If this
hypothesis is rejected, ![]() is tested. The sequential
procedure continues until the null is not rejected or the
hypothesis
is tested. The sequential
procedure continues until the null is not rejected or the
hypothesis ![]() is rejected. The test is computed
using one-lag difference terms and it includes individual specific
fixed effects. In Table 3 we verify that there are two
cointegrating relations in the model. The panel test statistic
indicates that
is rejected. The test is computed
using one-lag difference terms and it includes individual specific
fixed effects. In Table 3 we verify that there are two
cointegrating relations in the model. The panel test statistic
indicates that ![]() in the model with three
variables
in the model with three
variables ![]() ,
, ![]() and
and
![]() . This implies that there is a single
stochastic trend in the data, implying that there are cointegrating
relations between
. This implies that there is a single
stochastic trend in the data, implying that there are cointegrating
relations between ![]() and
and ![]() and between
and between ![]() and
and
![]() consistent with previous
results.
consistent with previous
results.
To estimate the cointegrating parameters, we use Pedroni's
(2000, 2001) group mean fully modified OLS (FMOLS) procedure for
cointegrated panels, which is based on equation (13).23 The
group mean FMOLS procedure accommodates the heterogeneity that is
typically present both in the transitional serial correlation
dynamics and in the long run cointegrating relationships. It is a
semi-parametric approach that adjusts for the effects of endogenous
regressors and short-run dynamics of the errors.24 We
use the Bartlett kernel and the Newey-West bandwidth selection
procedure as suggested by Pedroni (2000). The results, in Table 4,
indicate that the group mean panel estimate for the real interest
rate is 4.22 percent
![]() and for the
target primary surplus is 3.88 percent of GDP
and for the
target primary surplus is 3.88 percent of GDP
![]() .25
.25
In the final step we consider estimation of the group mean panel
fiscal policy parameters
![]() and
and
![]() . It is important to recognize
that the error term in equation (9) could be
autocorrelated in the data. If so, then the error could be
correlated with the right-hand-side variables, biasing estimates of
the coefficients on the error-correction terms. Therefore, we use
Sims' (1980) likelihood ratio test to determine the appropriate
number of lags to fully capture the dynamics for each country. For
some countries, the test chooses a single lag in levels, implying
that equation (9) is
appropriately specified. However, for others, two lags are chosen.
Therefore, to be sure that we are not omitting relevant lags and
thereby biasing estimates of coefficients, we estimate the model
with an additional lag, such that the error-correction
specification becomes26
. It is important to recognize
that the error term in equation (9) could be
autocorrelated in the data. If so, then the error could be
correlated with the right-hand-side variables, biasing estimates of
the coefficients on the error-correction terms. Therefore, we use
Sims' (1980) likelihood ratio test to determine the appropriate
number of lags to fully capture the dynamics for each country. For
some countries, the test chooses a single lag in levels, implying
that equation (9) is
appropriately specified. However, for others, two lags are chosen.
Therefore, to be sure that we are not omitting relevant lags and
thereby biasing estimates of coefficients, we estimate the model
with an additional lag, such that the error-correction
specification becomes26
| (14) | ||
A perisistent, but negative surplus shock, perhaps created by a war, would imply a negative error in the first cointegrating relation and rising past government debt, implying a negative correlation between the two terms. Therefore, failure to include the lagged change in debt could bias the estimate on the coefficient on the error in the cointegrating residual.27
Now, consider estimation of the coefficients on the error
correction terms in equation (14). First, we use
the estimated cointegrating parameters of the interest rate and
target surplus to construct the error correction terms for each
country. Then we estimate the coefficients of the error correction
model, augmented with lagged changes in variables, providing
estimates for
![]() and
and
![]() . We use the group mean
procedure recommended by Pesaran and Smith (1995).28
. We use the group mean
procedure recommended by Pesaran and Smith (1995).28
For the second step of the two-step procedure, in which the
cointegrating parameters are estimated first and used to construct
the error correction terms for use in the second step, all the
variables in the model (14) are stationary.
Asymptotically, the fact that we use the estimated error correction
terms rather than the true error correction terms in (14) does not affect
the standard properties of our estimates due to the
super-consistency properties of the estimator of the cointegrating
relationships.29Table 5 indicates that
![]() and
and
![]() where
where
![]() is significantly larger than
one.30 Our estimates also imply substantial
persistence in the surplus equation,
is significantly larger than
one.30 Our estimates also imply substantial
persistence in the surplus equation,
![]()
The theory requires that each country's
![]() , not that the
group mean estimate,
, not that the
group mean estimate,
![]() be greater than one. We test
whether each country's individual estimate of
be greater than one. We test
whether each country's individual estimate of
![]() is
statistically significant different from
is
statistically significant different from
![]() . We do not reject the null
hypothesis that each country's parameter is equal to the group mean
at the 5 percent level. Therefore, since all
. We do not reject the null
hypothesis that each country's parameter is equal to the group mean
at the 5 percent level. Therefore, since all
![]() are not statistically
significant different from the
are not statistically
significant different from the
![]() , and since the
, and since the
![]() estimate is significantly
larger than one, our best inference is that all
estimate is significantly
larger than one, our best inference is that all
![]() , implying the fiscal policy
in the EMU is sufficiently responsive to debt for the system to be
globally stable. Using our terminology, we cannot reject the null
that fiscal policy in each country is strongly passive, allowing
monetary policy to determine the price without fiscal influence. We
note also, that our tests imply fiscal sustainability and passive
fiscal policy since the criteria for both is a positive value for
, implying the fiscal policy
in the EMU is sufficiently responsive to debt for the system to be
globally stable. Using our terminology, we cannot reject the null
that fiscal policy in each country is strongly passive, allowing
monetary policy to determine the price without fiscal influence. We
note also, that our tests imply fiscal sustainability and passive
fiscal policy since the criteria for both is a positive value for
![]()
We have not allowed estimates of the parameters of the error
correction model to change as the monetary union has evolved over
time. However, if the coefficients in the cointegrating
relationships had changed and no account were taken for the change,
then we should not have rejected the null of no cointegration. The
values for the coefficients on the error correction terms could
have changed. To test for a change in ![]() , we
break the sample into two sub-periods, the pre-Maastricht era and
the post-Masstricht era. Table 6 shows that
, we
break the sample into two sub-periods, the pre-Maastricht era and
the post-Masstricht era. Table 6 shows that
![]() in both sub-samples is larger
than one and similar in size, although variances are too high to
yield significance. The split sample evidence is consistent with
the hypothesis that the surplus is sufficiently responsive to debt
to give the monetary authority control of the price level in both
sub-samples.31
in both sub-samples is larger
than one and similar in size, although variances are too high to
yield significance. The split sample evidence is consistent with
the hypothesis that the surplus is sufficiently responsive to debt
to give the monetary authority control of the price level in both
sub-samples.31
4. Conclusion
A country entering the EMU surrenders its monetary policy and its debt becomes denominated in terms of a currency over which it has no direct control. A country's promise to uphold the limits in the Maastricht Treaty and the SGP is implicitly a promise not to allow its fiscal policy to threaten the ability of the ECB to control the price level. However, many countries have violated these limits. This leaves an open question regarding the role of fiscal policy in determining the price level in the EMU.
We assume that there is an upper bound on the present value of the primary surplus, motivated by an upper bound on distortionary taxes which a government can raise to service the debt. This implies an upper bound on debt. Fiscal policy is assumed to follow a fiscal rule with time-invariant parameters. For the ECB to have power to control the price level in the EMU, the fiscal rule must imply that debt is not expected to explode relative to its upper bound. We show that this requires that the primary surplus responds to an increase in real debt by at least enough to pay interest on the debt. We call such a policy "strongly passive" since the criteria are stronger than those requiring the expected present-value of debt to vanish in the limit, as with passive policy. We show that a strongly passive fiscal policy yields a model which is globally stable, such that initial deviations of the primary surplus from its target and from debt service are expected to vanish in the long run for any initial values. This gives the monetary authority the freedom to determine price in equilibrium.
This paper estimates a rule for the primary surplus to determine whether fiscal policy in EMU countries is strongly passive. Using panel cointegration and panel data techniques that allow for heterogeneity and for cross-sectional dependence across countries, we estimate the coefficients of the error correction model for the primary surplus in a panel of ten EMU countries over the period 1970-2006. The group mean estimate for the coefficient on lagged debt is consistent with the hypothesis that fiscal policy in EMU countries is strongly passive, allowing the monetary authority control over the price level. Even though debt in many countries has exceeded its Maastricht upper bound this should not imperil the ECB's goal of price stability.
References
Afonso, A. (2005), "Ricardian Fiscal Regimes in the European Union," European Central Bank Working Paper, No. 558.
Andrews, D.W.K. (1991), " Heteroskedasticity and Autocorrelation Consistent Covariance Matrix Estimation," Econometrica, 59, 817-858.
Annett, A. (2006), "Enforcement and the Stability and Growth Pact: How Fiscal Policy Did and Did Not Changed Under Europe's Fiscal Framework," IMF Working paper, No116
Barro, R. (1979), "On the Determination of Public Debt," Journal of Political Economy, 87, 940-971.
Bai, J. and S. Ng (2002), "Determining the Number of Factors in Approximate Factor Models," Econometrica, 70, 191-221.
Banerjee, A., M. Marcellino and C. Osbat (2004), "Some Cautions on the Use of Panel Methods for Integrated Series of Macroeconomic Data," Econometrics Journal, 7, 322-240.
Bohn, H. (1995), "The Sustainability of Budget Deficits in a Stochastic Economy," Journal of Money, Credit, and Banking, 27, 257-271.
Bohn, H. (1998), "The Behavior of U.S. Public Debt and Deficits," Quarterly Journal of Economics, 113, 949-963.
Bohn, H. (2007), "Are Stationarity and Cointegration Restrictions Really Necessary for Intertemoral Budget Constraints?", Journal of Monetary Economics 54, 1837-1847.
Bohn, H. (2008),"The Sustainability of Fiscal Policy in the United States," The Sustainability of Public Debt, eds. Reinhard Neck and Jan-Egbert Sturm, MIT Press, 15-49.
Breitung, J. (2000), "The Local Power of Some Unit Root Tests for Panel Data," in B. Baltagi (ed.), Nonstationary Panels, Panel Cointegration, and Dynamics Panels, Advances in Economics, Vol.15, JAI, Amsterdam.
Breitung, J. (2005), "A Parametric Approach to the Estimation of Cointegration Vectors in Panel Data," Econometrics Reviews, 151-174.
Breitung, J. and S. Das (2005), "Panel Unit Root Tests Under Cross Sectional Dependence," Statistica Neerlandica, 59, 414-433.
Canzoneri, M., R. Cumby, and B. Diba (2001), "Is the Price Level Determined by the Needs of Fiscal Solvency?" American Economic Review, 91(5), 1221-1238.
Choi, I. (2001), "Unit Root Tests for Panel Data," Journal of International Money and Finance, 20, 249-272.
Cochrane, J. (1998), "A Frictionless View of U.S. Inflation," in Ben Bernanke and Julio Rotemberg, eds., NBER Macroeconomics Annual (Cambridge, MA: MIT Press 1998) 323-384.
Daniel, B. (2001), "The Fiscal Theory of the Price Level in an Open Economy," Journal of Monetary Economics, 48,293-308.
Daniel, B. (2007), "Exchange Rate Crises and Fiscal Solvency, Manuscript, University at Albany.
Daniel, B. (2007), " The Fiscal Theory of the Price Level and Initial Government Debt," Review of Economic Dynamics 10, 193-206.
Daniel, B. and C. Shiamptanis (2008), "Fiscal Risk in a Monetary Union," Manuscript, University at Albany
Davig, T., E. M. Leeper and H. Chung (2007), "Monetary and Fiscal Policy Switching," Journal of Money, Credit & Banking, 39(4), 809-842.
Dickey, D. A. and W. A. Fuller (1979), "Distribution of the estimators for autoregressive time series with a unit root," Journal of the American Statistical Association, 74, 427-431.
Dupor, B. " Exchange Rates and the Fiscal Theory of the Price Level." Journal of Monetary Economics 45 (2000), 613-630.
Engle, R. F. and C. W. J. Granger (1987), "Co-integration and Error Correction: Representation Estimation, and Testing," Econometrica, 55, 251-276.
Gutierrez, L. (2003), "On the Power of Panel Cointegration Tests: A Monte Carlo Comparison," Economics Letters, 80 (1), 105-111.
Im, K.S., M.H. Perasan and Y. Shin (2003), "Testing for Unit Roots in Heterogeneous Panels," Journal of Econometrics, 115, 53-74.
Johansen, S. (1988), "Statistical Analysis of Cointegrated Vectors," Journal of Economic Dynamics and Control, 12, 231-254.
Johansen, S. (1995), "Likelihood-Based Inference in Cointegrated Vector Autoregressive Models," Oxford: Oxford University Press.
Hadri, K. (2000), "Testing for Stationarity in Heterogeneous Panel Data," Econometrics Journal, 3, 148-161.
Hsiao, C., M.H. Pesaran and A.K. Tahmiscioglu (1999), "Bayes Estimation of Short-Run Coefficients in Dynamic Panel Data Models," in Analysis of Panels and Limited Dependent Variables Models, by C. Hsiao, L.F. Lee, K. Lahiri and M.H. Pesaran, Cambridge: Cambridge University press, 268-296.
Larsson, R. and J. Lyhagen (1999), "Likelihood-Based Inference in Multivariate Panel Cointegration Models," Stockholm School of Economics Working Paper series in Economics and Finance, No. 331.
Larsson, R., J. Lyhagen and M. Lothgren (2001), "Likelihood-Based Cointegration Tests in Heterogeneous Panels," Econometrics Journal, 4, 109-142.
Levin, A., C. Lin and C.J. Chu (2002), "Unit Root Tests in Panel Data: Asymptotic and Finite-Sample Properties," Journal of Econometrics, 108, 1-24.
Maddala, G.S. and S. Wu (1999), "A Comparative Study of Unit Root Tests with Panel Data and a New Simple Test," Oxford Bulletin of Economics and Statistics, 61, 631-652.
Mendoza, Enrique G. and Jonathan D. Ostry (2006), "International Evidence on Fiscal Solvency: Is Fiscal Policy "Responsible?," IMF Working Paper, WP/07/56, March 2007
Moon, R. and B. Perron (2004), "Testing for Unit Root in Panels with Dynamic Factors," Journal of Econometrics, 122, 81-126.
Newey, W. and K. West (1994), "Autocovariance Lag Selection in Covariance Matrix Estimation," Review of Economic Studies, 61, 631-653.
O'Connell, P. (1998), "The Overvaluation of Purchasing Power Parity," Journal of International Economics, 44, 1-19.
Pedroni, P. (1999), "Critical Values for Cointegration Tests in Heterogeneous Panels with Multiple Regressors," Oxford Bulletin of Economics and Statistics, 61, 653-670.
Pedroni, P. (2000), "Fully Modified OLS for Heterogeneous Cointegrated Panels," in: Baltagi B (ed.), Nonstationary Panels, Panel Cointegration, and Dynamic Panels, Advances in Econometrics, Vol. 15, Amsterdam: JAI Press, 93-130.
Pedroni, P. (2001), "Purchasing Power Parity Tests in Cointegrated Panels," Review of Economics and Statistics, 83, 727-731.
Pedroni, P. (2004), "Panel Cointegration: Asymptotic and Finite Sample Properties of Pooled Time Series Tests With an Application to the PPP hypothesis," Econometric Theory, 20, 597-625.
Pesaran, M.H. (2006), "A Simple Panel Unit Root Test in the Presence of Cross Section Dependence," University of Cambridge Working Paper, No. 0346.
Pesaran, M.H. and R. Smith (1995), "Estimating Long-run Relationships from Dynamic Heterogeneous Panels," Journal of Econometrics, 68, 79-113.
Phillips, P.C.B. and P. Perron (1988), "Testing for a Unit Root in Time Series Regression," Biometrika, 75, 335-346
Shiamptanis, C. (2007), "Empirical Behavior of the Primary Government Surplus in a Panel of 10 EMU Countries," Dissertation Chapter, University at Albany
Sims, C. (1980), "Macroeconomics and Reality," Econometrica, 48, 1-48.
Sims, C (1997), "Fiscal Foundations of Price Stability in Open Economies," Working Paper, Yale University.
Swamy, P.A.V.B. (1970), "Efficient Inference in a Random Coefficient Regression Model," Econometrica, 38, 311-323.
Toda, H.Y. and P.C.B. Phillips (1993), "Vector Autoregressive and Causality," Econometrica, 61, 1367-1393.
B. Trehan, and C. Walsh (1991), "Testing Intertemporal Budget Constraints: Theory and Applications to U.S. Federal Budget and Current Account Deficies," Journal of Money, Credit, and Banking, 23, 210-223.
Urbain, J.P. (1992), "On Weak Exogeneity in Error Correction Models," Oxford Bulletin of Economics and Statistics, 54, 187-208.
Woodford, M. (1994), "Monetary Policy and Price Level Determinacy in a Cash-in-Advance Economy," Economic Theory, 43(3), 345-380.
Woodford, M. (1997), "Control of the Public Debt: A Requirement for Price Stability?" in The Debt Burden and Monetary Policy, edited by G. Calvo and M. King, London: Macmillan.
Appendix
A. Data Appendix
Nominal primary surplus, nominal GDP and GDP deflator are from the OECD database. The nominal debt is also from OECD database and for missing years data is obtained from the ECB's AMECO database. The sample consists of annual data from 1970-2006 for Austria, Belgium, Finland, France, Germany, Greece, Ireland, Italy, the Netherlands and Spain. For Luxembourg and Portugal there was not data available for a lot of years. For Germany we use the data for West Germany before unification and Germany after unification. The real values of the variables for each country are obtained by dividing the nominal values by the GDP deflator.
For the nominal primary surplus we use the general government primary balances (OECD Annex Table 29) and for nominal debt we use the general government gross financial liabilities (OECD Annex Table 33).
B. Panel Cointegration Statistics (Pedroni (1999))
1. Group mean
![]() (semi-parametric):
(semi-parametric):
 |
2. Group mean
![]() (parametric):
(parametric):
 |
where
 |
and where the residuals
![]() and
and
![]() are obtained from the
following regressions:
are obtained from the
following regressions:
 |
Table 1. Panel Unit Root Tests
| Test Statistic | |||
|---|---|---|---|
| -1.06 | 1.70 | 2.42 | |
| -1.24 | -0.30 | -0.95 | |
| -0.49 | -0.69 | 1.13 | |
| -0.40 | -0.79 | 0.64 | |
| -2.13 | -1.70 | -1.46 |
Note: ![]() is the group mean
is the group mean ![]() -statistic proposed by Im, Pesaran and Shin (2003),
-statistic proposed by Im, Pesaran and Shin (2003),
![]() is the OLS robust
is the OLS robust ![]() -statistic proposed by Breitung and Das (2005),
-statistic proposed by Breitung and Das (2005), ![]() and
and ![]() are the
are the ![]() -statistics based on the factor model proposed by Moon and
Perron (2004) and
-statistics based on the factor model proposed by Moon and
Perron (2004) and ![]() is the test proposed
by Pesaran (2006). They all test the null of a unit root against
the alternative of stationarity. All tests are computed using one
lag and they include individual specific constants and trends. The
test statistics with ** reject the null of a unit root at the 5
percent level. For the
is the test proposed
by Pesaran (2006). They all test the null of a unit root against
the alternative of stationarity. All tests are computed using one
lag and they include individual specific constants and trends. The
test statistics with ** reject the null of a unit root at the 5
percent level. For the ![]() ,
,
![]() ,
, ![]() and
and
![]() tests, the null is rejected if
tests, the null is rejected if
![]() and for the
and for the ![]() test, the null is rejected if
test, the null is rejected if
![]()
Table 2. Residual Based Panel Cointegration Tests
| Test Statistics | ||
|---|---|---|
| Group mean t (semi-parametric) | -4.22** | -4.54** |
| Group mean t (parametric) | -4.53** | -4.83** |
Note: See the Appendix for details. The statistics are distributed standard normal. They test the null hypothesis of no cointegration against the alternative of cointegration. All the tests include individual specific fixed effects and common time effects. The test statistics with ** reject the null hypothesis at the 5 percent level. The 5 percent critical value is -1.64.
Table 3. System Based Panel Cointegration Tests (![]() ,
,![]() ,
,![]() )
)
| q=0 | q=1 | q=2 | Cointegration relations | |
|---|---|---|---|---|
| Panel Test | 14.26** | 7.77** | 0.81 | 2 |
Note: The panel cointegration statistic tests the null
hypothesis that there are ![]() cointegrating
relationships against the alternative that there are 3
cointegrating relationships. The test includes individual specific
fixed effects. The test statistics with ** reject the null at 5
percent level. The panel test has a 5 percent critical value of
1.64. The moments used for the panel test are tabulated in
Shiamptanis (2007).
cointegrating
relationships against the alternative that there are 3
cointegrating relationships. The test includes individual specific
fixed effects. The test statistics with ** reject the null at 5
percent level. The panel test has a 5 percent critical value of
1.64. The moments used for the panel test are tabulated in
Shiamptanis (2007).
Table 4. Panel Estimates of the Cointegrating Parameters
| coefficients | 0.0422 | 0.0388 |
|---|---|---|
| t-statistic | 6.9321** | 5.1001** |
Note: ![]() and
and
![]() are the group mean panel FMOLS
estimates of real interest rate and target surplus. The estimates
are based on the Barlett kernel and the Newey-West bandwidth
selection procedure. They include individual specific effects. The
are the group mean panel FMOLS
estimates of real interest rate and target surplus. The estimates
are based on the Barlett kernel and the Newey-West bandwidth
selection procedure. They include individual specific effects. The
![]() -statistics with ** indicate statistical
significance at the 5 percent level. The 5 percent critical value
is 1.96.
-statistics with ** indicate statistical
significance at the 5 percent level. The 5 percent critical value
is 1.96.
Table 5. Panel Estimates of the Fiscal Parameters
| coefficients | 0.5118** | 1.3003** | 0.0578 | -0.1147** | 0.1975** |
|---|---|---|---|---|---|
| standard errors | (0.0717) | (0.0901) | (0.0708) | (0.0462) | (0.0706) |
Note:
![]() is the group mean panel
estimate for persistence and
is the group mean panel
estimate for persistence and
![]() is the group mean panel
estimate, which is statistically larger than one, that implies a
strongly passive fiscal policy.
is the group mean panel
estimate, which is statistically larger than one, that implies a
strongly passive fiscal policy.
![]() are the group mean panel
estimates for the coefficients on the lagged change in surplus, the
lagged change in debt and the lagged change in output. The **
indicate statistical significance at the 5 percent level.
are the group mean panel
estimates for the coefficients on the lagged change in surplus, the
lagged change in debt and the lagged change in output. The **
indicate statistical significance at the 5 percent level.
Table 6. Panel Estimates of the Fiscal Parameters Before and After Maastricht Treaty
| Pre-Maastricht | 0.6569** (0.1072) | 1.3032 (1.4927) | 0.0770 (0.0999) | -0.1458** (0.0455) | 0.1249** (0.0682) |
|---|---|---|---|---|---|
| Post-Maastricht | 0.6887** (0.1316) | 1.3439 (1.5787) | 0.0967 (0.0846) | -0.0545 (0.0719) | 0.3194** (0.1315) |
Note: The ** indicate statistical significance at the 5 percent level.
Footnotes
1. The authors would like to thank Peter Pedroni for numerous consultations on empirical techniques and Dale Henderson and John Jones for helpful discussions. The views in this paper are solely the responsibility of the author and should not be interpreted as reflecting the views of The Board of Governors of the Federal Reserve or of any other person associated with the Federal Reserve System. Return to text
2. Davig, Leeper, and Chung (2007) assume two fiscal rules with constant parameters and allow stochastic switching over time between them. For their inferences, it is important that on average their fiscal rule yields active fiscal policy. Return to text
3. As Leeper (1991) demonstrated, there is no equilibrium if both monetary and fiscal policy are active. Therefore, if fiscal policy is active, there is pressure on the monetary authority to become passive and vice versa. Return to text
4. In the absence of an upper bound, the intertemporal budget constraint is satisfied with debt growing forever more slowly than its upper bound. However, such an equilibrium does not imply cointegration as debt and output are growing at different rates. Return to text
5. Daniel (2007) demonstrates that monetary policy retains control of expected inflation even under passive monetary policy and active fiscal policy, as in the FTPL. Return to text
6. Commitment to a rule allows the government to avoid dynamic inconsistency problems. Return to text
7. Barro's analysis excludes the upper bound on taxes, and therefore the upper bounds on government surpluses and debt. Return to text
8. Sims (1997), Woodford (1997), and Daniel (2001) argue no country in a monetary union will choose to take the role of permanently raising taxes on its own agents to accumulate the exploding debt of another. Return to text
9. Models with output are usually
expressed in logarithms to allow exponential growth in output.
However, modeling the surplus and debt with logarithms does not
make sense since both the surplus and debt can be negative numbers.
In the short time period of the analysis, the difference between
exponential growth and linear growth as well as the possible
increase in the variance for ![]() appear
small. Bohn (2008) also argues that taking logs magnifies a series'
fluctuations for values near zero. Return
to text
appear
small. Bohn (2008) also argues that taking logs magnifies a series'
fluctuations for values near zero. Return
to text
10. In the absence of upper bounds, cointegration is not a necessary characteristic of equilibrium because debt and the surplus can grow forever relative to output. With upper bounds cointegration could occur as the price level and real debt adjust to the surplus instead of as the surplus adjusts to real debt. Return to text
11. The group mean estimate of ![]() is 0.35. Return to
text
is 0.35. Return to
text
12. We allow ![]() to be
autocorrelated in the empirical estimation and consider at that
point how the requirements for global stability are
modified. Return to text
to be
autocorrelated in the empirical estimation and consider at that
point how the requirements for global stability are
modified. Return to text
13. See Woodford (1997) and Daniel (2001, 2007). Return to text
14. This is under the assumption that
roots are real and that
![]() , which is
empirically verified. Return to
text
, which is
empirically verified. Return to
text
15. Bohn (2008) shows that either is correct, provided the correct discount factor is used. The present value of debt, discounted at the real interest rate, and the present value of debt relative to output, discounted at the growth adjusted real interest rate, must approach zero. Return to text
16. Who will work when taxes become 100% of income? Return to text
17. The countries were chosen based on data availability. They include Austria, Belgium, Finland, France, Germany, Greece, Ireland, Italy, the Netherlands and Spain. For more details see the Data Appendix. Return to text
18. We also fail to reject the null of a unit root when we use Breitung (2000), Maddala and Wu (1999), Choi (2001) tests, and we reject the null of no unit root when we use Hadri (2000) test. Additionally, we confirm the unit root behavior of the series using panel unit root tests suggested by Breitung and Das (2005), Moon and Perron (2004) and Pesaran (2006), which account for various forms of cross-sectional dependence. The tests are computed using one lag and two lags. For Moon and Perron's (2004) procedure we use one unobserved factor. All tests include an individual specific constant and trend. Return to text
19. The group mean statistics allow
modeling an additional source of potential heterogeneity across
individual members of the panel. Moreover, Gutierrez (2003) finds
that Pedroni's tests have higher power than the system test
proposed by Larsson, Lyhagen and Lothgren (2001). Additionally,
Banarjee, Marcellino and Osbat (2004) show that for small
![]() the size distortions of Pedroni's tests
are lower than those of Larsson and Lyhagen (1999)
test. Return to text
the size distortions of Pedroni's tests
are lower than those of Larsson and Lyhagen (1999)
test. Return to text
20. The specifications are given in the Appendix. Return to text
21. Common time effects allow us to model
a limited form of cross-sectional dependence and cross-member
cointegration (which is a form of long run cross-sectional
dependence). Common time effects assume that the cross-sectional
dependence correlation between country ![]() and
and
![]() is identical for all
is identical for all ![]() . Thus, in the presence of heterogeneous cross-sectional
dependence, subtracting off the cross-sectional average does not
completely eliminate cross-sectional dependence. The method by
which cross-sectional dependence is modeled in panels is still an
active area of research. Bai and Ng (2002) and Moon and Perron
(2004) consider models in which the error terms have a factor
structure in panel unit root tests, however the implications for
such factor models have not been studied in the panel cointegration
context. Notice though that time effects are a special case of a
factor model where there is a single common factor and the response
of each country is similar. Therefore, time effects account for
both cross-sectional dependence and cross-member cointegration when
the source of dependency is due to a single common time specific
shock. Return to text
. Thus, in the presence of heterogeneous cross-sectional
dependence, subtracting off the cross-sectional average does not
completely eliminate cross-sectional dependence. The method by
which cross-sectional dependence is modeled in panels is still an
active area of research. Bai and Ng (2002) and Moon and Perron
(2004) consider models in which the error terms have a factor
structure in panel unit root tests, however the implications for
such factor models have not been studied in the panel cointegration
context. Notice though that time effects are a special case of a
factor model where there is a single common factor and the response
of each country is similar. Therefore, time effects account for
both cross-sectional dependence and cross-member cointegration when
the source of dependency is due to a single common time specific
shock. Return to text
22. We also reject the null of no cointegration at the 5 percent level when we use all seven panel statistics of Pedroni (1999, 2004). Additionally, we reject the null of no cointegration at the 5 percent level when we do not use the common time effects. Return to text
23. Bohn (2008) considers a similar
equation with ![]() given by debt, using over two
centuries of US data on the primary surplus, output, and debt. His
real data series have severe heteroskedasticiy, due to two
centuries of growth in real GDP. He reduces, but does not
eliminate, these problems by dividing by real GDP. Standard
deviations for real variables are 64 to 98 times as high in the
second period as in the first. For variables expressed as a
fraction of GDP, this number falls to something a little larger
than 2. We have a very different data set from Bohn's - a
relatively short time dimension and ten countries. The shorter time
dimension implies that we do not have Bohn's heteroskedasticity
problem. Ratios of standard deviations in the second half of the
sample relative to the first half average to something less than 2,
similar to his adjusted data. Also, division by GDP would eliminate
the unit root characteristics of the data which we exploit to
obtain super-consistent estimates of the cointegrating
parameters. Return to text
given by debt, using over two
centuries of US data on the primary surplus, output, and debt. His
real data series have severe heteroskedasticiy, due to two
centuries of growth in real GDP. He reduces, but does not
eliminate, these problems by dividing by real GDP. Standard
deviations for real variables are 64 to 98 times as high in the
second period as in the first. For variables expressed as a
fraction of GDP, this number falls to something a little larger
than 2. We have a very different data set from Bohn's - a
relatively short time dimension and ten countries. The shorter time
dimension implies that we do not have Bohn's heteroskedasticity
problem. Ratios of standard deviations in the second half of the
sample relative to the first half average to something less than 2,
similar to his adjusted data. Also, division by GDP would eliminate
the unit root characteristics of the data which we exploit to
obtain super-consistent estimates of the cointegrating
parameters. Return to text
24. Since FMOLS is designed to reduce bias
associated with short-run dynamics and the estimates in the I
![]() model are super-consistent,
it is not necessary to add stationary variables, like HP-filtered
measures of the data, as in Bohn's model with stationary data
(2008) . Return to text
model are super-consistent,
it is not necessary to add stationary variables, like HP-filtered
measures of the data, as in Bohn's model with stationary data
(2008) . Return to text
25. The FMOLS results are robust to the choice of kernel and bandwidth. We obtain almost identical estimates when we use the Parzen and quadratic spectral (QS) kernels and the Andrews (1991) bandwidth selection procedure. Additionally, we obtain similar estimates when we use the group mean dynamic OLS (DOLS) procedure of Pedroni (2004) and the two-step estimator of Breitung (2005). Return to text
26. The additional dynamics modify
slightly the conditions under which
![]() is sufficient to assure
global stability, that is for all roots to be within the unit
circle. For
is sufficient to assure
global stability, that is for all roots to be within the unit
circle. For
![]() as is verified empirically, we
need
as is verified empirically, we
need
![]() which also holds empirically. Return to
text
which also holds empirically. Return to
text
27. Using long US samples of one and two centuries that highlight the role of wars, Bohn (1998, 2008) expresses the fiscal rule in terms of the surplus and debt as a fraction of output, and finds it necessary to add HP-filter measures of transitory values of the variables to distinguish between the response of the surplus to permanent and transitory shocks and reduce "omitted variables bias." Transitory, but persistent government spending, as associated with a war, would be accompanied by rising debt implying that the residual would be low when debt is high relative to the surplus. The error correction model deals with this by adding lagged changes of the model variables. In this example the lagged change in debt would be high in a war and would play the role of Bohn's transitory military spending, and the lagged change in output would play the role of Bohn's HP-filtered output. Return to text
28. They show that when the parameters of interest are heterogeneous, the group mean procedure provides consistent estimates, whereas the pool panel procedures give inconsistent estimates. Return to text
29. See Engle and Granger (1987), Toda and Phillips (1993) and Urbain (1992) for the properties of estimators in cointegrated systems. Return to text
30. We obtain almost identical estimates when we use the hierarchical Bayes estimator of Hsiao, Pesaran and Tahmiscioglu (1999) and the weighted estimator of Swamy (1980) (also referred as the empirical Bayes estimator). Return to text
31. Afonso (2005) and Annett (2006), who use a similar EMU data set and other empirical techniques, do not find evidence for a change in the fiscal policy after the signing of the Maastricht Treaty. Return to text
This version is optimized for use by screen readers. Descriptions for all mathematical expressions are provided in LaTex format. A printable pdf version is available. Return to text