Senior Credit Officer Opinion Survey on Dealer Financing Terms
Senior Credit Officer Opinion Survey, June 2022
Current Release RSS DDP
Summary
The June 2022 Senior Credit Officer Opinion Survey on Dealer Financing Terms (SCOOS) collected qualitative information on changes in credit terms and conditions in securities financing and over-the-counter (OTC) derivatives markets. In addition to the core questions, the survey included a set of special questions about dealers’ assessments of changes in liquidity conditions in the U.S. Treasury and agency residential mortgage-backed security (RMBS) markets since the beginning of January 2022. The 23 institutions participating in the survey account for almost all dealer financing of dollar-denominated securities to non-dealers and are the most active intermediaries in OTC derivatives markets. The survey was conducted between May 10, 2022, and May 23, 2022. The core questions asked about changes between mid-February 2022 and mid-May 2022.1
Core Questions
(Questions 1-79)2
With regard to the credit terms applicable to, and mark and collateral disputes with, different counterparty types across the entire range of securities financing and OTC derivatives transactions, responses to the core questions revealed the following:
- On net, one-fifth of dealers reported that price terms on securities financing transactions and OTC derivatives offered to hedge funds tightened somewhat, while small net fractions of respondents pointed to somewhat tighter terms offered to nonfinancial corporations, trading real estate investment trusts, and separately managed accounts (see the exhibit "Management of Concentrated Credit Exposures and Indicators of Supply of Credit").
- For hedge funds and nonfinancial corporations, small net fractions of dealers reported that nonprice terms on securities financing transactions and OTC derivatives, such as haircuts, maximum maturity, or covenants, tightened somewhat since the previous survey.
- A small fraction of respondents indicated that resources and attention devoted to managing concentrated credit exposure to central counterparties increased somewhat. However, most respondents indicated that changes in central counterparty practices have not affected, or have minimally affected, the credit terms they offer to clients on bilateral transactions that are not cleared.
- Approximately one-fifth of dealers, on net, reported that the volume of mark and collateral disputes increased for separately managed accounts, while small net fractions of respondents noted an increase for most other counterparty types. In addition, a small net fraction of dealers reported an increase in the duration and persistence of mark and collateral disputes for dealers and hedge funds.
With respect to clients' use of financial leverage, respondents indicated the following:
- Approximately one-fourth of dealers indicated a decrease in the use of leverage by hedge funds, while all respondents noted that the use of leverage by other client types was basically unchanged (see the exhibit "Use of Financial Leverage").
With regard to OTC derivatives markets, responses to the core questions revealed the following:
- Initial margin requirements were largely unchanged for most types of OTC derivatives, although with respect to interest rate derivatives, one-fifth of dealers reported that initial margin requirements increased somewhat for both average and most-favored clients.
- Approximately one-fourth of dealers, on net, reported an increase in the volume of mark and collateral disputes over the past three months for commodity derivatives, while one-fifth of respondents reported an increase for foreign exchange derivatives and credit derivatives referencing corporates. Meanwhile, the duration and persistence of mark and collateral disputes remained largely unchanged for all types of contracts.
With respect to securities financing transactions, respondents indicated the following:
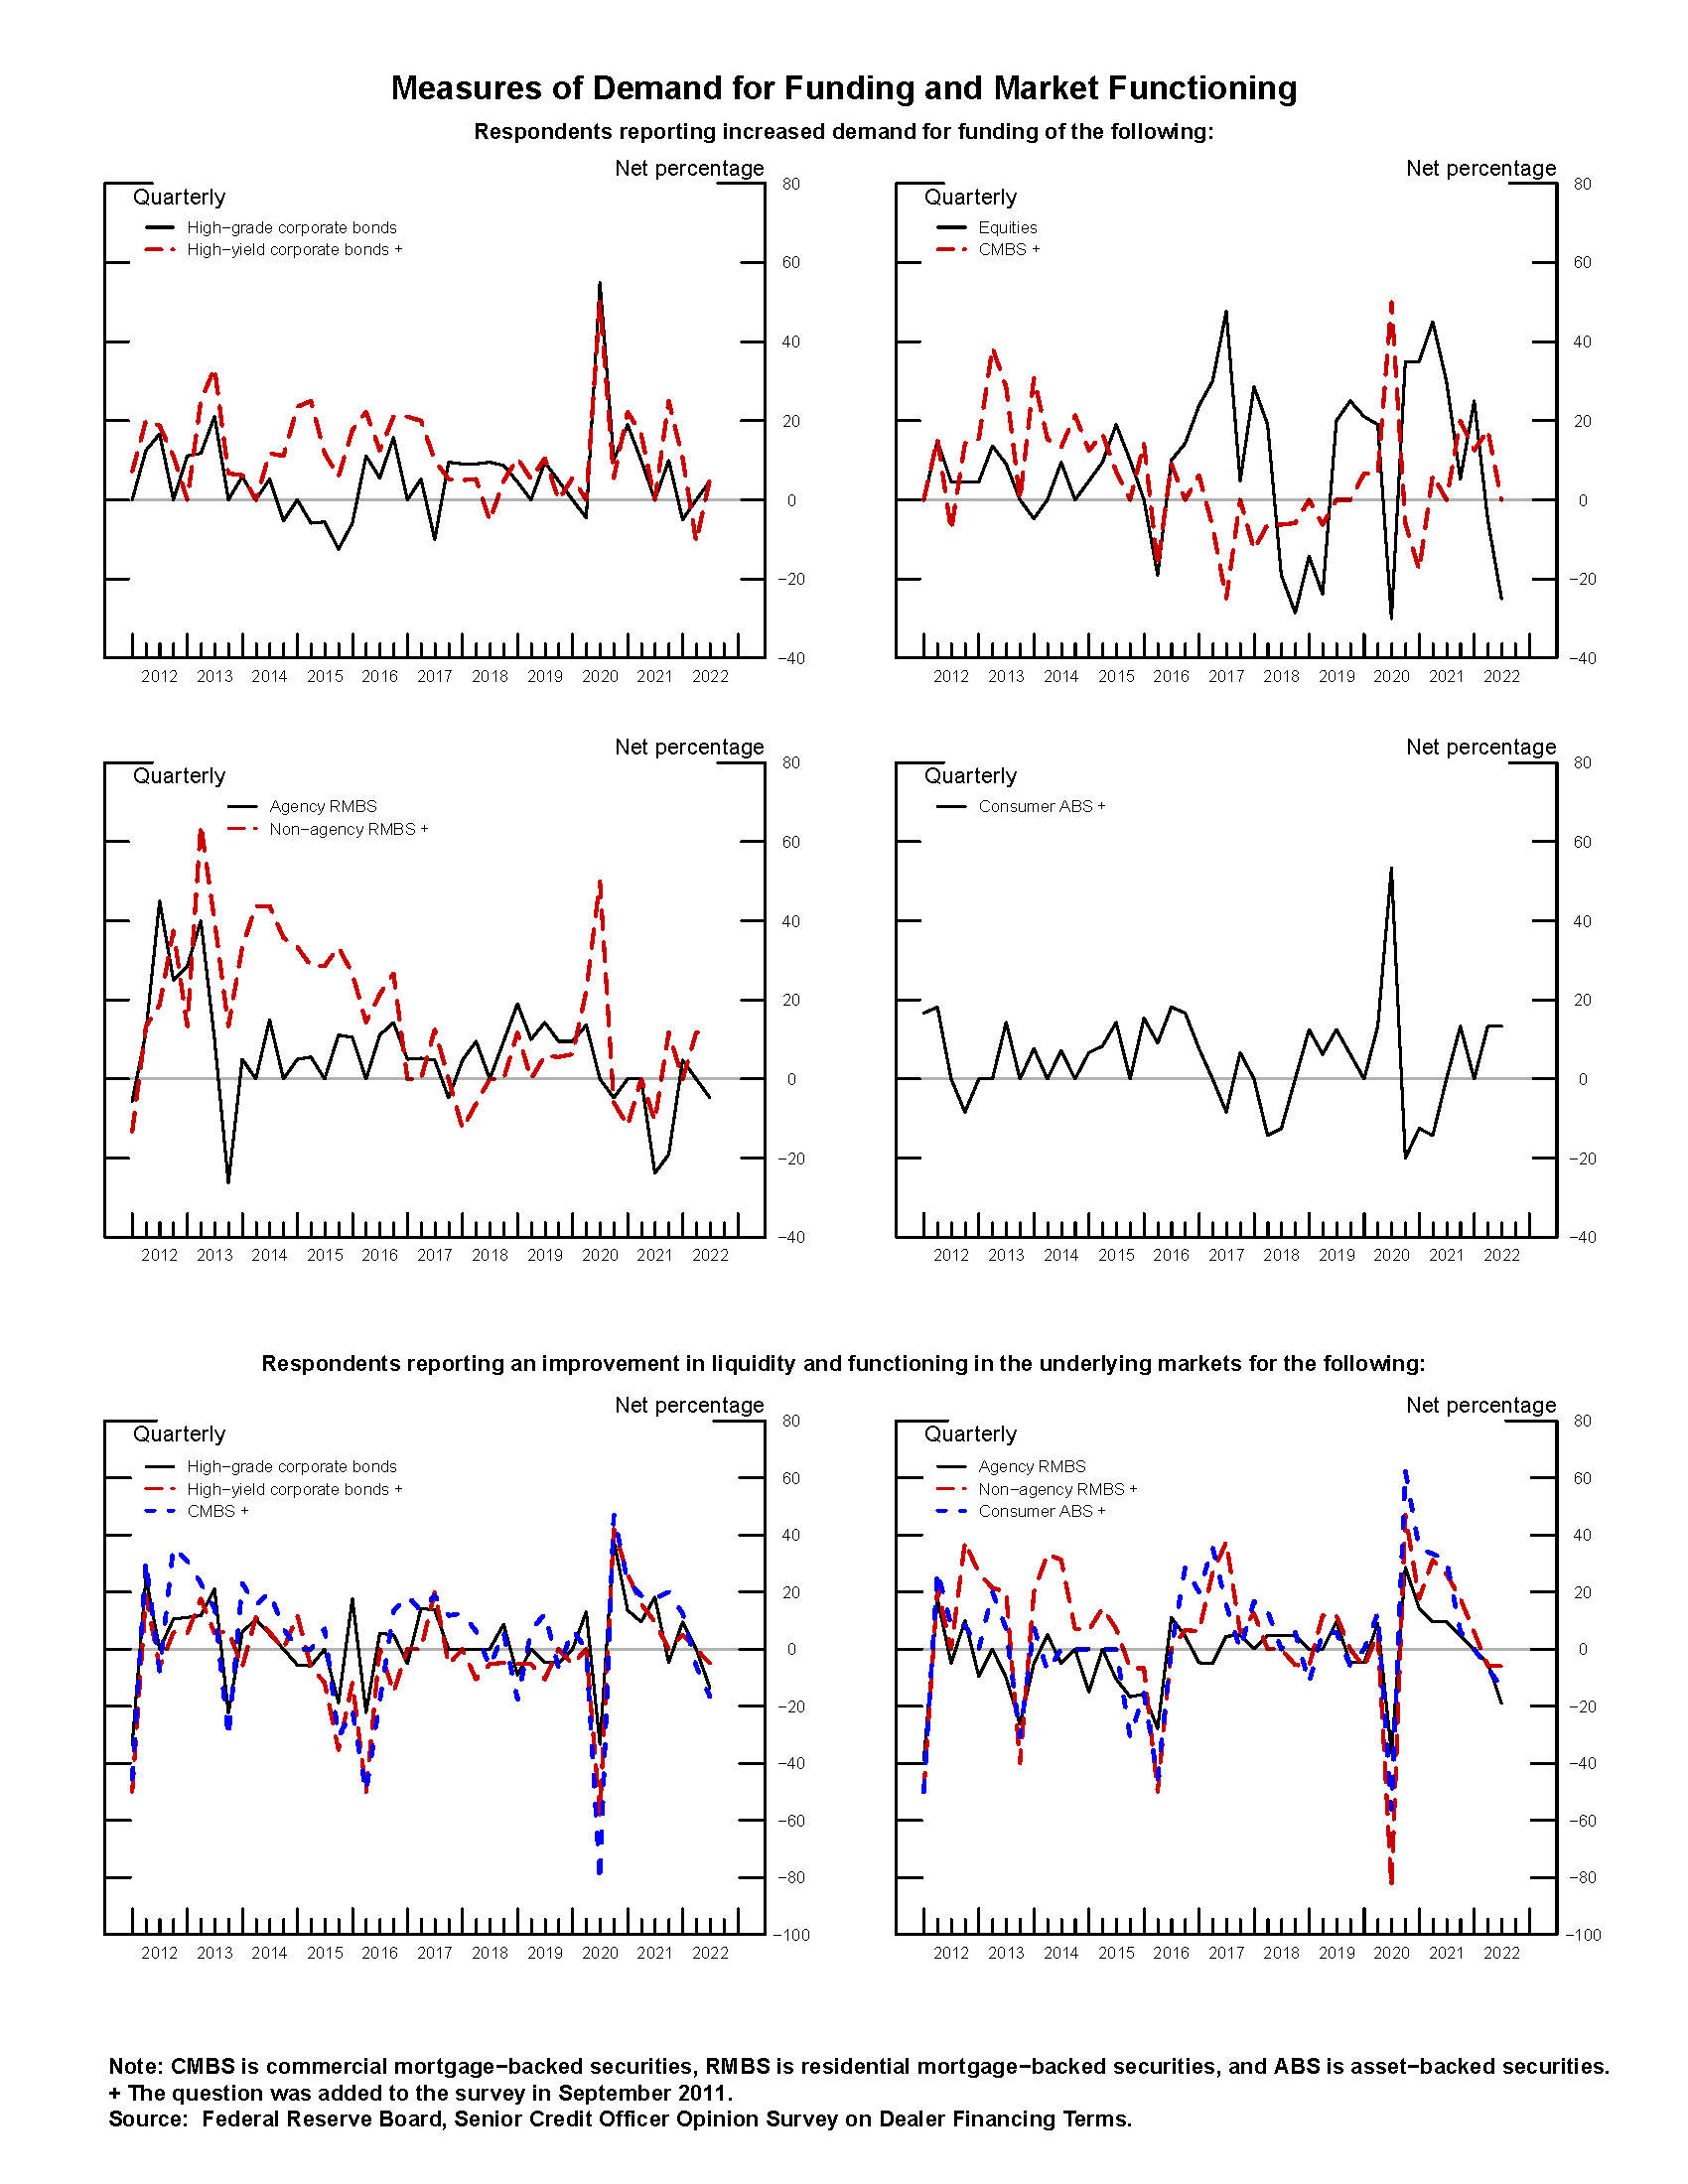
- For high-grade corporate bonds, small net fractions of dealers reported tightening of funding terms with respect to the maximum amount of funding, haircuts, and collateral spreads for average clients, and tightening of terms with respect to collateral spreads for most-favored clients. For high-yield corporate bonds, over one-fifth of respondents, on net, indicated tightening of funding terms with respect to collateral spreads for average and most-favored clients, and a small net fraction of dealers reported tighter terms with respect to haircuts for average clients. For all other asset classes, terms under which various types of securities are funded remained largely unchanged.
- On net, one-fourth of dealers reported decreased demand for funding equities. Demand for funding of other asset classes was largely unchanged (see the exhibit "Measures of Demand for Funding and Market Functioning").
- Small net fractions of dealers indicated that liquidity and market functioning for high-grade corporate bond, agency RMBS, and commercial mortgage-backed securities markets deteriorated over the past three months.
- The volume and duration of mark and collateral disputes remained largely unchanged across collateral types. A small net fraction of dealers reported that the volume of mark and collateral disputes related to lending against equities increased somewhat over the past three months.
Special Questions on Liquidity Conditions in the U.S. Treasury and Agency Residential Mortgage-Backed Securities Markets
(Questions 81-91)
In the special questions, dealers were asked about their assessment of changes in liquidity conditions in the U.S. Treasury and agency RMBS markets since the beginning of January 2022. In these questions, market liquidity referred to the ease of buying and selling desired quantities of an asset without significant costs or delays.
With respect to liquidity conditions in the market for on- and off-the-run U.S. Treasury securities, dealers reported the following:
- All dealers indicated that liquidity in the market for on-the-run U.S. Treasury securities has deteriorated since last January, with over one-third of respondents reporting a substantial deterioration in liquidity conditions.
- In the on-the-run market, dealers most frequently cited a decrease in the depth of the limit order book as the main indicator used in making their assessment. Price impact was most often cited by dealers as the next most important indicator, followed by bid-ask spreads.
- Over four-fifths of respondents pointed to increased interest rate volatility as a very important reason for the deterioration of liquidity conditions. In addition, more than one-half of dealers cited more unbalanced client order flows, diminished availability of dealer balance sheets, reduced willingness of dealers to take risk in U.S. Treasury markets, reduced willingness of PTFs to provide liquidity, and elevated Treasury issuance net of System Open Market Account (SOMA) purchases as somewhat important reasons supporting their liquidity assessments.
- With respect to the market for off-the-run U.S. Treasury securities, over three-fourths of dealers indicated that liquidity conditions have deteriorated since January 2022. Approximately one-half of these respondents indicated that liquidity conditions deteriorated substantially over the period.
- In the off-the-run market, dealers indicated that price impact was the most important indicator used in making their assessment of a deterioration in liquidity conditions, closely followed by bid-ask spreads.
- Roughly four-fifths of dealers noting a deterioration in off-the-run U.S. Treasury liquidity cited increased interest rate volatility as a very important reason leading to the deterioration, while approximately one-half of respondents also pointed to more unbalanced client order flows as a very important contributing factor. In addition, between roughly one-third and two-fifths of dealers cited diminished availability of dealer balance sheets and reduced willingness of dealers to take risk in U.S. Treasury markets as important reasons supporting their liquidity assessments.
- Dealers were also asked about the main risks to Treasury market liquidity over the remainder of 2022. Elevated interest rate volatility and the Federal Reserve’s balance sheet reductions were most often cited as the main risks ahead, followed by reduced willingness of dealers to intermediate the U.S. Treasury markets.
With respect to liquidity conditions in agency RMBS markets, dealers reported the following:
- Approximately three-fifths of dealers reported a deterioration in liquidity in the to-be-announced (TBA) market for agency RMBS since last January, while the remaining fraction of respondents indicated that liquidity in this market remained basically unchanged.
- In the TBA agency RMBS market, roughly one-half of dealers noting a deterioration of liquidity conditions reported that price impact was the most important indicator used in making their assessment, while bid-ask spreads was cited as the next most important indicator.
- Nearly all respondents noting a deterioration in liquidity conditions cited increased interest rate volatility as a very important reason leading to the deterioration, while roughly two-fifths of those reporting a deterioration also pointed to more unbalanced client order flows as a very important reason. Respondents also cited reduced willingness of dealers to take risk in RMBS markets, elevated RMBS issuance net of SOMA purchases, and diminished availability of dealer balance sheets as somewhat important contributing factors.
- Similar to Treasury markets, elevated interest rate volatility was most often cited as the main risk to agency RMBS market liquidity over the remainder of 2022. The Federal Reserve’s balance sheet reductions and deterioration in financing conditions were cited as the next most important risks.
This document was prepared by Ayelén Banegas, Division of Monetary Affairs, Board of Governors of the Federal Reserve System. Assistance in developing and administering the survey was provided by staff members in the Capital Markets Function, the Statistics Function, and the Markets Group at the Federal Reserve Bank of New York.
1. For questions that ask about credit terms, net percentages equal the percentage of institutions that reported tightening terms ("tightened considerably" or "tightened somewhat") minus the percentage of institutions that reported easing terms ("eased considerably" or "eased somewhat"). For questions that ask about demand, net fractions equal the percentage of institutions that reported increased demand ("increased considerably" or "increased somewhat") minus the percentage of institutions that reported decreased demand ("decreased considerably" or "decreased somewhat"). Return to text
2. Question 80, not discussed here, was optional and allowed respondents to provide additional comments. Return to text
Exhibit 1: Management of Concentrated Credit Exposures and Indicators of Supply of Credit
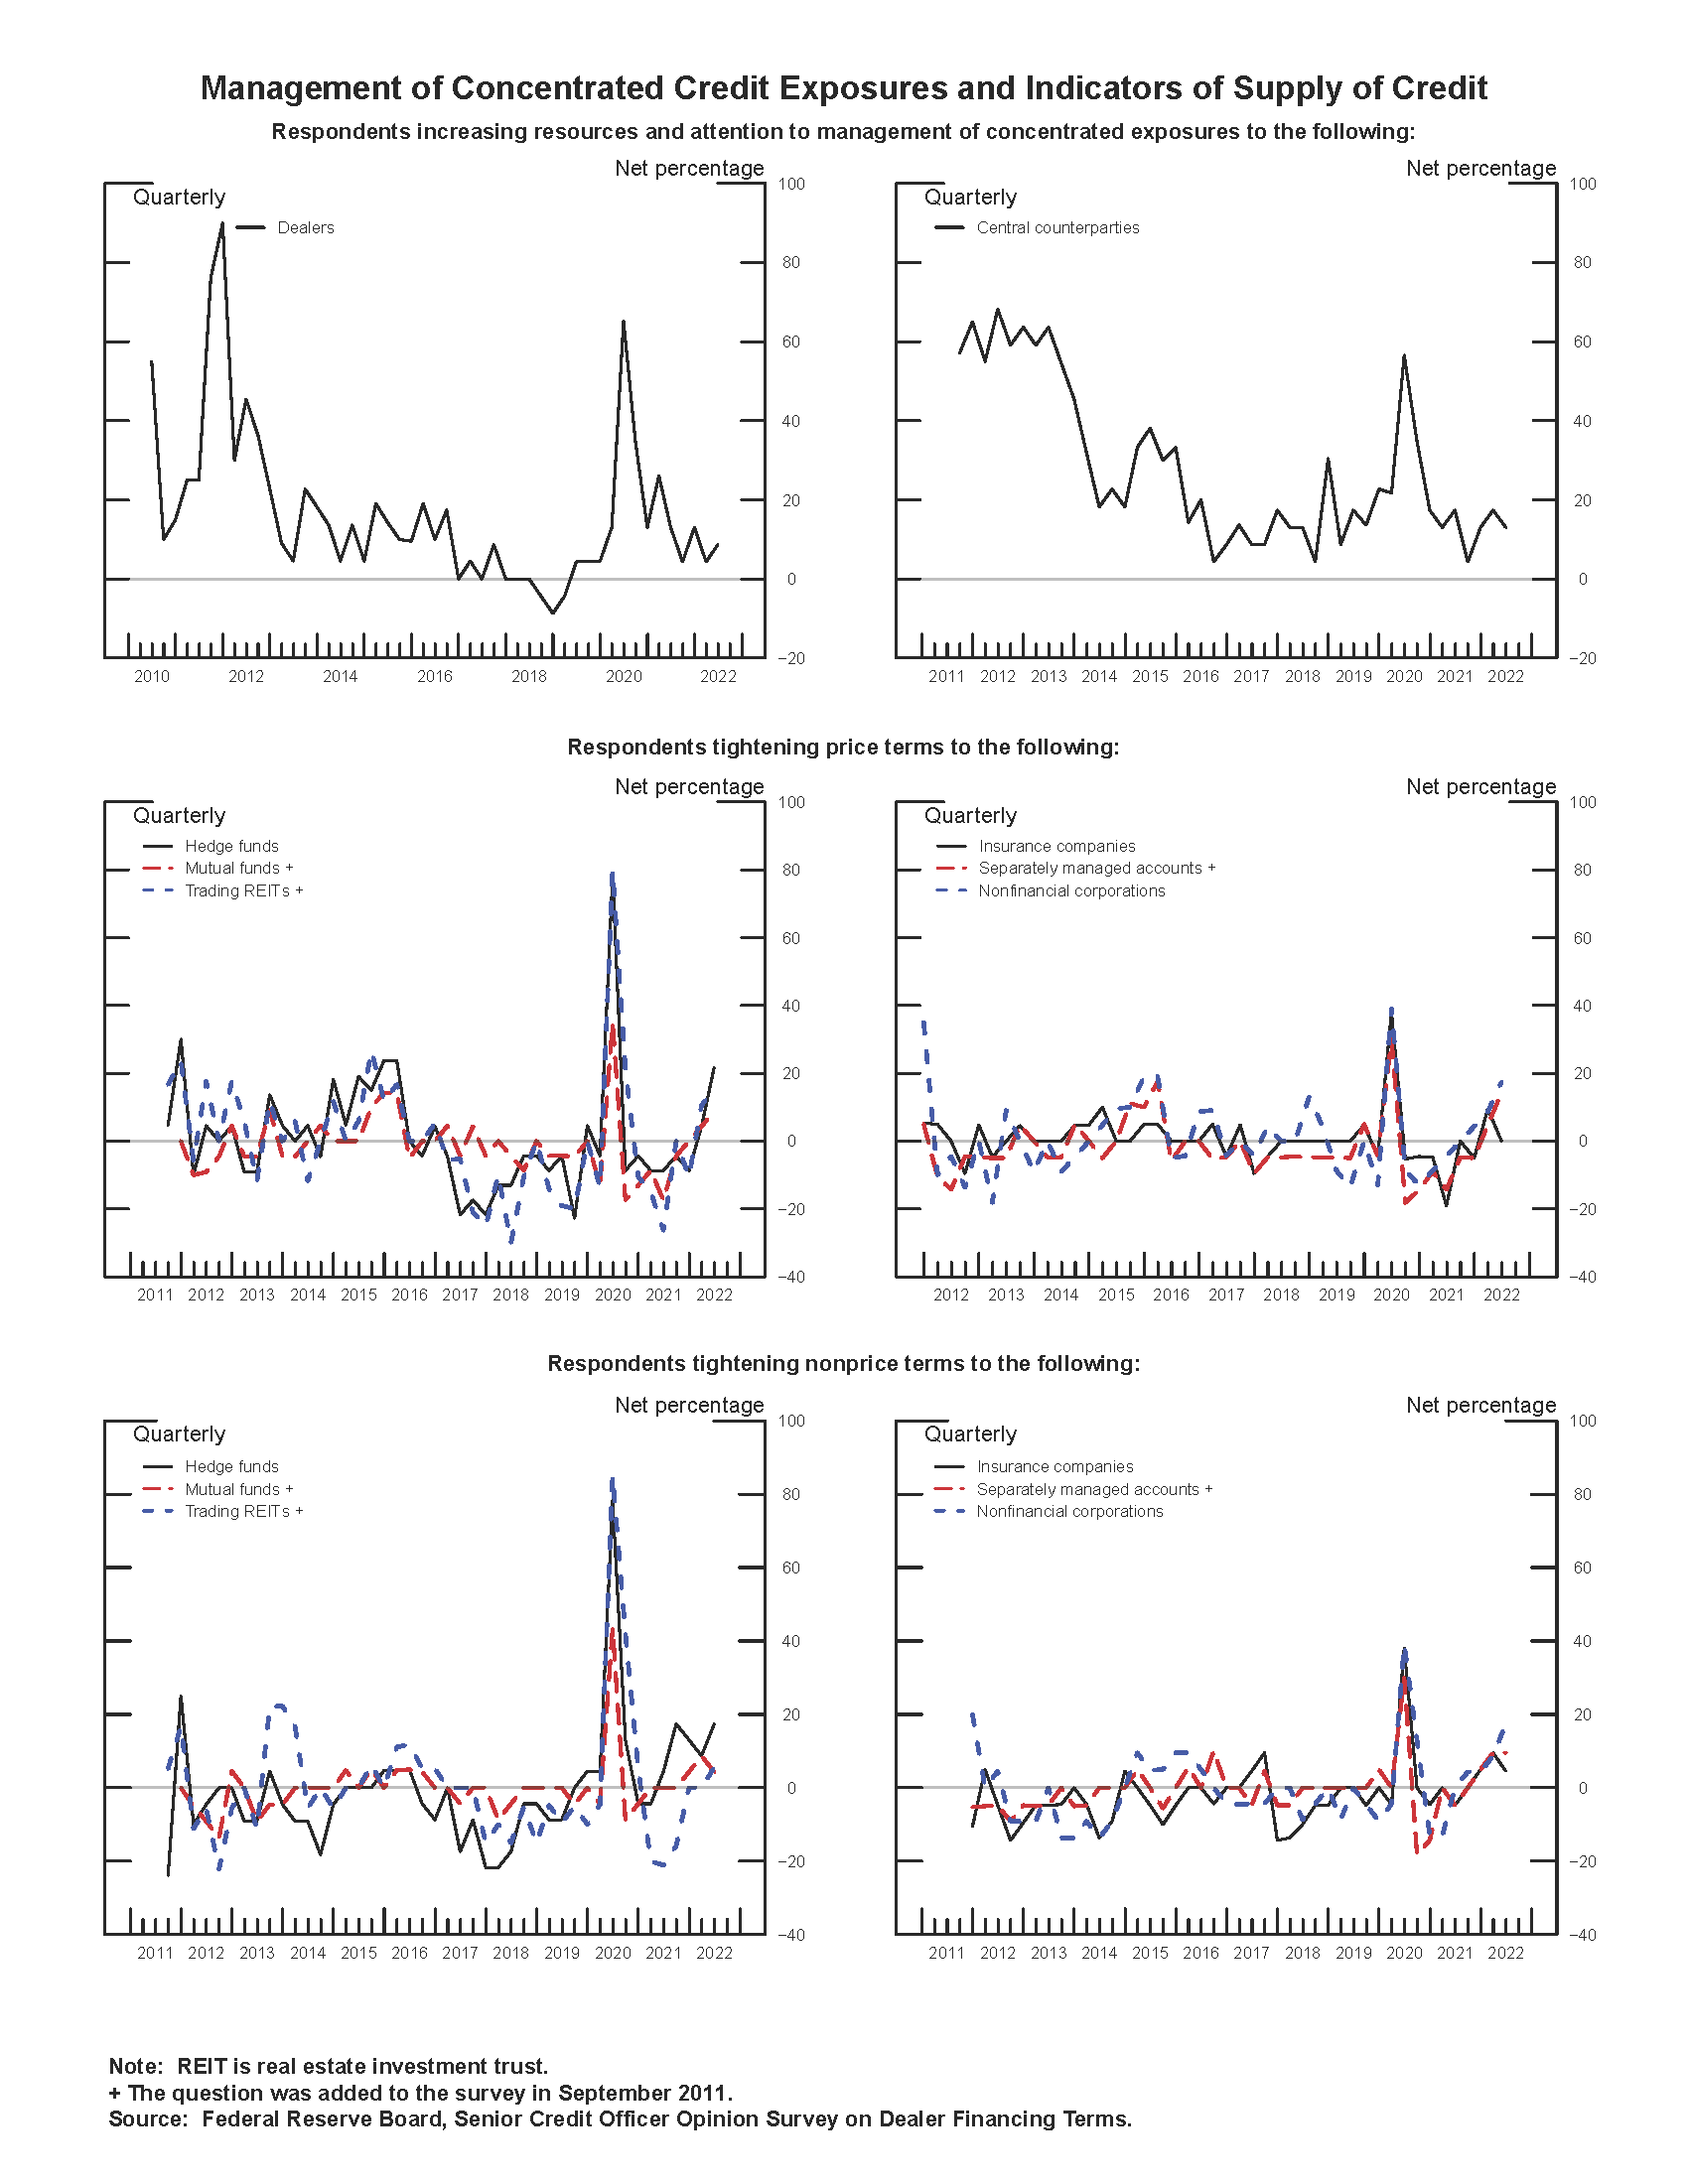
Exhibit 2: Use of Financial Leverage
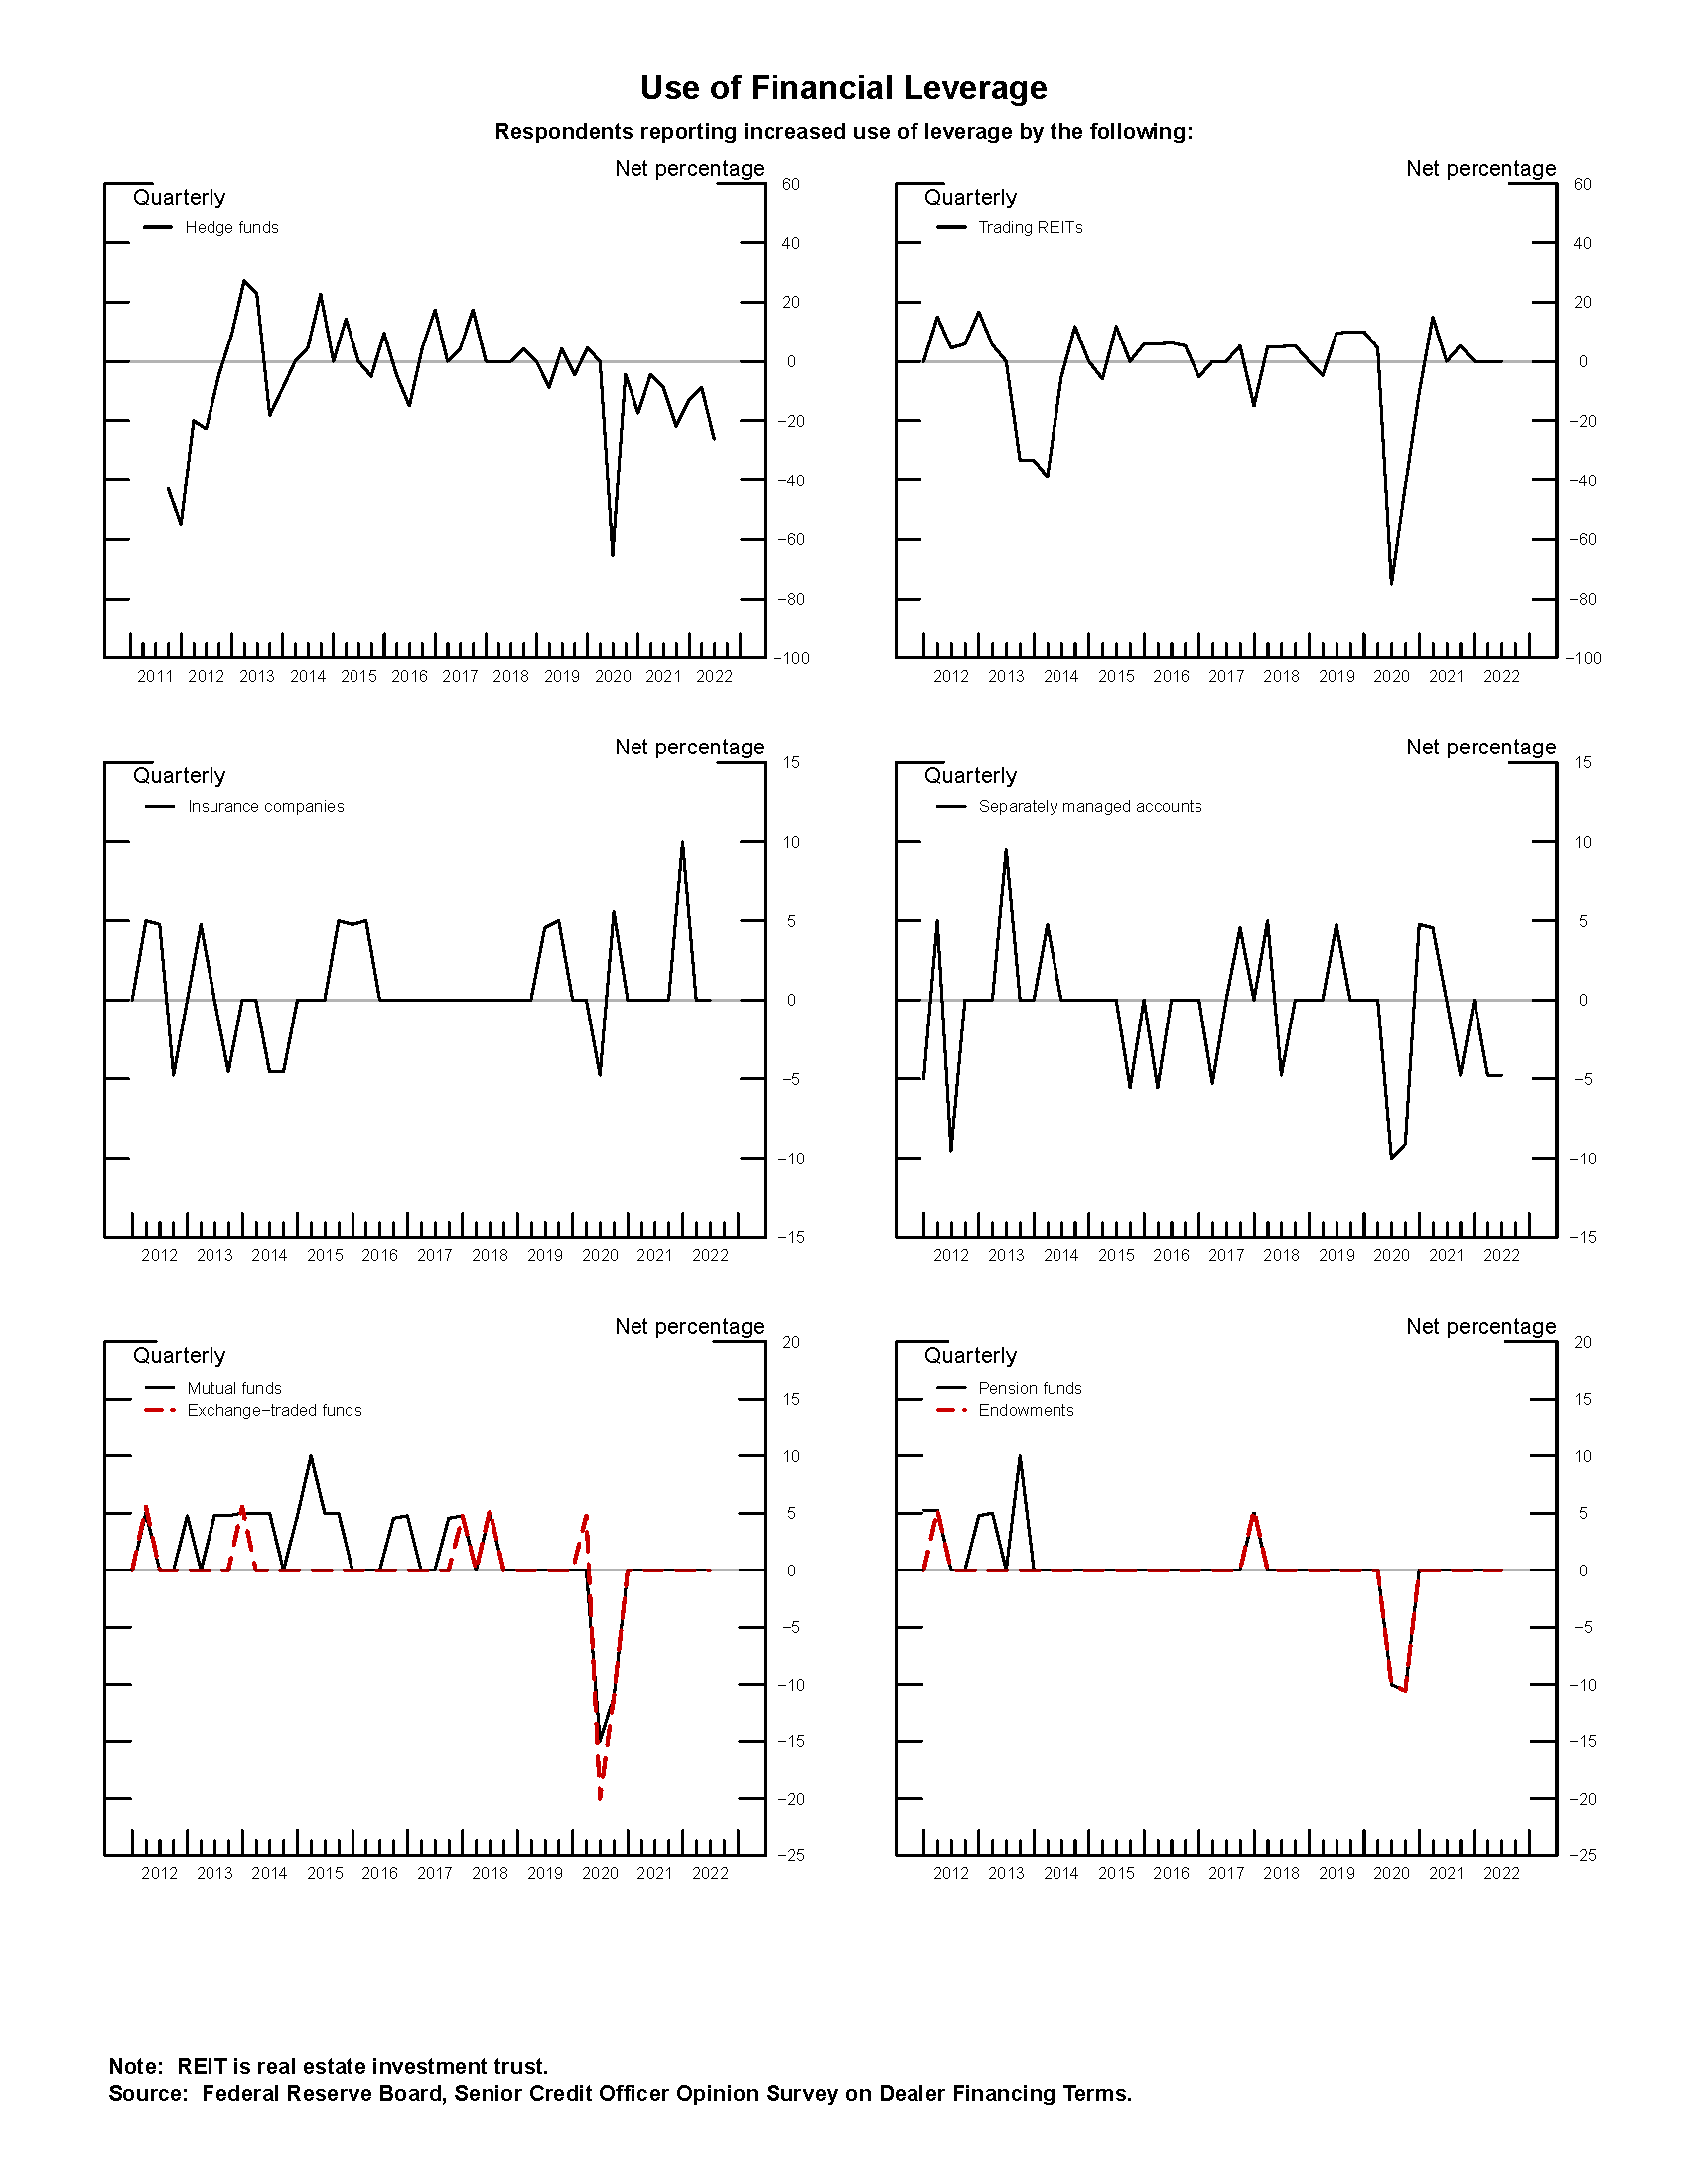
Exhibit 3: Measures of Demand for Funding and Market Functioning
Results of the June 2022 Senior Credit Officer Opinion Survey on Dealer Financing Terms
The following results include the original instructions provided to the survey respondents. Please note that percentages are based on the number of financial institutions that gave responses other than "Not applicable." Components may not add to totals due to rounding.
Counterparty Types
Questions 1 through 40 ask about credit terms applicable to, and mark and collateral disputes with, different counterparty types, considering the entire range of securities financing and over-the-counter (OTC) derivatives transactions. Question 1 focuses on dealers and other financial intermediaries as counterparties; questions 2 and 3 on central counterparties and other financial utilities; questions 4 through 10 focus on hedge funds; questions 11 through 16 on trading real estate investment trusts (REITs); questions 17 through 22 on mutual funds, exchange-traded funds (ETFs), pension plans, and endowments; questions 23 through 28 on insurance companies; questions 29 through 34 on separately managed accounts established with investment advisers; and questions 35 through 38 on nonfinancial corporations. Questions 39 and 40 ask about mark and collateral disputes for each of the aforementioned counterparty types.
In some questions, the survey differentiates between the compensation demanded for bearing credit risk (price terms) and the contractual provisions used to mitigate exposures (nonprice terms). If your institution’s terms have tightened or eased over the past three months, please so report them regardless of how they stand relative to longer-term norms. Please focus your response on dollar-denominated instruments; if material differences exist with respect to instruments denominated in other currencies, please explain in the appropriate comment space. Where material differences exist across different business areas--for example, between traditional prime brokerage and OTC derivatives--please answer with regard to the business area generating the most exposure and explain in the appropriate comment space.
Dealers and Other Financial Intermediaries
1. Over the past three months, how has the amount of resources and attention your firm devotes to management of concentrated credit exposure to dealers and other financial intermediaries (such as large banking institutions) changed?
| Number of Respondents | Percentage | |
|---|---|---|
| Increased Considerably | 0 | 0.0 |
| Increased Somewhat | 2 | 8.7 |
| Remained Basically Unchanged | 21 | 91.3 |
| Decreased Somewhat | 0 | 0.0 |
| Decreased Considerably | 0 | 0.0 |
| Total | 23 | 100.0 |
Central Counterparties and Other Financial Utilities
2. Over the past three months, how has the amount of resources and attention your firm devotes to management of concentrated credit exposure to central counterparties and other financial utilities changed?
| Number of Respondents | Percentage | |
|---|---|---|
| Increased Considerably | 0 | 0.0 |
| Increased Somewhat | 3 | 13.0 |
| Remained Basically Unchanged | 20 | 87.0 |
| Decreased Somewhat | 0 | 0.0 |
| Decreased Considerably | 0 | 0.0 |
| Total | 23 | 100.0 |
3. To what extent have changes in the practices of central counterparties, including margin requirements and haircuts, influenced the credit terms your institution applies to clients on bilateral transactions which are not cleared?
| Number of Respondents | Percentage | |
|---|---|---|
| To A Considerable Extent | 0 | 0.0 |
| To Some Extent | 4 | 17.4 |
| To A Minimal Extent | 12 | 52.2 |
| Not At All | 7 | 30.4 |
| Total | 23 | 100.0 |
Hedge Funds
4. Over the past three months, how have the price terms (for example, financing rates) offered to hedge funds as reflected across the entire spectrum of securities financing and OTC derivatives transaction types changed, regardless of nonprice terms? (Please indicate tightening if terms have become more stringent-for example, if financing rates have risen.)
| Number of Respondents | Percentage | |
|---|---|---|
| Tightened Considerably | 0 | 0.0 |
| Tightened Somewhat | 5 | 21.7 |
| Remained Basically Unchanged | 18 | 78.3 |
| Eased Somewhat | 0 | 0.0 |
| Eased Considerably | 0 | 0.0 |
| Total | 23 | 100.0 |
5. Over the past three months, how has your use of nonprice terms (for example, haircuts, maximum maturity, covenants, cure periods, cross-default provisions, or other documentation features) with respect to hedge funds across the entire spectrum of securities financing and OTC derivatives transaction types changed, regardless of price terms? (Please indicate tightening if terms have become more stringent-for example, if haircuts have been increased.)
| Number of Respondents | Percentage | |
|---|---|---|
| Tightened Considerably | 0 | 0.0 |
| Tightened Somewhat | 4 | 17.4 |
| Remained Basically Unchanged | 19 | 82.6 |
| Eased Somewhat | 0 | 0.0 |
| Eased Considerably | 0 | 0.0 |
| Total | 23 | 100.0 |
6. To the extent that the price or nonprice terms applied to hedge funds have tightened or eased over the past three months (as reflected in your responses to questions 4 and 5), what are the most important reasons for the change?
- Possible reasons for tightening
- Deterioration in current or expected financial strength of counterparties
Number of Respondents Percentage Most Important 2 66.7 2nd Most Important 0 0.0 3rd Most Important 1 33.3 Total 3 100.0 - Reduced willingness of your institution to take on risk
Number of Respondents Percentage Most Important 2 50.0 2nd Most Important 2 50.0 3rd Most Important 0 0.0 Total 4 100.0 - Adoption of more-stringent market conventions (that is, collateral terms and agreements, ISDA protocols)
Number of Respondents Percentage Most Important 0 0.0 2nd Most Important 1 50.0 3rd Most Important 1 50.0 Total 2 100.0 - Higher internal treasury charges for funding
Number of Respondents Percentage Most Important 0 0.0 2nd Most Important 0 0.0 3rd Most Important 0 0.0 Total 0 0.0 - Diminished availability of balance sheet or capital at your institution
Number of Respondents Percentage Most Important 0 0.0 2nd Most Important 0 0.0 3rd Most Important 0 0.0 Total 0 0.0 - Worsening in general market liquidity and functioning
Number of Respondents Percentage Most Important 0 0.0 2nd Most Important 0 0.0 3rd Most Important 0 0.0 Total 0 0.0 - Less-aggressive competition from other institutions
Number of Respondents Percentage Most Important 0 0.0 2nd Most Important 0 0.0 3rd Most Important 1 100.0 Total 1 100.0 - Other (please specify)
Number of Respondents Percentage Most Important 2 100.0 2nd Most Important 0 0.0 3rd Most Important 0 0.0 Total 2 100.0
- Deterioration in current or expected financial strength of counterparties
- Possible reasons for easing
- Improvement in current or expected financial strength of counterparties
Number of Respondents Percentage Most Important 0 0.0 2nd Most Important 0 0.0 3rd Most Important 0 0.0 Total 0 0.0 - Increased willingness of your institution to take on risk
Number of Respondents Percentage Most Important 0 0.0 2nd Most Important 0 0.0 3rd Most Important 0 0.0 Total 0 0.0 - Adoption of less-stringent market conventions (that is, collateral terms and agreements, ISDA protocols)
Number of Respondents Percentage Most Important 0 0.0 2nd Most Important 0 0.0 3rd Most Important 0 0.0 Total 0 0.0 - Lower internal treasury charges for funding
Number of Respondents Percentage Most Important 0 0.0 2nd Most Important 0 0.0 3rd Most Important 0 0.0 Total 0 0.0 - Increased availability of balance sheet or capital at your institution
Number of Respondents Percentage Most Important 0 0.0 2nd Most Important 0 0.0 3rd Most Important 0 0.0 Total 0 0.0 - Improvement in general market liquidity and functioning
Number of Respondents Percentage Most Important 0 0.0 2nd Most Important 0 0.0 3rd Most Important 0 0.0 Total 0 0.0 - More-aggressive competition from other institutions
Number of Respondents Percentage Most Important 0 0.0 2nd Most Important 0 0.0 3rd Most Important 0 0.0 Total 0 0.0 - Other (please specify)
Number of Respondents Percentage Most Important 0 0.0 2nd Most Important 0 0.0 3rd Most Important 0 0.0 Total 0 0.0
- Improvement in current or expected financial strength of counterparties
7. How has the intensity of efforts by hedge funds to negotiate more-favorable price and nonprice terms changed over the past three months?
| Number of Respondents | Percentage | |
|---|---|---|
| Increased Considerably | 0 | 0.0 |
| Increased Somewhat | 0 | 0.0 |
| Remained Basically Unchanged | 23 | 100.0 |
| Decreased Somewhat | 0 | 0.0 |
| Decreased Considerably | 0 | 0.0 |
| Total | 23 | 100.0 |
8. Considering the entire range of transactions facilitated by your institution for such clients, how has the use of financial leverage by hedge funds changed over the past three months?
| Number of Respondents | Percentage | |
|---|---|---|
| Increased Considerably | 0 | 0.0 |
| Increased Somewhat | 0 | 0.0 |
| Remained Basically Unchanged | 17 | 73.9 |
| Decreased Somewhat | 5 | 21.7 |
| Decreased Considerably | 1 | 4.3 |
| Total | 23 | 100.0 |
9. Considering the entire range of transactions facilitated by your institution for such clients, how has the availability of additional (and currently unutilized) financial leverage under agreements currently in place with hedge funds (for example, under prime broker, warehouse agreements, and other committed but undrawn or partly drawn facilities) changed over the past three months?
| Number of Respondents | Percentage | |
|---|---|---|
| Increased Considerably | 0 | 0.0 |
| Increased Somewhat | 0 | 0.0 |
| Remained Basically Unchanged | 20 | 87.0 |
| Decreased Somewhat | 2 | 8.7 |
| Decreased Considerably | 1 | 4.3 |
| Total | 23 | 100.0 |
10. How has the provision of differential terms by your institution to most-favored (as a function of breadth, duration, and extent of relationship) hedge funds changed over the past three months?
| Number of Respondents | Percentage | |
|---|---|---|
| Increased Considerably | 0 | 0.0 |
| Increased Somewhat | 1 | 4.5 |
| Remained Basically Unchanged | 20 | 90.9 |
| Decreased Somewhat | 1 | 4.5 |
| Decreased Considerably | 0 | 0.0 |
| Total | 22 | 100.0 |
Trading Real Estate Investment Trusts
11. Over the past three months, how have the price terms (for example, financing rates) offered to trading REITs as reflected across the entire spectrum of securities financing and OTC derivatives transaction types changed, regardless of nonprice terms? (Please indicate tightening if terms have become more stringent-for example, if financing rates have risen.)
| Number of Respondents | Percentage | |
|---|---|---|
| Tightened Considerably | 0 | 0.0 |
| Tightened Somewhat | 3 | 15.8 |
| Remained Basically Unchanged | 16 | 84.2 |
| Eased Somewhat | 0 | 0.0 |
| Eased Considerably | 0 | 0.0 |
| Total | 19 | 100.0 |
12. Over the past three months, how has your use of nonprice terms (for example, haircuts, maximum maturity, covenants, cure periods, cross-default provisions or other documentation features) with respect to trading REITs across the entire spectrum of securities financing and OTC derivatives transaction types changed, regardless of price terms? (Please indicate tightening if terms have become more stringent-for example, if haircuts have been increased.)
| Number of Respondents | Percentage | |
|---|---|---|
| Tightened Considerably | 0 | 0.0 |
| Tightened Somewhat | 1 | 5.6 |
| Remained Basically Unchanged | 17 | 94.4 |
| Eased Somewhat | 0 | 0.0 |
| Eased Considerably | 0 | 0.0 |
| Total | 18 | 100.0 |
13. To the extent that the price or nonprice terms applied to trading REITs have tightened or eased over the past three months (as reflected in your responses to questions 11 and 12), what are the most important reasons for the change?
- Possible reasons for tightening
- Deterioration in current or expected financial strength of counterparties
Number of Respondents Percentage Most Important 1 100.0 2nd Most Important 0 0.0 3rd Most Important 0 0.0 Total 1 100.0 - Reduced willingness of your institution to take on risk
Number of Respondents Percentage Most Important 0 0.0 2nd Most Important 0 0.0 3rd Most Important 0 0.0 Total 0 0.0 - Adoption of more-stringent market conventions (that is, collateral terms and agreements, ISDA protocols)
Number of Respondents Percentage Most Important 0 0.0 2nd Most Important 0 0.0 3rd Most Important 0 0.0 Total 0 0.0 - Higher internal treasury charges for funding
Number of Respondents Percentage Most Important 1 100.0 2nd Most Important 0 0.0 3rd Most Important 0 0.0 Total 1 100.0 - Diminished availability of balance sheet or capital at your institution
Number of Respondents Percentage Most Important 0 0.0 2nd Most Important 0 0.0 3rd Most Important 0 0.0 Total 0 0.0 - Worsening in general market liquidity and functioning
Number of Respondents Percentage Most Important 0 0.0 2nd Most Important 1 100.0 3rd Most Important 0 0.0 Total 1 100.0 - Less-aggressive competition from other institutions
Number of Respondents Percentage Most Important 0 0.0 2nd Most Important 0 0.0 3rd Most Important 0 0.0 Total 0 0.0 - Other (please specify)
Number of Respondents Percentage Most Important 1 100.0 2nd Most Important 0 0.0 3rd Most Important 0 0.0 Total 1 100.0
- Deterioration in current or expected financial strength of counterparties
- Possible reasons for easing
- Improvement in current or expected financial strength of counterparties
Number of Respondents Percentage Most Important 0 0.0 2nd Most Important 0 0.0 3rd Most Important 0 0.0 Total 0 0.0 - Increased willingness of your institution to take on risk
Number of Respondents Percentage Most Important 0 0.0 2nd Most Important 0 0.0 3rd Most Important 0 0.0 Total 0 0.0 - Adoption of less-stringent market conventions (that is, collateral terms and agreements, ISDA protocols)
Number of Respondents Percentage Most Important 0 0.0 2nd Most Important 0 0.0 3rd Most Important 0 0.0 Total 0 0.0 - Lower internal treasury charges for funding
Number of Respondents Percentage Most Important 0 0.0 2nd Most Important 0 0.0 3rd Most Important 0 0.0 Total 0 0.0 - Increased availability of balance sheet or capital at your institution
Number of Respondents Percentage Most Important 0 0.0 2nd Most Important 0 0.0 3rd Most Important 0 0.0 Total 0 0.0 - Improvement in general market liquidity and functioning
Number of Respondents Percentage Most Important 0 0.0 2nd Most Important 0 0.0 3rd Most Important 0 0.0 Total 0 0.0 - More-aggressive competition from other institutions
Number of Respondents Percentage Most Important 0 0.0 2nd Most Important 0 0.0 3rd Most Important 0 0.0 Total 0 0.0 - Other (please specify)
Number of Respondents Percentage Most Important 0 0.0 2nd Most Important 0 0.0 3rd Most Important 0 0.0 Total 0 0.0
- Improvement in current or expected financial strength of counterparties
14. How has the intensity of efforts by trading REITs to negotiate more-favorable price and nonprice terms changed over the past three months?
| Number of Respondents | Percentage | |
|---|---|---|
| Increased Considerably | 0 | 0.0 |
| Increased Somewhat | 2 | 10.5 |
| Remained Basically Unchanged | 17 | 89.5 |
| Decreased Somewhat | 0 | 0.0 |
| Decreased Considerably | 0 | 0.0 |
| Total | 19 | 100.0 |
15. Considering the entire range of transactions facilitated by your institution for such clients, how has the use of financial leverage by trading REITs changed over the past three months?
| Number of Respondents | Percentage | |
|---|---|---|
| Increased Considerably | 0 | 0.0 |
| Increased Somewhat | 0 | 0.0 |
| Remained Basically Unchanged | 19 | 100.0 |
| Decreased Somewhat | 0 | 0.0 |
| Decreased Considerably | 0 | 0.0 |
| Total | 19 | 100.0 |
16. How has the provision of differential terms by your institution to most-favored (as a function of breadth, duration, and extent of relationship) trading REITs changed over the past three months?
| Number of Respondents | Percentage | |
|---|---|---|
| Increased Considerably | 0 | 0.0 |
| Increased Somewhat | 1 | 5.3 |
| Remained Basically Unchanged | 18 | 94.7 |
| Decreased Somewhat | 0 | 0.0 |
| Decreased Considerably | 0 | 0.0 |
| Total | 19 | 100.0 |
Mutual Funds, Exchange-Traded Funds, Pension Plans, and Endowments
17. Over the past three months, how have the price terms (for example, financing rates) offered to mutual funds, ETFs, pension plans, and endowments as reflected across the entire spectrum of securities financing and OTC derivatives transaction types changed, regardless of nonprice terms? (Please indicate tightening if terms have become more stringent-for example, if financing rates have risen.)
| Number of Respondents | Percentage | |
|---|---|---|
| Tightened Considerably | 0 | 0.0 |
| Tightened Somewhat | 3 | 13.0 |
| Remained Basically Unchanged | 19 | 82.6 |
| Eased Somewhat | 1 | 4.3 |
| Eased Considerably | 0 | 0.0 |
| Total | 23 | 100.0 |
18. Over the past three months, how has your use of nonprice terms (for example, haircuts, maximum maturity, covenants, cure periods, cross-default provisions or other documentation features) with respect to mutual funds, ETFs, pension plans, and endowments across the entire spectrum of securities financing and OTC derivatives transaction types changed, regardless of price terms? (Please indicate tightening if terms have become more stringent-for example, if haircuts have been increased.)
| Number of Respondents | Percentage | |
|---|---|---|
| Tightened Considerably | 0 | 0.0 |
| Tightened Somewhat | 1 | 4.3 |
| Remained Basically Unchanged | 22 | 95.7 |
| Eased Somewhat | 0 | 0.0 |
| Eased Considerably | 0 | 0.0 |
| Total | 23 | 100.0 |
19. To the extent that the price or nonprice terms applied to mutual funds, ETFs, pension plans, and endowments have tightened or eased over the past three months (as reflected in your responses to questions 17 and 18), what are the most important reasons for the change?
- Possible reasons for tightening
- Deterioration in current or expected financial strength of counterparties
Number of Respondents Percentage Most Important 0 0.0 2nd Most Important 0 0.0 3rd Most Important 0 0.0 Total 0 0.0 - Reduced willingness of your institution to take on risk
Number of Respondents Percentage Most Important 0 0.0 2nd Most Important 0 0.0 3rd Most Important 0 0.0 Total 0 0.0 - Adoption of more-stringent market conventions (that is, collateral terms and agreements, ISDA protocols)
Number of Respondents Percentage Most Important 0 0.0 2nd Most Important 0 0.0 3rd Most Important 0 0.0 Total 0 0.0 - Higher internal treasury charges for funding
Number of Respondents Percentage Most Important 1 100.0 2nd Most Important 0 0.0 3rd Most Important 0 0.0 Total 1 100.0 - Diminished availability of balance sheet or capital at your institution
Number of Respondents Percentage Most Important 0 0.0 2nd Most Important 0 0.0 3rd Most Important 0 0.0 Total 0 0.0 - Worsening in general market liquidity and functioning
Number of Respondents Percentage Most Important 0 0.0 2nd Most Important 1 100.0 3rd Most Important 0 0.0 Total 1 100.0 - Less-aggressive competition from other institutions
Number of Respondents Percentage Most Important 0 0.0 2nd Most Important 0 0.0 3rd Most Important 0 0.0 Total 0 0.0 - Other (please specify)
Number of Respondents Percentage Most Important 3 100.0 2nd Most Important 0 0.0 3rd Most Important 0 0.0 Total 3 100.0
- Deterioration in current or expected financial strength of counterparties
- Possible reasons for easing
- Improvement in current or expected financial strength of counterparties
Number of Respondents Percentage Most Important 0 0.0 2nd Most Important 0 0.0 3rd Most Important 0 0.0 Total 0 0.0 - Increased willingness of your institution to take on risk
Number of Respondents Percentage Most Important 0 0.0 2nd Most Important 0 0.0 3rd Most Important 0 0.0 Total 0 0.0 - Adoption of less-stringent market conventions (that is, collateral terms and agreements, ISDA protocols)
Number of Respondents Percentage Most Important 0 0.0 2nd Most Important 0 0.0 3rd Most Important 0 0.0 Total 0 0.0 - Lower internal treasury charges for funding
Number of Respondents Percentage Most Important 0 0.0 2nd Most Important 0 0.0 3rd Most Important 0 0.0 Total 0 0.0 - Increased availability of balance sheet or capital at your institution
Number of Respondents Percentage Most Important 0 0.0 2nd Most Important 0 0.0 3rd Most Important 1 100.0 Total 1 100.0 - Improvement in general market liquidity and functioning
Number of Respondents Percentage Most Important 1 100.0 2nd Most Important 0 0.0 3rd Most Important 0 0.0 Total 1 100.0 - More-aggressive competition from other institutions
Number of Respondents Percentage Most Important 0 0.0 2nd Most Important 1 100.0 3rd Most Important 0 0.0 Total 1 100.0 - Other (please specify)
Number of Respondents Percentage Most Important 0 0.0 2nd Most Important 0 0.0 3rd Most Important 0 0.0 Total 0 0.0
- Improvement in current or expected financial strength of counterparties
20. How has the intensity of efforts by mutual funds, ETFs, pension plans, and endowments to negotiate more-favorable price and nonprice terms changed over the past three months?
| Number of Respondents | Percentage | |
|---|---|---|
| Increased Considerably | 0 | 0.0 |
| Increased Somewhat | 0 | 0.0 |
| Remained Basically Unchanged | 23 | 100.0 |
| Decreased Somewhat | 0 | 0.0 |
| Decreased Considerably | 0 | 0.0 |
| Total | 23 | 100.0 |
21. Considering the entire range of transactions facilitated by your institution, how has the use of financial leverage by each of the following types of clients changed over the past three months?
- Mutual funds
Number of Respondents Percentage Increased Considerably 0 0.0 Increased Somewhat 0 0.0 Remained Basically Unchanged 20 100.0 Decreased Somewhat 0 0.0 Decreased Considerably 0 0.0 Total 20 100.0 - ETFs
Number of Respondents Percentage Increased Considerably 0 0.0 Increased Somewhat 0 0.0 Remained Basically Unchanged 20 100.0 Decreased Somewhat 0 0.0 Decreased Considerably 0 0.0 Total 20 100.0 - Pension plans
Number of Respondents Percentage Increased Considerably 0 0.0 Increased Somewhat 0 0.0 Remained Basically Unchanged 21 100.0 Decreased Somewhat 0 0.0 Decreased Considerably 0 0.0 Total 21 100.0 - Endowments
Number of Respondents Percentage Increased Considerably 0 0.0 Increased Somewhat 0 0.0 Remained Basically Unchanged 20 100.0 Decreased Somewhat 0 0.0 Decreased Considerably 0 0.0 Total 20 100.0
22. How has the provision of differential terms by your institution to most-favored (as a function of breadth, duration, and extent of relationship) mutual funds, ETFs, pension plans, and endowments changed over the past three months?
| Number of Respondents | Percentage | |
|---|---|---|
| Increased Considerably | 0 | 0.0 |
| Increased Somewhat | 2 | 9.5 |
| Remained Basically Unchanged | 19 | 90.5 |
| Decreased Somewhat | 0 | 0.0 |
| Decreased Considerably | 0 | 0.0 |
| Total | 21 | 100.0 |
Insurance Companies
23. Over the past three months, how have the price terms (for example, financing rates) offered to insurance companies as reflected across the entire spectrum of securities financing and OTC derivatives transaction types changed, regardless of nonprice terms? (Please indicate tightening if terms have become more stringent-for example, if financing rates have risen.)
| Number of Respondents | Percentage | |
|---|---|---|
| Tightened Considerably | 0 | 0.0 |
| Tightened Somewhat | 0 | 0.0 |
| Remained Basically Unchanged | 22 | 100.0 |
| Eased Somewhat | 0 | 0.0 |
| Eased Considerably | 0 | 0.0 |
| Total | 22 | 100.0 |
24. Over the past three months, how has your use of nonprice terms (for example, haircuts, maximum maturity, covenants, cure periods, cross-default provisions or other documentation features) with respect to insurance companies across the entire spectrum of securities financing and OTC derivatives transaction types changed, regardless of price terms? (Please indicate tightening if terms have become more stringent-for example, if haircuts have been increased.)
| Number of Respondents | Percentage | |
|---|---|---|
| Tightened Considerably | 0 | 0.0 |
| Tightened Somewhat | 1 | 4.5 |
| Remained Basically Unchanged | 21 | 95.5 |
| Eased Somewhat | 0 | 0.0 |
| Eased Considerably | 0 | 0.0 |
| Total | 22 | 100.0 |
25. To the extent that the price or nonprice terms applied to insurance companies have tightened or eased over the past three months (as reflected in your responses to questions 23 and 24), what are the most important reasons for the change?
- Possible reasons for tightening
- Deterioration in current or expected financial strength of counterparties
Number of Respondents Percentage Most Important 0 0.0 2nd Most Important 0 0.0 3rd Most Important 0 0.0 Total 0 0.0 - Reduced willingness of your institution to take on risk
Number of Respondents Percentage Most Important 0 0.0 2nd Most Important 0 0.0 3rd Most Important 0 0.0 Total 0 0.0 - Adoption of more-stringent market conventions (that is, collateral terms and agreements, ISDA protocols)
Number of Respondents Percentage Most Important 0 0.0 2nd Most Important 0 0.0 3rd Most Important 0 0.0 Total 0 0.0 - Higher internal treasury charges for funding
Number of Respondents Percentage Most Important 0 0.0 2nd Most Important 0 0.0 3rd Most Important 0 0.0 Total 0 0.0 - Diminished availability of balance sheet or capital at your institution
Number of Respondents Percentage Most Important 0 0.0 2nd Most Important 0 0.0 3rd Most Important 0 0.0 Total 0 0.0 - Worsening in general market liquidity and functioning
Number of Respondents Percentage Most Important 0 0.0 2nd Most Important 0 0.0 3rd Most Important 0 0.0 Total 0 0.0 - Less-aggressive competition from other institutions
Number of Respondents Percentage Most Important 0 0.0 2nd Most Important 0 0.0 3rd Most Important 0 0.0 Total 0 0.0 - Other (please specify)
Number of Respondents Percentage Most Important 1 100.0 2nd Most Important 0 0.0 3rd Most Important 0 0.0 Total 1 100.0
- Deterioration in current or expected financial strength of counterparties
- Possible reasons for easing
- Improvement in current or expected financial strength of counterparties
Number of Respondents Percentage Most Important 0 0.0 2nd Most Important 0 0.0 3rd Most Important 0 0.0 Total 0 0.0 - Increased willingness of your institution to take on risk
Number of Respondents Percentage Most Important 0 0.0 2nd Most Important 0 0.0 3rd Most Important 0 0.0 Total 0 0.0 - Adoption of less-stringent market conventions (that is, collateral terms and agreements, ISDA protocols)
Number of Respondents Percentage Most Important 0 0.0 2nd Most Important 0 0.0 3rd Most Important 0 0.0 Total 0 0.0 - Lower internal treasury charges for funding
Number of Respondents Percentage Most Important 0 0.0 2nd Most Important 0 0.0 3rd Most Important 0 0.0 Total 0 0.0 - Increased availability of balance sheet or capital at your institution
Number of Respondents Percentage Most Important 0 0.0 2nd Most Important 0 0.0 3rd Most Important 0 0.0 Total 0 0.0 - Improvement in general market liquidity and functioning
Number of Respondents Percentage Most Important 0 0.0 2nd Most Important 0 0.0 3rd Most Important 0 0.0 Total 0 0.0 - More-aggressive competition from other institutions
Number of Respondents Percentage Most Important 0 0.0 2nd Most Important 0 0.0 3rd Most Important 0 0.0 Total 0 0.0 - Other (please specify)
Number of Respondents Percentage Most Important 0 0.0 2nd Most Important 0 0.0 3rd Most Important 0 0.0 Total 0 0.0
- Improvement in current or expected financial strength of counterparties
26. How has the intensity of efforts by insurance companies to negotiate more favorable price and nonprice terms changed over the past three months?
| Number of Respondents | Percentage | |
|---|---|---|
| Increased Considerably | 0 | 0.0 |
| Increased Somewhat | 0 | 0.0 |
| Remained Basically Unchanged | 22 | 100.0 |
| Decreased Somewhat | 0 | 0.0 |
| Decreased Considerably | 0 | 0.0 |
| Total | 22 | 100.0 |
27. Considering the entire range of transactions facilitated by your institution for such clients, how has the use of financial leverage by insurance companies changed over the past three months?
| Number of Respondents | Percentage | |
|---|---|---|
| Increased Considerably | 0 | 0.0 |
| Increased Somewhat | 0 | 0.0 |
| Remained Basically Unchanged | 22 | 100.0 |
| Decreased Somewhat | 0 | 0.0 |
| Decreased Considerably | 0 | 0.0 |
| Total | 22 | 100.0 |
28. How has the provision of differential terms by your institution to most favored (as a function of breadth, duration, and extent of relationship) insurance companies changed over the past three months?
| Number of Respondents | Percentage | |
|---|---|---|
| Increased Considerably | 0 | 0.0 |
| Increased Somewhat | 0 | 0.0 |
| Remained Basically Unchanged | 21 | 100.0 |
| Decreased Somewhat | 0 | 0.0 |
| Decreased Considerably | 0 | 0.0 |
| Total | 21 | 100.0 |
Investment Advisers to Separately Managed Accounts
29. Over the past three months, how have the price terms (for example, financing rates) offered to separately managed accounts established with investment advisers as reflected across the entire spectrum of securities financing and OTC derivatives transaction types changed, regardless of nonprice terms? (Please indicate tightening if terms have become more stringent-for example, if financing rates have risen.)
| Number of Respondents | Percentage | |
|---|---|---|
| Tightened Considerably | 0 | 0.0 |
| Tightened Somewhat | 3 | 14.3 |
| Remained Basically Unchanged | 18 | 85.7 |
| Eased Somewhat | 0 | 0.0 |
| Eased Considerably | 0 | 0.0 |
| Total | 21 | 100.0 |
30. Over the past three months, how has your use of nonprice terms (for example, haircuts, maximum maturity, covenants, cure periods, cross-default provisions or other documentation features) with respect to separately managed accounts established with investment advisers across the entire spectrum of securities financing and OTC derivatives transaction types changed, regardless of price terms? (Please indicate tightening if terms have become more stringent-for example, if haircuts have been increased.)
| Number of Respondents | Percentage | |
|---|---|---|
| Tightened Considerably | 0 | 0.0 |
| Tightened Somewhat | 2 | 9.5 |
| Remained Basically Unchanged | 19 | 90.5 |
| Eased Somewhat | 0 | 0.0 |
| Eased Considerably | 0 | 0.0 |
| Total | 21 | 100.0 |
31. To the extent that the price or nonprice terms applied to separately managed accounts established with investment advisers have tightened or eased over the past three months (as reflected in your responses to questions 29 and 30), what are the most important reasons for the change?
- Possible reasons for tightening
- Deterioration in current or expected financial strength of counterparties
Number of Respondents Percentage Most Important 0 0.0 2nd Most Important 0 0.0 3rd Most Important 1 100.0 Total 1 100.0 - Reduced willingness of your institution to take on risk
Number of Respondents Percentage Most Important 0 0.0 2nd Most Important 1 100.0 3rd Most Important 0 0.0 Total 1 100.0 - Adoption of more-stringent market conventions (that is, collateral terms and agreements, ISDA protocols)
Number of Respondents Percentage Most Important 1 100.0 2nd Most Important 0 0.0 3rd Most Important 0 0.0 Total 1 100.0 - Higher internal treasury charges for funding
Number of Respondents Percentage Most Important 1 100.0 2nd Most Important 0 0.0 3rd Most Important 0 0.0 Total 1 100.0 - Diminished availability of balance sheet or capital at your institution
Number of Respondents Percentage Most Important 0 0.0 2nd Most Important 0 0.0 3rd Most Important 0 0.0 Total 0 0.0 - Worsening in general market liquidity and functioning
Number of Respondents Percentage Most Important 0 0.0 2nd Most Important 1 100.0 3rd Most Important 0 0.0 Total 1 100.0 - Less-aggressive competition from other institutions
Number of Respondents Percentage Most Important 0 0.0 2nd Most Important 0 0.0 3rd Most Important 0 0.0 Total 0 0.0 - Other (please specify)
Number of Respondents Percentage Most Important 3 100.0 2nd Most Important 0 0.0 3rd Most Important 0 0.0 Total 3 100.0
- Deterioration in current or expected financial strength of counterparties
- Possible reasons for easing
- Improvement in current or expected financial strength of counterparties
Number of Respondents Percentage Most Important 0 0.0 2nd Most Important 0 0.0 3rd Most Important 0 0.0 Total 0 0.0 - Increased willingness of your institution to take on risk
Number of Respondents Percentage Most Important 0 0.0 2nd Most Important 0 0.0 3rd Most Important 0 0.0 Total 0 0.0 - Adoption of less-stringent market conventions (that is, collateral terms and agreements, ISDA protocols)
Number of Respondents Percentage Most Important 0 0.0 2nd Most Important 0 0.0 3rd Most Important 0 0.0 Total 0 0.0 - Lower internal treasury charges for funding
Number of Respondents Percentage Most Important 0 0.0 2nd Most Important 0 0.0 3rd Most Important 0 0.0 Total 0 0.0 - Increased availability of balance sheet or capital at your institution
Number of Respondents Percentage Most Important 0 0.0 2nd Most Important 0 0.0 3rd Most Important 0 0.0 Total 0 0.0 - Improvement in general market liquidity and functioning
Number of Respondents Percentage Most Important 0 0.0 2nd Most Important 0 0.0 3rd Most Important 0 0.0 Total 0 0.0 - More-aggressive competition from other institutions
Number of Respondents Percentage Most Important 0 0.0 2nd Most Important 0 0.0 3rd Most Important 0 0.0 Total 0 0.0 - Other (please specify)
Number of Respondents Percentage Most Important 0 0.0 2nd Most Important 0 0.0 3rd Most Important 0 0.0 Total 0 0.0
- Improvement in current or expected financial strength of counterparties
32. How has the intensity of efforts by investment advisers to negotiate more-favorable price and nonprice terms on behalf of separately managed accounts changed over the past three months?
| Number of Respondents | Percentage | |
|---|---|---|
| Increased Considerably | 0 | 0.0 |
| Increased Somewhat | 0 | 0.0 |
| Remained Basically Unchanged | 21 | 100.0 |
| Decreased Somewhat | 0 | 0.0 |
| Decreased Considerably | 0 | 0.0 |
| Total | 21 | 100.0 |
33. Considering the entire range of transactions facilitated by your institution for such clients, how has the use of financial leverage by separately managed accounts established with investment advisers changed over the past three months?
| Number of Respondents | Percentage | |
|---|---|---|
| Increased Considerably | 0 | 0.0 |
| Increased Somewhat | 0 | 0.0 |
| Remained Basically Unchanged | 20 | 95.2 |
| Decreased Somewhat | 0 | 0.0 |
| Decreased Considerably | 1 | 4.8 |
| Total | 21 | 100.0 |
34. How has the provision of differential terms by your institution to separately managed accounts established with most-favored (as a function of breadth, duration, and extent of relationship) investment advisers changed over the past three months?
| Number of Respondents | Percentage | |
|---|---|---|
| Increased Considerably | 0 | 0.0 |
| Increased Somewhat | 2 | 9.5 |
| Remained Basically Unchanged | 18 | 85.7 |
| Decreased Somewhat | 0 | 0.0 |
| Decreased Considerably | 1 | 4.8 |
| Total | 21 | 100.0 |
Nonfinancial Corporations
35. Over the past three months, how have the price terms (for example, financing rates) offered to nonfinancial corporations as reflected across the entire spectrum of securities financing and OTC derivatives transaction types changed, regardless of nonprice terms? (Please indicate tightening if terms have become more stringent-for example, if financing rates have risen.)
| Number of Respondents | Percentage | |
|---|---|---|
| Tightened Considerably | 0 | 0.0 |
| Tightened Somewhat | 4 | 17.4 |
| Remained Basically Unchanged | 19 | 82.6 |
| Eased Somewhat | 0 | 0.0 |
| Eased Considerably | 0 | 0.0 |
| Total | 23 | 100.0 |
36. Over the past three months, how has your use of nonprice terms (for example, haircuts, maximum maturity, covenants, cure periods, cross-default provisions or other documentation features) with respect to nonfinancial corporations across the entire spectrum of securities financing and OTC derivatives transaction types changed, regardless of price terms? (Please indicate tightening if terms have become more stringent-for example, if haircuts have been increased.)
| Number of Respondents | Percentage | |
|---|---|---|
| Tightened Considerably | 0 | 0.0 |
| Tightened Somewhat | 4 | 17.4 |
| Remained Basically Unchanged | 19 | 82.6 |
| Eased Somewhat | 0 | 0.0 |
| Eased Considerably | 0 | 0.0 |
| Total | 23 | 100.0 |
37. To the extent that the price or nonprice terms applied to nonfinancial corporations have tightened or eased over the past three months (as reflected in your responses to questions 35 and 36), what are the most important reasons for the change?
- Possible reasons for tightening
- Deterioration in current or expected financial strength of counterparties
Number of Respondents Percentage Most Important 2 66.7 2nd Most Important 0 0.0 3rd Most Important 1 33.3 Total 3 100.0 - Reduced willingness of your institution to take on risk
Number of Respondents Percentage Most Important 0 0.0 2nd Most Important 1 50.0 3rd Most Important 1 50.0 Total 2 100.0 - Adoption of more-stringent market conventions (that is, collateral terms and agreements, ISDA protocols)
Number of Respondents Percentage Most Important 0 0.0 2nd Most Important 0 0.0 3rd Most Important 0 0.0 Total 0 0.0 - Higher internal treasury charges for funding
Number of Respondents Percentage Most Important 1 100.0 2nd Most Important 0 0.0 3rd Most Important 0 0.0 Total 1 100.0 - Diminished availability of balance sheet or capital at your institution
Number of Respondents Percentage Most Important 0 0.0 2nd Most Important 0 0.0 3rd Most Important 0 0.0 Total 0 0.0 - Worsening in general market liquidity and functioning
Number of Respondents Percentage Most Important 1 33.3 2nd Most Important 2 66.7 3rd Most Important 0 0.0 Total 3 100.0 - Less-aggressive competition from other institutions
Number of Respondents Percentage Most Important 0 0.0 2nd Most Important 0 0.0 3rd Most Important 1 100.0 Total 1 100.0 - Other (please specify)
Number of Respondents Percentage Most Important 1 100.0 2nd Most Important 0 0.0 3rd Most Important 0 0.0 Total 1 100.0
- Deterioration in current or expected financial strength of counterparties
- Possible reasons for easing
- Improvement in current or expected financial strength of counterparties
Number of Respondents Percentage Most Important 0 0.0 2nd Most Important 0 0.0 3rd Most Important 0 0.0 Total 0 0.0 - Increased willingness of your institution to take on risk
Number of Respondents Percentage Most Important 0 0.0 2nd Most Important 0 0.0 3rd Most Important 0 0.0 Total 0 0.0 - Adoption of less-stringent market conventions (that is, collateral terms and agreements, ISDA protocols)
Number of Respondents Percentage Most Important 0 0.0 2nd Most Important 0 0.0 3rd Most Important 0 0.0 Total 0 0.0 - Lower internal treasury charges for funding
Number of Respondents Percentage Most Important 0 0.0 2nd Most Important 0 0.0 3rd Most Important 0 0.0 Total 0 0.0 - Increased availability of balance sheet or capital at your institution
Number of Respondents Percentage Most Important 0 0.0 2nd Most Important 0 0.0 3rd Most Important 0 0.0 Total 0 0.0 - Improvement in general market liquidity and functioning
Number of Respondents Percentage Most Important 0 0.0 2nd Most Important 0 0.0 3rd Most Important 0 0.0 Total 0 0.0 - More-aggressive competition from other institutions
Number of Respondents Percentage Most Important 0 0.0 2nd Most Important 0 0.0 3rd Most Important 0 0.0 Total 0 0.0 - Other (please specify)
Number of Respondents Percentage Most Important 0 0.0 2nd Most Important 0 0.0 3rd Most Important 0 0.0 Total 0 0.0
- Improvement in current or expected financial strength of counterparties
38. How has the intensity of efforts by nonfinancial corporations to negotiate more favorable price and nonprice terms changed over the past three months?
| Number of Respondents | Percentage | |
|---|---|---|
| Increased Considerably | 0 | 0.0 |
| Increased Somewhat | 1 | 4.3 |
| Remained Basically Unchanged | 22 | 95.7 |
| Decreased Somewhat | 0 | 0.0 |
| Decreased Considerably | 0 | 0.0 |
| Total | 23 | 100.0 |
Mark and Collateral Disputes
39. Over the past three months, how has the volume of mark and collateral disputes with clients of each of the following types changed?
- Dealers and other financial intermediaries
Number of Respondents Percentage Increased Considerably 1 4.3 Increased Somewhat 4 17.4 Remained Basically Unchanged 17 73.9 Decreased Somewhat 0 0.0 Decreased Considerably 1 4.3 Total 23 100.0 - Hedge funds
Number of Respondents Percentage Increased Considerably 1 4.3 Increased Somewhat 4 17.4 Remained Basically Unchanged 16 69.6 Decreased Somewhat 1 4.3 Decreased Considerably 1 4.3 Total 23 100.0 - Trading REITs
Number of Respondents Percentage Increased Considerably 1 5.6 Increased Somewhat 2 11.1 Remained Basically Unchanged 15 83.3 Decreased Somewhat 0 0.0 Decreased Considerably 0 0.0 Total 18 100.0 - Mutual funds, ETFs, pension plans, and endowments
Number of Respondents Percentage Increased Considerably 2 9.5 Increased Somewhat 4 19.0 Remained Basically Unchanged 13 61.9 Decreased Somewhat 1 4.8 Decreased Considerably 1 4.8 Total 21 100.0 - Insurance companies
Number of Respondents Percentage Increased Considerably 1 4.5 Increased Somewhat 4 18.2 Remained Basically Unchanged 15 68.2 Decreased Somewhat 1 4.5 Decreased Considerably 1 4.5 Total 22 100.0 - Separately managed accounts established with investment advisers
Number of Respondents Percentage Increased Considerably 1 5.3 Increased Somewhat 3 15.8 Remained Basically Unchanged 15 78.9 Decreased Somewhat 0 0.0 Decreased Considerably 0 0.0 Total 19 100.0 - Nonfinancial corporations
Number of Respondents Percentage Increased Considerably 1 5.0 Increased Somewhat 3 15.0 Remained Basically Unchanged 14 70.0 Decreased Somewhat 2 10.0 Decreased Considerably 0 0.0 Total 20 100.0
40. Over the past three months, how has the duration and persistence of mark and collateral disputes with clients of each of the following types changed?
- Dealers and other financial intermediaries
Number of Respondents Percentage Increased Considerably 1 4.3 Increased Somewhat 3 13.0 Remained Basically Unchanged 18 78.3 Decreased Somewhat 1 4.3 Decreased Considerably 0 0.0 Total 23 100.0 - Hedge funds
Number of Respondents Percentage Increased Considerably 1 4.3 Increased Somewhat 4 17.4 Remained Basically Unchanged 17 73.9 Decreased Somewhat 1 4.3 Decreased Considerably 0 0.0 Total 23 100.0 - Trading REITs
Number of Respondents Percentage Increased Considerably 0 0.0 Increased Somewhat 2 11.1 Remained Basically Unchanged 15 83.3 Decreased Somewhat 1 5.6 Decreased Considerably 0 0.0 Total 18 100.0 - Mutual funds, ETFs, pension plans, and endowments
Number of Respondents Percentage Increased Considerably 1 4.8 Increased Somewhat 2 9.5 Remained Basically Unchanged 17 81.0 Decreased Somewhat 1 4.8 Decreased Considerably 0 0.0 Total 21 100.0 - Insurance companies
Number of Respondents Percentage Increased Considerably 1 4.5 Increased Somewhat 2 9.1 Remained Basically Unchanged 18 81.8 Decreased Somewhat 1 4.5 Decreased Considerably 0 0.0 Total 22 100.0 - Separately managed accounts established with investment advisers
Number of Respondents Percentage Increased Considerably 0 0.0 Increased Somewhat 2 10.5 Remained Basically Unchanged 16 84.2 Decreased Somewhat 1 5.3 Decreased Considerably 0 0.0 Total 19 100.0 - Nonfinancial corporations
Number of Respondents Percentage Increased Considerably 0 0.0 Increased Somewhat 3 15.0 Remained Basically Unchanged 16 80.0 Decreased Somewhat 1 5.0 Decreased Considerably 0 0.0 Total 20 100.0
Over-the-Counter Derivatives
Questions 41 through 51 ask about OTC derivatives trades. Question 41 focuses on nonprice terms applicable to new and renegotiated master agreements. Questions 42 through 48 ask about the initial margin requirements for most-favored and average clients applicable to different types of contracts: Question 42 focuses on foreign exchange (FX); question 43 on interest rates; question 44 on equity; question 45 on contracts referencing corporate credits (single-name and indexes); question 46 on credit derivatives referencing structured products such as mortgage-backed securities (MBS) and asset-backed securities (ABS) (specific tranches and indexes); question 47 on commodities; and question 48 on total return swaps (TRS) referencing nonsecurities (such as bank loans, including, for example, commercial and industrial loans and mortgage whole loans). Question 49 asks about posting of nonstandard collateral pursuant to OTC derivative contracts. Questions 50 and 51 focus on mark and collateral disputes involving contracts of each of the aforementioned types.
If your institution’s terms have tightened or eased over the past three months, please so report them regardless of how they stand relative to longer-term norms. Please focus your response on dollar-denominated instruments; if material differences exist with respect to instruments denominated in other currencies, please explain in the appropriate comment space.
New and Renegotiated Master Agreements
41. Over the past three months, how have nonprice terms incorporated in new or renegotiated OTC derivatives master agreements put in place with your institution's client changed?
- Requirements, timelines, and thresholds for posting additional margin
Number of Respondents Percentage Tightened Considerably 0 0.0 Tightened Somewhat 0 0.0 Remained Basically Unchanged 19 100.0 Eased Somewhat 0 0.0 Eased Considerably 0 0.0 Total 19 100.0 - Acceptable collateral
Number of Respondents Percentage Tightened Considerably 0 0.0 Tightened Somewhat 0 0.0 Remained Basically Unchanged 19 100.0 Eased Somewhat 0 0.0 Eased Considerably 0 0.0 Total 19 100.0 - Recognition of portfolio or diversification benefits (including from securities financing trades where appropriate agreements are in place)
Number of Respondents Percentage Tightened Considerably 0 0.0 Tightened Somewhat 0 0.0 Remained Basically Unchanged 19 100.0 Eased Somewhat 0 0.0 Eased Considerably 0 0.0 Total 19 100.0 - Triggers and covenants
Number of Respondents Percentage Tightened Considerably 0 0.0 Tightened Somewhat 0 0.0 Remained Basically Unchanged 19 100.0 Eased Somewhat 0 0.0 Eased Considerably 0 0.0 Total 19 100.0 - Other documentation features (including cure periods and cross-default provisions)
Number of Respondents Percentage Tightened Considerably 0 0.0 Tightened Somewhat 0 0.0 Remained Basically Unchanged 19 100.0 Eased Somewhat 0 0.0 Eased Considerably 0 0.0 Total 19 100.0 - Other (please specify)
Number of Respondents Percentage Tightened Considerably 0 0.0 Tightened Somewhat 0 0.0 Remained Basically Unchanged 0 0.0 Eased Somewhat 0 0.0 Eased Considerably 0 0.0 Total 0 0.0
Initial Margin
42. Over the past three months, how have initial margin requirements set by your institution with respect to OTC FX derivatives changed?
- Initial margin requirements for average clients
Number of Respondents Percentage Increased Considerably 0 0.0 Increased Somewhat 3 14.3 Remained Basically Unchanged 17 81.0 Decreased Somewhat 1 4.8 Decreased Considerably 0 0.0 Total 21 100.0 - Initial margin requirements for most favored clients, as a consequence of breadth, duration, and/or extent of relationship
Number of Respondents Percentage Increased Considerably 0 0.0 Increased Somewhat 2 9.5 Remained Basically Unchanged 18 85.7 Decreased Somewhat 1 4.8 Decreased Considerably 0 0.0 Total 21 100.0
43. Over the past three months, how have initial margin requirements set by your institution with respect to OTC interest rate derivatives changed?
- Initial margin requirements for average clients
Number of Respondents Percentage Increased Considerably 0 0.0 Increased Somewhat 4 20.0 Remained Basically Unchanged 16 80.0 Decreased Somewhat 0 0.0 Decreased Considerably 0 0.0 Total 20 100.0 - Initial margin requirements for most favored clients, as a consequence of breadth, duration, and/or extent of relationship
Number of Respondents Percentage Increased Considerably 0 0.0 Increased Somewhat 4 20.0 Remained Basically Unchanged 16 80.0 Decreased Somewhat 0 0.0 Decreased Considerably 0 0.0 Total 20 100.0
44. Over the past three months, how have initial margin requirements set by your institution with respect to OTC equity derivatives changed?
- Initial margin requirements for average clients
Number of Respondents Percentage Increased Considerably 0 0.0 Increased Somewhat 1 5.3 Remained Basically Unchanged 18 94.7 Decreased Somewhat 0 0.0 Decreased Considerably 0 0.0 Total 19 100.0 - Initial margin requirements for most favored clients, as a consequence of breadth, duration, and/or extent of relationship
Number of Respondents Percentage Increased Considerably 0 0.0 Increased Somewhat 1 5.0 Remained Basically Unchanged 18 90.0 Decreased Somewhat 1 5.0 Decreased Considerably 0 0.0 Total 20 100.0
45. Over the past three months, how have initial margin requirements set by your institution with respect to OTC credit derivatives referencing corporates (single-name corporates or corporate indexes) changed?
- Initial margin requirements for average clients
Number of Respondents Percentage Increased Considerably 0 0.0 Increased Somewhat 2 13.3 Remained Basically Unchanged 13 86.7 Decreased Somewhat 0 0.0 Decreased Considerably 0 0.0 Total 15 100.0 - Initial margin requirements for most favored clients, as a consequence of breadth, duration, and/or extent of relationship
Number of Respondents Percentage Increased Considerably 0 0.0 Increased Somewhat 2 13.3 Remained Basically Unchanged 13 86.7 Decreased Somewhat 0 0.0 Decreased Considerably 0 0.0 Total 15 100.0
46. Over the past three months, how have initial margin requirements set by your institution with respect to OTC credit derivatives referencing securitized products (such as specific ABS or MBS tranches and associated indexes) changed?
- Initial margin requirements for average clients
Number of Respondents Percentage Increased Considerably 0 0.0 Increased Somewhat 1 7.7 Remained Basically Unchanged 11 84.6 Decreased Somewhat 1 7.7 Decreased Considerably 0 0.0 Total 13 100.0 - Initial margin requirements for most favored clients, as a consequence of breadth, duration, and/or extent of relationship
Number of Respondents Percentage Increased Considerably 0 0.0 Increased Somewhat 1 7.7 Remained Basically Unchanged 11 84.6 Decreased Somewhat 1 7.7 Decreased Considerably 0 0.0 Total 13 100.0
47. Over the past three months, how have initial margin requirements set by your institution with respect to OTC commodity derivatives changed?
- Initial margin requirements for average clients
Number of Respondents Percentage Increased Considerably 1 5.9 Increased Somewhat 2 11.8 Remained Basically Unchanged 12 70.6 Decreased Somewhat 1 5.9 Decreased Considerably 1 5.9 Total 17 100.0 - Initial margin requirements for most favored clients, as a consequence of breadth, duration, and/or extent of relationship
Number of Respondents Percentage Increased Considerably 1 6.3 Increased Somewhat 2 12.5 Remained Basically Unchanged 12 75.0 Decreased Somewhat 0 0.0 Decreased Considerably 1 6.3 Total 16 100.0
48. Over the past three months, how have initial margin requirements set by your institution with respect to TRS referencing non-securities (such as bank loans, including, for example, commercial and industrial loans and mortgage whole loans) changed?
- Initial margin requirements for average clients
Number of Respondents Percentage Increased Considerably 0 0.0 Increased Somewhat 1 6.3 Remained Basically Unchanged 15 93.8 Decreased Somewhat 0 0.0 Decreased Considerably 0 0.0 Total 16 100.0 - Initial margin requirements for most favored clients, as a consequence of breadth, duration, and/or extent of relationship
Number of Respondents Percentage Increased Considerably 0 0.0 Increased Somewhat 0 0.0 Remained Basically Unchanged 17 100.0 Decreased Somewhat 0 0.0 Decreased Considerably 0 0.0 Total 17 100.0
Nonstandard Collateral
49. Over the past three months, how has the posting of nonstandard collateral (that is, other than cash and U.S. Treasury securities) as permitted under relevant agreements changed?
| Number of Respondents | Percentage | |
|---|---|---|
| Increased Considerably | 0 | 0.0 |
| Increased Somewhat | 1 | 4.3 |
| Remained Basically Unchanged | 21 | 91.3 |
| Decreased Somewhat | 1 | 4.3 |
| Decreased Considerably | 0 | 0.0 |
| Total | 23 | 100.0 |
Mark and Collateral Disputes
50. Over the past three months, how has the volume of mark and collateral disputes relating to contracts of each of the following types changed?
- FX
Number of Respondents Percentage Increased Considerably 0 0.0 Increased Somewhat 5 25.0 Remained Basically Unchanged 14 70.0 Decreased Somewhat 1 5.0 Decreased Considerably 0 0.0 Total 20 100.0 - Interest rate
Number of Respondents Percentage Increased Considerably 0 0.0 Increased Somewhat 3 15.0 Remained Basically Unchanged 16 80.0 Decreased Somewhat 0 0.0 Decreased Considerably 1 5.0 Total 20 100.0 - Equity
Number of Respondents Percentage Increased Considerably 0 0.0 Increased Somewhat 4 21.1 Remained Basically Unchanged 13 68.4 Decreased Somewhat 1 5.3 Decreased Considerably 1 5.3 Total 19 100.0 - Credit referencing corporates
Number of Respondents Percentage Increased Considerably 1 6.7 Increased Somewhat 2 13.3 Remained Basically Unchanged 12 80.0 Decreased Somewhat 0 0.0 Decreased Considerably 0 0.0 Total 15 100.0 - Credit referencing securitized products including MBS and ABS
Number of Respondents Percentage Increased Considerably 1 6.7 Increased Somewhat 2 13.3 Remained Basically Unchanged 11 73.3 Decreased Somewhat 1 6.7 Decreased Considerably 0 0.0 Total 15 100.0 - Commodity
Number of Respondents Percentage Increased Considerably 1 6.7 Increased Somewhat 3 20.0 Remained Basically Unchanged 11 73.3 Decreased Somewhat 0 0.0 Decreased Considerably 0 0.0 Total 15 100.0 - TRS referencing non-securities (such as bank loans, including, for example, commercial and industrial loans and mortgage whole loans)
Number of Respondents Percentage Increased Considerably 1 7.1 Increased Somewhat 1 7.1 Remained Basically Unchanged 12 85.7 Decreased Somewhat 0 0.0 Decreased Considerably 0 0.0 Total 14 100.0
51. Over the past three months, how has the duration and persistence of mark and collateral disputes relating to contracts of each of the following types changed?
- FX
Number of Respondents Percentage Increased Considerably 0 0.0 Increased Somewhat 3 15.0 Remained Basically Unchanged 16 80.0 Decreased Somewhat 1 5.0 Decreased Considerably 0 0.0 Total 20 100.0 - Interest rate
Number of Respondents Percentage Increased Considerably 0 0.0 Increased Somewhat 1 5.0 Remained Basically Unchanged 18 90.0 Decreased Somewhat 1 5.0 Decreased Considerably 0 0.0 Total 20 100.0 - Equity
Number of Respondents Percentage Increased Considerably 1 5.3 Increased Somewhat 2 10.5 Remained Basically Unchanged 15 78.9 Decreased Somewhat 1 5.3 Decreased Considerably 0 0.0 Total 19 100.0 - Credit referencing corporates
Number of Respondents Percentage Increased Considerably 0 0.0 Increased Somewhat 2 13.3 Remained Basically Unchanged 12 80.0 Decreased Somewhat 1 6.7 Decreased Considerably 0 0.0 Total 15 100.0 - Credit referencing securitized products including MBS and ABS
Number of Respondents Percentage Increased Considerably 0 0.0 Increased Somewhat 2 13.3 Remained Basically Unchanged 12 80.0 Decreased Somewhat 1 6.7 Decreased Considerably 0 0.0 Total 15 100.0 - Commodity
Number of Respondents Percentage Increased Considerably 0 0.0 Increased Somewhat 1 6.7 Remained Basically Unchanged 13 86.7 Decreased Somewhat 1 6.7 Decreased Considerably 0 0.0 Total 15 100.0 - TRS referencing non-securities (such as bank loans, including, for example, commercial and industrial loans and mortgage whole loans)
Number of Respondents Percentage Increased Considerably 0 0.0 Increased Somewhat 1 7.1 Remained Basically Unchanged 12 85.7 Decreased Somewhat 1 7.1 Decreased Considerably 0 0.0 Total 14 100.0
Securities Financing
Questions 52 through 79 ask about securities funding at your institution--that is, lending to clients collateralized by securities. Such activities may be conducted on a "repo" desk, on a trading desk engaged in facilitation for institutional clients and/or proprietary transactions, on a funding desk, or on a prime brokerage platform. Questions 52 through 55 focus on lending against high-grade corporate bonds; questions 56 through 59 on lending against high-yield corporate bonds; questions 60 and 61 on lending against equities (including through stock loan); questions 62 through 65 on lending against agency residential mortgage-backed securities (agency RMBS); questions 66 through 69 on lending against non-agency residential mortgage-backed securities (non-agency RMBS); questions 70 through 73 on lending against commercial mortgage-backed securities (CMBS); and questions 74 through 77 on consumer ABS (for example, backed by credit card receivables or auto loans). Questions 78 and 79 ask about mark and collateral disputes for lending backed by each of the aforementioned contract types.
If your institution’s terms have tightened or eased over the past three months, please so report them regardless of how they stand relative to longer-term norms. Please focus your response on dollar-denominated instruments; if material differences exist with respect to instruments denominated in other currencies, please explain in the appropriate comment space.
High-Grade Corporate Bonds
52. Over the past three months, how have the terms under which high-grade corporate bonds are funded changed?
- Terms for average clients
- Maximum amount of funding
Number of Respondents Percentage Tightened Considerably 0 0.0 Tightened Somewhat 3 14.3 Remained Basically Unchanged 18 85.7 Eased Somewhat 0 0.0 Eased Considerably 0 0.0 Total 21 100.0 - Maximum maturity
Number of Respondents Percentage Tightened Considerably 0 0.0 Tightened Somewhat 2 9.5 Remained Basically Unchanged 19 90.5 Eased Somewhat 0 0.0 Eased Considerably 0 0.0 Total 21 100.0 - Haircuts
Number of Respondents Percentage Tightened Considerably 1 4.8 Tightened Somewhat 2 9.5 Remained Basically Unchanged 18 85.7 Eased Somewhat 0 0.0 Eased Considerably 0 0.0 Total 21 100.0 - Collateral spreads over relevant benchmark (effective financing rates)
Number of Respondents Percentage Tightened Considerably 1 4.8 Tightened Somewhat 3 14.3 Remained Basically Unchanged 17 81.0 Eased Somewhat 0 0.0 Eased Considerably 0 0.0 Total 21 100.0 - Other (please specify)
Number of Respondents Percentage Tightened Considerably 0 0.0 Tightened Somewhat 0 0.0 Remained Basically Unchanged 0 0.0 Eased Somewhat 0 0.0 Eased Considerably 0 0.0 Total 0 0.0
- Maximum amount of funding
- Terms for most favored clients, as a consequence of breadth, duration and/or extent of relationship
- Maximum amount of funding
Number of Respondents Percentage Tightened Considerably 0 0.0 Tightened Somewhat 3 14.3 Remained Basically Unchanged 16 76.2 Eased Somewhat 2 9.5 Eased Considerably 0 0.0 Total 21 100.0 - Maximum maturity
Number of Respondents Percentage Tightened Considerably 0 0.0 Tightened Somewhat 2 9.5 Remained Basically Unchanged 18 85.7 Eased Somewhat 1 4.8 Eased Considerably 0 0.0 Total 21 100.0 - Haircuts
Number of Respondents Percentage Tightened Considerably 1 4.8 Tightened Somewhat 2 9.5 Remained Basically Unchanged 17 81.0 Eased Somewhat 1 4.8 Eased Considerably 0 0.0 Total 21 100.0 - Collateral spreads over relevant benchmark (effective financing rates)
Number of Respondents Percentage Tightened Considerably 1 4.8 Tightened Somewhat 3 14.3 Remained Basically Unchanged 17 81.0 Eased Somewhat 0 0.0 Eased Considerably 0 0.0 Total 21 100.0 - Other (please specify)
Number of Respondents Percentage Tightened Considerably 0 0.0 Tightened Somewhat 0 0.0 Remained Basically Unchanged 0 0.0 Eased Somewhat 0 0.0 Eased Considerably 0 0.0 Total 0 0.0
- Maximum amount of funding
53. Over the past three months, how has demand for funding of high-grade corporate bonds by your institution's clients changed?
| Number of Respondents | Percentage | |
|---|---|---|
| Increased Considerably | 1 | 4.8 |
| Increased Somewhat | 1 | 4.8 |
| Remained Basically Unchanged | 18 | 85.7 |
| Decreased Somewhat | 1 | 4.8 |
| Decreased Considerably | 0 | 0.0 |
| Total | 21 | 100.0 |
54. Over the past three months, how has demand for term funding with a maturity greater than 30 days of high-grade corporate bonds by your institution's clients changed?
| Number of Respondents | Percentage | |
|---|---|---|
| Increased Considerably | 0 | 0.0 |
| Increased Somewhat | 2 | 9.5 |
| Remained Basically Unchanged | 19 | 90.5 |
| Decreased Somewhat | 0 | 0.0 |
| Decreased Considerably | 0 | 0.0 |
| Total | 21 | 100.0 |
55. Over the past three months, how have liquidity and functioning in the high-grade corporate bond market changed?
| Number of Respondents | Percentage | |
|---|---|---|
| Improved Considerably | 0 | 0.0 |
| Improved Somewhat | 1 | 4.5 |
| Remained Basically Unchanged | 17 | 77.3 |
| Deteriorated Somewhat | 4 | 18.2 |
| Deteriorated Considerably | 0 | 0.0 |
| Total | 22 | 100.0 |
Funding of High-Yield Corporate Bonds
56. Over the past three months, how have the terms under which high-yield corporate bonds are funded changed?
- Terms for average clients
- Maximum amount of funding
Number of Respondents Percentage Tightened Considerably 1 5.3 Tightened Somewhat 1 5.3 Remained Basically Unchanged 17 89.5 Eased Somewhat 0 0.0 Eased Considerably 0 0.0 Total 19 100.0 - Maximum maturity
Number of Respondents Percentage Tightened Considerably 1 5.3 Tightened Somewhat 1 5.3 Remained Basically Unchanged 17 89.5 Eased Somewhat 0 0.0 Eased Considerably 0 0.0 Total 19 100.0 - Haircuts
Number of Respondents Percentage Tightened Considerably 2 10.5 Tightened Somewhat 1 5.3 Remained Basically Unchanged 16 84.2 Eased Somewhat 0 0.0 Eased Considerably 0 0.0 Total 19 100.0 - Collateral spreads over relevant benchmark (effective financing rates)
Number of Respondents Percentage Tightened Considerably 2 10.5 Tightened Somewhat 3 15.8 Remained Basically Unchanged 14 73.7 Eased Somewhat 0 0.0 Eased Considerably 0 0.0 Total 19 100.0 - Other (please specify)
Number of Respondents Percentage Tightened Considerably 0 0.0 Tightened Somewhat 0 0.0 Remained Basically Unchanged 0 0.0 Eased Somewhat 0 0.0 Eased Considerably 0 0.0 Total 0 0.0
- Maximum amount of funding
- Terms for most favored clients, as a consequence of breadth, duration and/or extent of relationship
- Maximum amount of funding
Number of Respondents Percentage Tightened Considerably 1 5.3 Tightened Somewhat 1 5.3 Remained Basically Unchanged 15 78.9 Eased Somewhat 2 10.5 Eased Considerably 0 0.0 Total 19 100.0 - Maximum maturity
Number of Respondents Percentage Tightened Considerably 1 5.3 Tightened Somewhat 1 5.3 Remained Basically Unchanged 16 84.2 Eased Somewhat 1 5.3 Eased Considerably 0 0.0 Total 19 100.0 - Haircuts
Number of Respondents Percentage Tightened Considerably 2 10.5 Tightened Somewhat 1 5.3 Remained Basically Unchanged 15 78.9 Eased Somewhat 1 5.3 Eased Considerably 0 0.0 Total 19 100.0 - Collateral spreads over relevant benchmark (effective financing rates)
Number of Respondents Percentage Tightened Considerably 2 10.5 Tightened Somewhat 3 15.8 Remained Basically Unchanged 13 68.4 Eased Somewhat 1 5.3 Eased Considerably 0 0.0 Total 19 100.0 - Other (please specify)
Number of Respondents Percentage Tightened Considerably 0 0.0 Tightened Somewhat 0 0.0 Remained Basically Unchanged 0 0.0 Eased Somewhat 0 0.0 Eased Considerably 0 0.0 Total 0 0.0
- Maximum amount of funding
57. Over the past three months, how has demand for funding of high-yield corporate bonds by your institution's clients changed?
| Number of Respondents | Percentage | |
|---|---|---|
| Increased Considerably | 0 | 0.0 |
| Increased Somewhat | 2 | 10.5 |
| Remained Basically Unchanged | 16 | 84.2 |
| Decreased Somewhat | 1 | 5.3 |
| Decreased Considerably | 0 | 0.0 |
| Total | 19 | 100.0 |
58. Over the past three months, how has demand for term funding with a maturity greater than 30 days of high-yield corporate bonds by your institution's clients changed?
| Number of Respondents | Percentage | |
|---|---|---|
| Increased Considerably | 0 | 0.0 |
| Increased Somewhat | 2 | 10.5 |
| Remained Basically Unchanged | 17 | 89.5 |
| Decreased Somewhat | 0 | 0.0 |
| Decreased Considerably | 0 | 0.0 |
| Total | 19 | 100.0 |
59. Over the past three months, how have liquidity and functioning in the high-yield corporate bond market changed?
| Number of Respondents | Percentage | |
|---|---|---|
| Improved Considerably | 0 | 0.0 |
| Improved Somewhat | 1 | 5.0 |
| Remained Basically Unchanged | 17 | 85.0 |
| Deteriorated Somewhat | 2 | 10.0 |
| Deteriorated Considerably | 0 | 0.0 |
| Total | 20 | 100.0 |
Equities (Including through Stock Loan)
60. Over the past three months, how have the terms under which equities are funded (including through stock loan) changed?
- Terms for average clients
- Maximum amount of funding
Number of Respondents Percentage Tightened Considerably 0 0.0 Tightened Somewhat 2 10.0 Remained Basically Unchanged 18 90.0 Eased Somewhat 0 0.0 Eased Considerably 0 0.0 Total 20 100.0 - Maximum maturity
Number of Respondents Percentage Tightened Considerably 0 0.0 Tightened Somewhat 2 10.0 Remained Basically Unchanged 18 90.0 Eased Somewhat 0 0.0 Eased Considerably 0 0.0 Total 20 100.0 - Haircuts
Number of Respondents Percentage Tightened Considerably 0 0.0 Tightened Somewhat 2 10.0 Remained Basically Unchanged 18 90.0 Eased Somewhat 0 0.0 Eased Considerably 0 0.0 Total 20 100.0 - Collateral spreads over relevant benchmark (effective financing rates)
Number of Respondents Percentage Tightened Considerably 0 0.0 Tightened Somewhat 3 15.0 Remained Basically Unchanged 16 80.0 Eased Somewhat 1 5.0 Eased Considerably 0 0.0 Total 20 100.0 - Other (please specify)
Number of Respondents Percentage Tightened Considerably 0 0.0 Tightened Somewhat 0 0.0 Remained Basically Unchanged 0 0.0 Eased Somewhat 0 0.0 Eased Considerably 0 0.0 Total 0 0.0
- Maximum amount of funding
- Terms for most favored clients, as a consequence of breadth, duration and/or extent of relationship
- Maximum amount of funding
Number of Respondents Percentage Tightened Considerably 0 0.0 Tightened Somewhat 1 5.0 Remained Basically Unchanged 19 95.0 Eased Somewhat 0 0.0 Eased Considerably 0 0.0 Total 20 100.0 - Maximum maturity
Number of Respondents Percentage Tightened Considerably 0 0.0 Tightened Somewhat 1 5.0 Remained Basically Unchanged 19 95.0 Eased Somewhat 0 0.0 Eased Considerably 0 0.0 Total 20 100.0 - Haircuts
Number of Respondents Percentage Tightened Considerably 0 0.0 Tightened Somewhat 1 5.0 Remained Basically Unchanged 19 95.0 Eased Somewhat 0 0.0 Eased Considerably 0 0.0 Total 20 100.0 - Collateral spreads over relevant benchmark (effective financing rates)
Number of Respondents Percentage Tightened Considerably 0 0.0 Tightened Somewhat 1 5.0 Remained Basically Unchanged 18 90.0 Eased Somewhat 1 5.0 Eased Considerably 0 0.0 Total 20 100.0 - Other (please specify)
Number of Respondents Percentage Tightened Considerably 0 0.0 Tightened Somewhat 0 0.0 Remained Basically Unchanged 0 0.0 Eased Somewhat 0 0.0 Eased Considerably 0 0.0 Total 0 0.0
- Maximum amount of funding
61. Over the past three months, how has demand for funding of equities (including through stock loan) by your institution's clients changed?
| Number of Respondents | Percentage | |
|---|---|---|
| Increased Considerably | 0 | 0.0 |
| Increased Somewhat | 1 | 5.0 |
| Remained Basically Unchanged | 13 | 65.0 |
| Decreased Somewhat | 6 | 30.0 |
| Decreased Considerably | 0 | 0.0 |
| Total | 20 | 100.0 |
Agency Residential Mortgage-Backed Securities
62. Over the past three months, how have the terms under which agency RMBS are funded changed?
- Terms for average clients
- Maximum amount of funding
Number of Respondents Percentage Tightened Considerably 0 0.0 Tightened Somewhat 0 0.0 Remained Basically Unchanged 18 94.7 Eased Somewhat 1 5.3 Eased Considerably 0 0.0 Total 19 100.0 - Maximum maturity
Number of Respondents Percentage Tightened Considerably 0 0.0 Tightened Somewhat 0 0.0 Remained Basically Unchanged 18 94.7 Eased Somewhat 1 5.3 Eased Considerably 0 0.0 Total 19 100.0 - Haircuts
Number of Respondents Percentage Tightened Considerably 1 5.3 Tightened Somewhat 0 0.0 Remained Basically Unchanged 17 89.5 Eased Somewhat 1 5.3 Eased Considerably 0 0.0 Total 19 100.0 - Collateral spreads over relevant benchmark (effective financing rates)
Number of Respondents Percentage Tightened Considerably 1 5.3 Tightened Somewhat 1 5.3 Remained Basically Unchanged 15 78.9 Eased Somewhat 2 10.5 Eased Considerably 0 0.0 Total 19 100.0 - Other (please specify)
Number of Respondents Percentage Tightened Considerably 0 0.0 Tightened Somewhat 0 0.0 Remained Basically Unchanged 0 0.0 Eased Somewhat 0 0.0 Eased Considerably 0 0.0 Total 0 0.0
- Maximum amount of funding
- Terms for most favored clients, as a consequence of breadth, duration and/or extent of relationship
- Maximum amount of funding
Number of Respondents Percentage Tightened Considerably 0 0.0 Tightened Somewhat 0 0.0 Remained Basically Unchanged 18 94.7 Eased Somewhat 1 5.3 Eased Considerably 0 0.0 Total 19 100.0 - Maximum maturity
Number of Respondents Percentage Tightened Considerably 0 0.0 Tightened Somewhat 0 0.0 Remained Basically Unchanged 18 94.7 Eased Somewhat 1 5.3 Eased Considerably 0 0.0 Total 19 100.0 - Haircuts
Number of Respondents Percentage Tightened Considerably 1 5.3 Tightened Somewhat 0 0.0 Remained Basically Unchanged 17 89.5 Eased Somewhat 1 5.3 Eased Considerably 0 0.0 Total 19 100.0 - Collateral spreads over relevant benchmark (effective financing rates)
Number of Respondents Percentage Tightened Considerably 1 5.3 Tightened Somewhat 1 5.3 Remained Basically Unchanged 15 78.9 Eased Somewhat 2 10.5 Eased Considerably 0 0.0 Total 19 100.0 - Other (please specify)
Number of Respondents Percentage Tightened Considerably 0 0.0 Tightened Somewhat 0 0.0 Remained Basically Unchanged 0 0.0 Eased Somewhat 0 0.0 Eased Considerably 0 0.0 Total 0 0.0
- Maximum amount of funding
63. Over the past three months, how has demand for funding of agency RMBS by your institution's clients changed?
| Number of Respondents | Percentage | |
|---|---|---|
| Increased Considerably | 0 | 0.0 |
| Increased Somewhat | 1 | 4.8 |
| Remained Basically Unchanged | 18 | 85.7 |
| Decreased Somewhat | 2 | 9.5 |
| Decreased Considerably | 0 | 0.0 |
| Total | 21 | 100.0 |
64. Over the past three months, how has demand for term funding with a maturity greater than 30 days of agency RMBS by your institution's clients changed?
| Number of Respondents | Percentage | |
|---|---|---|
| Increased Considerably | 0 | 0.0 |
| Increased Somewhat | 1 | 4.8 |
| Remained Basically Unchanged | 19 | 90.5 |
| Decreased Somewhat | 1 | 4.8 |
| Decreased Considerably | 0 | 0.0 |
| Total | 21 | 100.0 |
65. Over the past three months, how have liquidity and functioning in the agency RMBS market changed?
| Number of Respondents | Percentage | |
|---|---|---|
| Improved Considerably | 0 | 0.0 |
| Improved Somewhat | 0 | 0.0 |
| Remained Basically Unchanged | 17 | 81.0 |
| Deteriorated Somewhat | 4 | 19.0 |
| Deteriorated Considerably | 0 | 0.0 |
| Total | 21 | 100.0 |
Non-agency Residential Mortgage-Backed Securities
66. Over the past three months, how have the terms under which non-agency RMBS are funded changed?
- Terms for average clients
- Maximum amount of funding
Number of Respondents Percentage Tightened Considerably 0 0.0 Tightened Somewhat 0 0.0 Remained Basically Unchanged 14 87.5 Eased Somewhat 2 12.5 Eased Considerably 0 0.0 Total 16 100.0 - Maximum maturity
Number of Respondents Percentage Tightened Considerably 0 0.0 Tightened Somewhat 0 0.0 Remained Basically Unchanged 15 93.8 Eased Somewhat 1 6.3 Eased Considerably 0 0.0 Total 16 100.0 - Haircuts
Number of Respondents Percentage Tightened Considerably 0 0.0 Tightened Somewhat 1 6.3 Remained Basically Unchanged 13 81.3 Eased Somewhat 2 12.5 Eased Considerably 0 0.0 Total 16 100.0 - Collateral spreads over relevant benchmark (effective financing rates)
Number of Respondents Percentage Tightened Considerably 0 0.0 Tightened Somewhat 4 25.0 Remained Basically Unchanged 10 62.5 Eased Somewhat 2 12.5 Eased Considerably 0 0.0 Total 16 100.0 - Other (please specify)
Number of Respondents Percentage Tightened Considerably 0 0.0 Tightened Somewhat 0 0.0 Remained Basically Unchanged 0 0.0 Eased Somewhat 0 0.0 Eased Considerably 0 0.0 Total 0 0.0
- Maximum amount of funding
- Terms for most favored clients, as a consequence of breadth, duration and/or extent of relationship
- Maximum amount of funding
Number of Respondents Percentage Tightened Considerably 0 0.0 Tightened Somewhat 0 0.0 Remained Basically Unchanged 14 87.5 Eased Somewhat 2 12.5 Eased Considerably 0 0.0 Total 16 100.0 - Maximum maturity
Number of Respondents Percentage Tightened Considerably 0 0.0 Tightened Somewhat 0 0.0 Remained Basically Unchanged 15 93.8 Eased Somewhat 1 6.3 Eased Considerably 0 0.0 Total 16 100.0 - Haircuts
Number of Respondents Percentage Tightened Considerably 0 0.0 Tightened Somewhat 0 0.0 Remained Basically Unchanged 14 87.5 Eased Somewhat 2 12.5 Eased Considerably 0 0.0 Total 16 100.0 - Collateral spreads over relevant benchmark (effective financing rates)
Number of Respondents Percentage Tightened Considerably 0 0.0 Tightened Somewhat 4 25.0 Remained Basically Unchanged 10 62.5 Eased Somewhat 2 12.5 Eased Considerably 0 0.0 Total 16 100.0 - Other (please specify)
Number of Respondents Percentage Tightened Considerably 0 0.0 Tightened Somewhat 0 0.0 Remained Basically Unchanged 0 0.0 Eased Somewhat 0 0.0 Eased Considerably 0 0.0 Total 0 0.0
- Maximum amount of funding
67. Over the past three months, how has demand for funding of non-agency RMBS by your institution's clients changed?
| Number of Respondents | Percentage | |
|---|---|---|
| Increased Considerably | 0 | 0.0 |
| Increased Somewhat | 2 | 11.8 |
| Remained Basically Unchanged | 15 | 88.2 |
| Decreased Somewhat | 0 | 0.0 |
| Decreased Considerably | 0 | 0.0 |
| Total | 17 | 100.0 |
68. Over the past three months, how has demand for term funding with a maturity greater than 30 days of non-agency RMBS by your institution's clients changed?
| Number of Respondents | Percentage | |
|---|---|---|
| Increased Considerably | 0 | 0.0 |
| Increased Somewhat | 3 | 17.6 |
| Remained Basically Unchanged | 14 | 82.4 |
| Decreased Somewhat | 0 | 0.0 |
| Decreased Considerably | 0 | 0.0 |
| Total | 17 | 100.0 |
69. Over the past three months, how have liquidity and functioning in the non-agency RMBS market changed?
| Number of Respondents | Percentage | |
|---|---|---|
| Improved Considerably | 0 | 0.0 |
| Improved Somewhat | 0 | 0.0 |
| Remained Basically Unchanged | 16 | 94.1 |
| Deteriorated Somewhat | 1 | 5.9 |
| Deteriorated Considerably | 0 | 0.0 |
| Total | 17 | 100.0 |
Commercial Mortgage-Backed Securities
70. Over the past three months, how have the terms under which CMBS are funded changed?
- Terms for average clients
- Maximum amount of funding
Number of Respondents Percentage Tightened Considerably 0 0.0 Tightened Somewhat 0 0.0 Remained Basically Unchanged 17 100.0 Eased Somewhat 0 0.0 Eased Considerably 0 0.0 Total 17 100.0 - Maximum maturity
Number of Respondents Percentage Tightened Considerably 0 0.0 Tightened Somewhat 0 0.0 Remained Basically Unchanged 17 100.0 Eased Somewhat 0 0.0 Eased Considerably 0 0.0 Total 17 100.0 - Haircuts
Number of Respondents Percentage Tightened Considerably 0 0.0 Tightened Somewhat 0 0.0 Remained Basically Unchanged 16 94.1 Eased Somewhat 1 5.9 Eased Considerably 0 0.0 Total 17 100.0 - Collateral spreads over relevant benchmark (effective financing rates)
Number of Respondents Percentage Tightened Considerably 0 0.0 Tightened Somewhat 3 17.6 Remained Basically Unchanged 13 76.5 Eased Somewhat 1 5.9 Eased Considerably 0 0.0 Total 17 100.0 - Other (please specify)
Number of Respondents Percentage Tightened Considerably 0 0.0 Tightened Somewhat 1 100.0 Remained Basically Unchanged 0 0.0 Eased Somewhat 0 0.0 Eased Considerably 0 0.0 Total 1 100.0
- Maximum amount of funding
- Terms for most favored clients, as a consequence of breadth, duration and/or extent of relationship
- Maximum amount of funding
Number of Respondents Percentage Tightened Considerably 0 0.0 Tightened Somewhat 0 0.0 Remained Basically Unchanged 17 100.0 Eased Somewhat 0 0.0 Eased Considerably 0 0.0 Total 17 100.0 - Maximum maturity
Number of Respondents Percentage Tightened Considerably 0 0.0 Tightened Somewhat 0 0.0 Remained Basically Unchanged 17 100.0 Eased Somewhat 0 0.0 Eased Considerably 0 0.0 Total 17 100.0 - Haircuts
Number of Respondents Percentage Tightened Considerably 0 0.0 Tightened Somewhat 0 0.0 Remained Basically Unchanged 16 94.1 Eased Somewhat 1 5.9 Eased Considerably 0 0.0 Total 17 100.0 - Collateral spreads over relevant benchmark (effective financing rates)
Number of Respondents Percentage Tightened Considerably 0 0.0 Tightened Somewhat 2 11.8 Remained Basically Unchanged 14 82.4 Eased Somewhat 1 5.9 Eased Considerably 0 0.0 Total 17 100.0 - Other (please specify)
Number of Respondents Percentage Tightened Considerably 0 0.0 Tightened Somewhat 1 100.0 Remained Basically Unchanged 0 0.0 Eased Somewhat 0 0.0 Eased Considerably 0 0.0 Total 1 100.0
- Maximum amount of funding
71. Over the past three months, how has demand for funding of CMBS by your institution's clients changed?
| Number of Respondents | Percentage | |
|---|---|---|
| Increased Considerably | 0 | 0.0 |
| Increased Somewhat | 1 | 5.6 |
| Remained Basically Unchanged | 16 | 88.9 |
| Decreased Somewhat | 1 | 5.6 |
| Decreased Considerably | 0 | 0.0 |
| Total | 18 | 100.0 |
72. Over the past three months, how has demand for term funding with a maturity greater than 30 days of CMBS by your institution's clients changed?
| Number of Respondents | Percentage | |
|---|---|---|
| Increased Considerably | 0 | 0.0 |
| Increased Somewhat | 2 | 11.1 |
| Remained Basically Unchanged | 15 | 83.3 |
| Decreased Somewhat | 1 | 5.6 |
| Decreased Considerably | 0 | 0.0 |
| Total | 18 | 100.0 |
73. Over the past three months, how have liquidity and functioning in the CMBS market changed?
| Number of Respondents | Percentage | |
|---|---|---|
| Improved Considerably | 0 | 0.0 |
| Improved Somewhat | 0 | 0.0 |
| Remained Basically Unchanged | 15 | 83.3 |
| Deteriorated Somewhat | 2 | 11.1 |
| Deteriorated Considerably | 1 | 5.6 |
| Total | 18 | 100.0 |
Consumer Asset-Backed Securities
74. Over the past three months, how have the terms under which consumer ABS (for example, backed by credit card receivables or auto loans) are funded changed?
- Terms for average clients
- Maximum amount of funding
Number of Respondents Percentage Tightened Considerably 0 0.0 Tightened Somewhat 0 0.0 Remained Basically Unchanged 14 100.0 Eased Somewhat 0 0.0 Eased Considerably 0 0.0 Total 14 100.0 - Maximum maturity
Number of Respondents Percentage Tightened Considerably 0 0.0 Tightened Somewhat 0 0.0 Remained Basically Unchanged 14 100.0 Eased Somewhat 0 0.0 Eased Considerably 0 0.0 Total 14 100.0 - Haircuts
Number of Respondents Percentage Tightened Considerably 0 0.0 Tightened Somewhat 2 14.3 Remained Basically Unchanged 11 78.6 Eased Somewhat 1 7.1 Eased Considerably 0 0.0 Total 14 100.0 - Collateral spreads over relevant benchmark (effective financing rates)
Number of Respondents Percentage Tightened Considerably 1 7.1 Tightened Somewhat 2 14.3 Remained Basically Unchanged 10 71.4 Eased Somewhat 1 7.1 Eased Considerably 0 0.0 Total 14 100.0 - Other (please specify)
Number of Respondents Percentage Tightened Considerably 0 0.0 Tightened Somewhat 0 0.0 Remained Basically Unchanged 0 0.0 Eased Somewhat 0 0.0 Eased Considerably 0 0.0 Total 0 0.0
- Maximum amount of funding
- Terms for most favored clients, as a consequence of breadth, duration and/or extent of relationship
- Maximum amount of funding
Number of Respondents Percentage Tightened Considerably 0 0.0 Tightened Somewhat 0 0.0 Remained Basically Unchanged 14 100.0 Eased Somewhat 0 0.0 Eased Considerably 0 0.0 Total 14 100.0 - Maximum maturity
Number of Respondents Percentage Tightened Considerably 0 0.0 Tightened Somewhat 0 0.0 Remained Basically Unchanged 14 100.0 Eased Somewhat 0 0.0 Eased Considerably 0 0.0 Total 14 100.0 - Haircuts
Number of Respondents Percentage Tightened Considerably 0 0.0 Tightened Somewhat 0 0.0 Remained Basically Unchanged 13 92.9 Eased Somewhat 1 7.1 Eased Considerably 0 0.0 Total 14 100.0 - Collateral spreads over relevant benchmark (effective financing rates)
Number of Respondents Percentage Tightened Considerably 1 7.1 Tightened Somewhat 2 14.3 Remained Basically Unchanged 10 71.4 Eased Somewhat 1 7.1 Eased Considerably 0 0.0 Total 14 100.0 - Other (please specify)
Number of Respondents Percentage Tightened Considerably 0 0.0 Tightened Somewhat 0 0.0 Remained Basically Unchanged 0 0.0 Eased Somewhat 0 0.0 Eased Considerably 0 0.0 Total 0 0.0
- Maximum amount of funding
75. Over the past three months, how has demand for funding of consumer ABS by your institution's clients changed?
| Number of Respondents | Percentage | |
|---|---|---|
| Increased Considerably | 0 | 0.0 |
| Increased Somewhat | 2 | 13.3 |
| Remained Basically Unchanged | 13 | 86.7 |
| Decreased Somewhat | 0 | 0.0 |
| Decreased Considerably | 0 | 0.0 |
| Total | 15 | 100.0 |
76. Over the past three months, how has demand for term funding with a maturity greater than 30 days of consumer ABS by your institution's clients changed?
| Number of Respondents | Percentage | |
|---|---|---|
| Increased Considerably | 0 | 0.0 |
| Increased Somewhat | 2 | 13.3 |
| Remained Basically Unchanged | 13 | 86.7 |
| Decreased Somewhat | 0 | 0.0 |
| Decreased Considerably | 0 | 0.0 |
| Total | 15 | 100.0 |
77. Over the past three months, how have liquidity and functioning in the consumer ABS market changed?
| Number of Respondents | Percentage | |
|---|---|---|
| Improved Considerably | 0 | 0.0 |
| Improved Somewhat | 0 | 0.0 |
| Remained Basically Unchanged | 13 | 86.7 |
| Deteriorated Somewhat | 1 | 6.7 |
| Deteriorated Considerably | 1 | 6.7 |
| Total | 15 | 100.0 |
Mark and Collateral Disputes
78. Over the past three months, how has the volume of mark and collateral disputes relating to lending against each of the following collateral types changed?
- High-grade corporate bonds
Number of Respondents Percentage Increased Considerably 0 0.0 Increased Somewhat 2 9.5 Remained Basically Unchanged 19 90.5 Decreased Somewhat 0 0.0 Decreased Considerably 0 0.0 Total 21 100.0 - High-yield corporate bonds
Number of Respondents Percentage Increased Considerably 0 0.0 Increased Somewhat 2 10.5 Remained Basically Unchanged 17 89.5 Decreased Somewhat 0 0.0 Decreased Considerably 0 0.0 Total 19 100.0 - Equities
Number of Respondents Percentage Increased Considerably 0 0.0 Increased Somewhat 3 15.0 Remained Basically Unchanged 17 85.0 Decreased Somewhat 0 0.0 Decreased Considerably 0 0.0 Total 20 100.0 - Agency RMBS
Number of Respondents Percentage Increased Considerably 0 0.0 Increased Somewhat 2 9.5 Remained Basically Unchanged 19 90.5 Decreased Somewhat 0 0.0 Decreased Considerably 0 0.0 Total 21 100.0 - Non-agency RMBS
Number of Respondents Percentage Increased Considerably 0 0.0 Increased Somewhat 2 13.3 Remained Basically Unchanged 13 86.7 Decreased Somewhat 0 0.0 Decreased Considerably 0 0.0 Total 15 100.0 - CMBS
Number of Respondents Percentage Increased Considerably 0 0.0 Increased Somewhat 2 11.8 Remained Basically Unchanged 15 88.2 Decreased Somewhat 0 0.0 Decreased Considerably 0 0.0 Total 17 100.0 - Consumer ABS
Number of Respondents Percentage Increased Considerably 0 0.0 Increased Somewhat 2 15.4 Remained Basically Unchanged 11 84.6 Decreased Somewhat 0 0.0 Decreased Considerably 0 0.0 Total 13 100.0
79. Over the past three months, how has the duration and persistence of mark and collateral disputes relating to lending against each of the following collateral types changed?
- High-grade corporate bonds
Number of Respondents Percentage Increased Considerably 0 0.0 Increased Somewhat 1 4.8 Remained Basically Unchanged 20 95.2 Decreased Somewhat 0 0.0 Decreased Considerably 0 0.0 Total 21 100.0 - High-yield corporate bonds
Number of Respondents Percentage Increased Considerably 0 0.0 Increased Somewhat 1 5.3 Remained Basically Unchanged 18 94.7 Decreased Somewhat 0 0.0 Decreased Considerably 0 0.0 Total 19 100.0 - Equities
Number of Respondents Percentage Increased Considerably 0 0.0 Increased Somewhat 1 5.0 Remained Basically Unchanged 19 95.0 Decreased Somewhat 0 0.0 Decreased Considerably 0 0.0 Total 20 100.0 - Agency RMBS
Number of Respondents Percentage Increased Considerably 0 0.0 Increased Somewhat 1 4.8 Remained Basically Unchanged 20 95.2 Decreased Somewhat 0 0.0 Decreased Considerably 0 0.0 Total 21 100.0 - Non-agency RMBS
Number of Respondents Percentage Increased Considerably 0 0.0 Increased Somewhat 1 6.7 Remained Basically Unchanged 14 93.3 Decreased Somewhat 0 0.0 Decreased Considerably 0 0.0 Total 15 100.0 - CMBS
Number of Respondents Percentage Increased Considerably 0 0.0 Increased Somewhat 1 5.9 Remained Basically Unchanged 16 94.1 Decreased Somewhat 0 0.0 Decreased Considerably 0 0.0 Total 17 100.0 - Consumer ABS
Number of Respondents Percentage Increased Considerably 0 0.0 Increased Somewhat 1 7.7 Remained Basically Unchanged 12 92.3 Decreased Somewhat 0 0.0 Decreased Considerably 0 0.0 Total 13 100.0
Optional Question
Question 80 requests feedback on any other issues you judge to be important relating to credit terms applicable to securities financing transactions and OTC derivatives contracts.
80. Are there any other recent developments involving conditions and practices in any of the markets addressed in this survey or applicable to the counterparty types listed in this survey that you regard as particularly significant and which were not fully addressed in the prior questions? Your response will help us stay abreast of emerging issues and in choosing questions for future surveys. There is no need to reply to this question if there is nothing you wish to add.
| Number of Respondents | Percentage | |
|---|---|---|
| Free-Text Entry | 1 | 100.0 |
| Total | 1 | 100.0 |
Special Questions
The following questions ask about your assessment of liquidity changes in the U.S. Treasury and agency RMBS markets since the beginning of January 2022.1 Questions 81 to 83 explore changes in market liquidity in the on-the-run Treasury market, and questions 84 to 86 in the off-the-run Treasury market. Question 87 asks about risks to Treasury market liquidity going forward. Questions 88 to 91 explore liquidity in the to-be-announced (TBA) agency RMBS market.
Liquidity Conditions in the U.S. Treasury and Agency Residential Mortgage-Backed Securities Markets
81. Since January 2022, how has your assessment of the liquidity in the market for on-the-run U.S. Treasury securities changed?
| Number of Respondents | Percentage | |
|---|---|---|
| Improved Considerably | 0 | 0.0 |
| Improved Somewhat | 0 | 0.0 |
| Remained Basically Unchanged | 0 | 0.0 |
| Deteriorated Somewhat | 11 | 64.7 |
| Deteriorated Considerably | 6 | 35.3 |
| Total | 17 | 100.0 |
82. To the extent that liquidity in the market for on-the-run U.S. Treasury securities has improved or deteriorated since January 2022 (as reflected in your response to question 81), which liquidity indicators do you rely upon to make this assessment?
- Possible indicators of an improvement of liquidity conditions
- Depth of the limit order book
Number of Respondents Percentage Most Important 0 0.0 2nd Most Important 0 0.0 3rd Most Important 0 0.0 Total 0 0.0 - Price impact
Number of Respondents Percentage Most Important 0 0.0 2nd Most Important 0 0.0 3rd Most Important 0 0.0 Total 0 0.0 - Bid-ask spreads
Number of Respondents Percentage Most Important 0 0.0 2nd Most Important 0 0.0 3rd Most Important 0 0.0 Total 0 0.0 - Trade volumes
Number of Respondents Percentage Most Important 0 0.0 2nd Most Important 0 0.0 3rd Most Important 0 0.0 Total 0 0.0 - Ability to trade in size without delay
Number of Respondents Percentage Most Important 0 0.0 2nd Most Important 0 0.0 3rd Most Important 0 0.0 Total 0 0.0 - Qualitative assessment of trading conditions based on trading desk information
Number of Respondents Percentage Most Important 0 0.0 2nd Most Important 0 0.0 3rd Most Important 0 0.0 Total 0 0.0 - Other (please specify)
Number of Respondents Percentage Most Important 0 0.0 2nd Most Important 0 0.0 3rd Most Important 0 0.0 Total 0 0.0
- Depth of the limit order book
- Possible indicators of a deterioration of liquidity conditions
- Depth of the limit order book
Number of Respondents Percentage Most Important 7 63.6 2nd Most Important 4 36.4 3rd Most Important 0 0.0 Total 11 100.0 - Price impact
Number of Respondents Percentage Most Important 3 27.3 2nd Most Important 6 54.5 3rd Most Important 2 18.2 Total 11 100.0 - Bid-ask spreads
Number of Respondents Percentage Most Important 6 60.0 2nd Most Important 0 0.0 3rd Most Important 4 40.0 Total 10 100.0 - Trade volumes
Number of Respondents Percentage Most Important 0 0.0 2nd Most Important 2 100.0 3rd Most Important 0 0.0 Total 2 100.0 - Ability to trade in size without delay
Number of Respondents Percentage Most Important 0 0.0 2nd Most Important 2 33.3 3rd Most Important 4 66.7 Total 6 100.0 - Qualitative assessment of trading conditions based on trading desk information
Number of Respondents Percentage Most Important 1 20.0 2nd Most Important 1 20.0 3rd Most Important 3 60.0 Total 5 100.0 - Other (please specify)
Number of Respondents Percentage Most Important 0 0.0 2nd Most Important 1 33.3 3rd Most Important 2 66.7 Total 3 100.0
- Depth of the limit order book
83. To the extent that liquidity in the market for on-the-run U.S. Treasury securities has improved or deteriorated since January (as reflected in your response to question 81), how important has each of the following possible reasons been for your assessment?
- Possible reasons for an improvement
- Decreased interest rate volatility
Number of Respondents Percentage Very Important 0 0.0 Somewhat Important 0 0.0 Not Important 0 0.0 Total 0 0.0 - More balanced client order flow
Number of Respondents Percentage Very Important 0 0.0 Somewhat Important 0 0.0 Not Important 0 0.0 Total 0 0.0 - Improved financing conditions for market participants
Number of Respondents Percentage Very Important 0 0.0 Somewhat Important 0 0.0 Not Important 0 0.0 Total 0 0.0 - Increased availability of dealer balance sheets
Number of Respondents Percentage Very Important 0 0.0 Somewhat Important 0 0.0 Not Important 0 0.0 Total 0 0.0 - Treasury markets
Number of Respondents Percentage Very Important 0 0.0 Somewhat Important 0 0.0 Not Important 0 0.0 Total 0 0.0 - Increased willingness of proprietary trading firms (PTFs) to provide liquidity
Number of Respondents Percentage Very Important 0 0.0 Somewhat Important 0 0.0 Not Important 0 0.0 Total 0 0.0 - Low Treasury issuance net of System Open Market Account (SOMA) purchases
Number of Respondents Percentage Very Important 0 0.0 Somewhat Important 0 0.0 Not Important 0 0.0 Total 0 0.0 - Other (please specify)
Number of Respondents Percentage Very Important 0 0.0 Somewhat Important 0 0.0 Not Important 0 0.0 Total 0 0.0
- Decreased interest rate volatility
- Possible reasons for a deterioration
- Increased interest rate volatility
Number of Respondents Percentage Very Important 14 82.4 Somewhat Important 3 17.6 Not Important 0 0.0 Total 17 100.0 - More unbalanced client order flow
Number of Respondents Percentage Very Important 4 23.5 Somewhat Important 11 64.7 Not Important 2 11.8 Total 17 100.0 - Weaker financing conditions for market participants
Number of Respondents Percentage Very Important 1 5.9 Somewhat Important 6 35.3 Not Important 10 58.8 Total 17 100.0 - Diminished availability of dealer balance sheets
Number of Respondents Percentage Very Important 3 17.6 Somewhat Important 10 58.8 Not Important 4 23.5 Total 17 100.0 - Treasury markets
Number of Respondents Percentage Very Important 4 23.5 Somewhat Important 9 52.9 Not Important 4 23.5 Total 17 100.0 - Reduced willingness of proprietary trading firms (PTFs) to provide liquidity
Number of Respondents Percentage Very Important 4 23.5 Somewhat Important 9 52.9 Not Important 4 23.5 Total 17 100.0 - Elevated Treasury issuance net of System Open Market Account (SOMA) purchases
Number of Respondents Percentage Very Important 1 5.9 Somewhat Important 10 58.8 Not Important 6 35.3 Total 17 100.0 - Other (please specify)
Number of Respondents Percentage Very Important 0 0.0 Somewhat Important 0 0.0 Not Important 2 100.0 Total 2 100.0
- Increased interest rate volatility
84. Since January 2022, how has your assessment of the liquidity in the market for off-the-run U.S. Treasury securities changed?
| Number of Respondents | Percentage | |
|---|---|---|
| Improved Considerably | 0 | 0.0 |
| Improved Somewhat | 0 | 0.0 |
| Remained Basically Unchanged | 5 | 22.7 |
| Deteriorated Somewhat | 9 | 40.9 |
| Deteriorated Considerably | 8 | 36.4 |
| Total | 22 | 100.0 |
85. To the extent that liquidity in the market for off-the-run U.S. Treasury securities has improved or deteriorated since January 2022 (as reflected in your response to question 84), which liquidity indicators do you rely upon to make this assessment?
- Possible indicators of an improvement of liquidity conditions
- Dealer quoting activity
Number of Respondents Percentage Most Important 0 0.0 2nd Most Important 0 0.0 3rd Most Important 0 0.0 Total 0 0.0 - Price impact
Number of Respondents Percentage Most Important 0 0.0 2nd Most Important 0 0.0 3rd Most Important 0 0.0 Total 0 0.0 - Bid-ask spreads
Number of Respondents Percentage Most Important 0 0.0 2nd Most Important 0 0.0 3rd Most Important 0 0.0 Total 0 0.0 - Trade volumes
Number of Respondents Percentage Most Important 0 0.0 2nd Most Important 0 0.0 3rd Most Important 0 0.0 Total 0 0.0 - Ability to trade in size without delay
Number of Respondents Percentage Most Important 0 0.0 2nd Most Important 0 0.0 3rd Most Important 0 0.0 Total 0 0.0 - Qualitative assessment of trading conditions based on trading desk information
Number of Respondents Percentage Most Important 0 0.0 2nd Most Important 0 0.0 3rd Most Important 0 0.0 Total 0 0.0 - Other (please specify)
Number of Respondents Percentage Most Important 0 0.0 2nd Most Important 0 0.0 3rd Most Important 0 0.0 Total 0 0.0
- Dealer quoting activity
- Possible indicators of a deterioration of liquidity conditions
- Dealer quoting activity
Number of Respondents Percentage Most Important 2 33.3 2nd Most Important 1 16.7 3rd Most Important 3 50.0 Total 6 100.0 - Price impact
Number of Respondents Percentage Most Important 7 50.0 2nd Most Important 4 28.6 3rd Most Important 3 21.4 Total 14 100.0 - Bid-ask spreads
Number of Respondents Percentage Most Important 6 50.0 2nd Most Important 4 33.3 3rd Most Important 2 16.7 Total 12 100.0 - Trade volumes
Number of Respondents Percentage Most Important 0 0.0 2nd Most Important 5 100.0 3rd Most Important 0 0.0 Total 5 100.0 - Ability to trade in size without delay
Number of Respondents Percentage Most Important 1 25.0 2nd Most Important 1 25.0 3rd Most Important 2 50.0 Total 4 100.0 - Qualitative assessment of trading conditions based on trading desk information
Number of Respondents Percentage Most Important 1 25.0 2nd Most Important 0 0.0 3rd Most Important 3 75.0 Total 4 100.0 - Other (please specify)
Number of Respondents Percentage Most Important 0 0.0 2nd Most Important 0 0.0 3rd Most Important 0 0.0 Total 0 0.0
- Dealer quoting activity
86. To the extent that liquidity in the market for off-the-run U.S. Treasury securities has improved or deteriorated since January (as reflected in your response to question 84), how important has each of the following possible reasons been for your assessment?
- Possible reasons for an improvement
- Decreased interest rate volatility
Number of Respondents Percentage Very Important 0 0.0 Somewhat Important 0 0.0 Not Important 0 0.0 Total 0 0.0 - More balanced client order flow
Number of Respondents Percentage Very Important 0 0.0 Somewhat Important 0 0.0 Not Important 0 0.0 Total 0 0.0 - Improved financing conditions for market participants
Number of Respondents Percentage Very Important 0 0.0 Somewhat Important 0 0.0 Not Important 0 0.0 Total 0 0.0 - Increased availability of dealer balance sheets
Number of Respondents Percentage Very Important 0 0.0 Somewhat Important 0 0.0 Not Important 0 0.0 Total 0 0.0 - Treasury markets
Number of Respondents Percentage Very Important 0 0.0 Somewhat Important 0 0.0 Not Important 0 0.0 Total 0 0.0 - Low Treasury issuance net of SOMA purchases
Number of Respondents Percentage Very Important 0 0.0 Somewhat Important 0 0.0 Not Important 0 0.0 Total 0 0.0 - Other (please specify)
Number of Respondents Percentage Very Important 0 0.0 Somewhat Important 0 0.0 Not Important 0 0.0 Total 0 0.0
- Decreased interest rate volatility
- Possible reasons for a deterioration
- Increased interest rate volatility
Number of Respondents Percentage Very Important 14 82.4 Somewhat Important 3 17.6 Not Important 0 0.0 Total 17 100.0 - More unbalanced client order flow
Number of Respondents Percentage Very Important 9 52.9 Somewhat Important 7 41.2 Not Important 1 5.9 Total 17 100.0 - Weaker financing conditions for market participants
Number of Respondents Percentage Very Important 2 11.8 Somewhat Important 7 41.2 Not Important 8 47.1 Total 17 100.0 - Diminished availability of dealer balance sheets
Number of Respondents Percentage Very Important 7 41.2 Somewhat Important 7 41.2 Not Important 3 17.6 Total 17 100.0 - Treasury markets
Number of Respondents Percentage Very Important 6 35.3 Somewhat Important 7 41.2 Not Important 4 23.5 Total 17 100.0 - Elevated Treasury issuance net of SOMA purchases
Number of Respondents Percentage Very Important 1 5.9 Somewhat Important 11 64.7 Not Important 5 29.4 Total 17 100.0 - Other (please specify)
Number of Respondents Percentage Very Important 0 0.0 Somewhat Important 0 0.0 Not Important 2 100.0 Total 2 100.0
- Increased interest rate volatility
87. Looking ahead, what do you see as the main risks to Treasury market liquidity over the remainder of 2022? (Please select no more than three risks, indicating the most important by selecting the radio button in the first column, the next most important by selecting the radio button in the second column, and so on.)
- High Treasury issuance
Number of Respondents Percentage Most Important 1 25.0 2nd Most Important 2 50.0 3rd Most Important 1 25.0 Total 4 100.0 - Federal Reserve's balance sheet reductions
Number of Respondents Percentage Most Important 10 62.5 2nd Most Important 4 25.0 3rd Most Important 2 12.5 Total 16 100.0 - Elevated interest rate volatility
Number of Respondents Percentage Most Important 8 36.4 2nd Most Important 10 45.5 3rd Most Important 4 18.2 Total 22 100.0 - Deterioration in financing conditions
Number of Respondents Percentage Most Important 1 20.0 2nd Most Important 1 20.0 3rd Most Important 3 60.0 Total 5 100.0 - Reduced willingness of dealers to intermediate UST markets
Number of Respondents Percentage Most Important 1 14.3 2nd Most Important 1 14.3 3rd Most Important 5 71.4 Total 7 100.0 - Diminished availability of dealer balance sheets
Number of Respondents Percentage Most Important 1 25.0 2nd Most Important 1 25.0 3rd Most Important 2 50.0 Total 4 100.0 - Reduced willingness of PTFs to provide liquidity
Number of Respondents Percentage Most Important 0 0.0 2nd Most Important 2 66.7 3rd Most Important 1 33.3 Total 3 100.0 - Other (please specify)
Number of Respondents Percentage Most Important 0 0.0 2nd Most Important 0 0.0 3rd Most Important 0 0.0 Total 0 0.0
88. Since January 2022, how has your assessment of the liquidity in the market for TBA agency RMBS changed?
| Number of Respondents | Percentage | |
|---|---|---|
| Improved Considerably | 0 | 0.0 |
| Improved Somewhat | 0 | 0.0 |
| Remained Basically Unchanged | 7 | 43.8 |
| Deteriorated Somewhat | 6 | 37.5 |
| Deteriorated Considerably | 3 | 18.8 |
| Total | 16 | 100.0 |
89. To the extent that liquidity in the market for TBA agency RMBS has improved or deteriorated since January 2022 (as reflected in your response to question 88), which liquidity indicators did you use to make this assessment?
- Possible indicators of an improvement of liquidity conditions
- Dealer quoting activity
Number of Respondents Percentage Most Important 0 0.0 2nd Most Important 0 0.0 3rd Most Important 0 0.0 Total 0 0.0 - Price impact
Number of Respondents Percentage Most Important 0 0.0 2nd Most Important 0 0.0 3rd Most Important 0 0.0 Total 0 0.0 - Bid-ask spreads
Number of Respondents Percentage Most Important 0 0.0 2nd Most Important 0 0.0 3rd Most Important 0 0.0 Total 0 0.0 - Trade volumes
Number of Respondents Percentage Most Important 0 0.0 2nd Most Important 0 0.0 3rd Most Important 0 0.0 Total 0 0.0 - Ability to trade in size without delay
Number of Respondents Percentage Most Important 0 0.0 2nd Most Important 0 0.0 3rd Most Important 0 0.0 Total 0 0.0 - Qualitative assessment of trading conditions based on trading desk information
Number of Respondents Percentage Most Important 0 0.0 2nd Most Important 0 0.0 3rd Most Important 0 0.0 Total 0 0.0 - Other (please specify)
Number of Respondents Percentage Most Important 0 0.0 2nd Most Important 0 0.0 3rd Most Important 0 0.0 Total 0 0.0
- Dealer quoting activity
- Possible indicators of a deterioration of liquidity conditions
- Dealer quoting activity
Number of Respondents Percentage Most Important 1 100.0 2nd Most Important 0 0.0 3rd Most Important 0 0.0 Total 1 100.0 - Price impact
Number of Respondents Percentage Most Important 4 57.1 2nd Most Important 2 28.6 3rd Most Important 1 14.3 Total 7 100.0 - Bid-ask spreads
Number of Respondents Percentage Most Important 2 28.6 2nd Most Important 4 57.1 3rd Most Important 1 14.3 Total 7 100.0 - Trade volumes
Number of Respondents Percentage Most Important 1 33.3 2nd Most Important 1 33.3 3rd Most Important 1 33.3 Total 3 100.0 - Ability to trade in size without delay
Number of Respondents Percentage Most Important 0 0.0 2nd Most Important 0 0.0 3rd Most Important 3 100.0 Total 3 100.0 - Qualitative assessment of trading conditions based on trading desk information
Number of Respondents Percentage Most Important 1 25.0 2nd Most Important 1 25.0 3rd Most Important 2 50.0 Total 4 100.0 - Other (please specify)
Number of Respondents Percentage Most Important 0 0.0 2nd Most Important 1 100.0 3rd Most Important 0 0.0 Total 1 100.0
- Dealer quoting activity
90. To the extent that liquidity in the market for TBA agency RMBS has improved or deteriorated since January (as reflected in your responses to questions 88), how important has been each of the following possible reasons been for your assessment?
- Possible reasons for an improvement
- Decreased interest rate volatility
Number of Respondents Percentage Very Important 0 0.0 Somewhat Important 0 0.0 Not Important 0 0.0 Total 0 0.0 - More balanced client order flow
Number of Respondents Percentage Very Important 0 0.0 Somewhat Important 0 0.0 Not Important 0 0.0 Total 0 0.0 - Improved financing conditions for market participants
Number of Respondents Percentage Very Important 0 0.0 Somewhat Important 0 0.0 Not Important 0 0.0 Total 0 0.0 - Increased availability of dealer balance sheets
Number of Respondents Percentage Very Important 0 0.0 Somewhat Important 0 0.0 Not Important 0 0.0 Total 0 0.0 - Increased willingness of dealers to take risk in agency RMBS markets
Number of Respondents Percentage Very Important 0 0.0 Somewhat Important 0 0.0 Not Important 0 0.0 Total 0 0.0 - Low agency RMBS issuance net of SOMA purchases
Number of Respondents Percentage Very Important 0 0.0 Somewhat Important 0 0.0 Not Important 0 0.0 Total 0 0.0 - Other (please specify)
Number of Respondents Percentage Very Important 0 0.0 Somewhat Important 0 0.0 Not Important 0 0.0 Total 0 0.0
- Decreased interest rate volatility
- Possible reasons for a deterioration
- Increased interest rate volatility
Number of Respondents Percentage Very Important 8 88.9 Somewhat Important 1 11.1 Not Important 0 0.0 Total 9 100.0 - More unbalanced client order flow
Number of Respondents Percentage Very Important 4 44.4 Somewhat Important 2 22.2 Not Important 3 33.3 Total 9 100.0 - Weaker financing conditions for market participants
Number of Respondents Percentage Very Important 0 0.0 Somewhat Important 2 22.2 Not Important 7 77.8 Total 9 100.0 - Diminished availability of dealer balance sheets
Number of Respondents Percentage Very Important 0 0.0 Somewhat Important 6 66.7 Not Important 3 33.3 Total 9 100.0 - Reduced willingness of dealers to take risk in agency RMBS markets
Number of Respondents Percentage Very Important 0 0.0 Somewhat Important 9 100.0 Not Important 0 0.0 Total 9 100.0 - Elevated RMBS issuance net of SOMA purchases
Number of Respondents Percentage Very Important 0 0.0 Somewhat Important 3 33.3 Not Important 6 66.7 Total 9 100.0 - Other (please specify)
Number of Respondents Percentage Very Important 3 75.0 Somewhat Important 1 25.0 Not Important 0 0.0 Total 4 100.0
- Increased interest rate volatility
91. Looking ahead, what do you see as the main risks to agency RMBS market liquidity over the remainder of 2022? (Please select no more than three risks, indicating the most important by selecting the radio button in the first column, the next most important by selecting the radio button in the second column, and so on.)
- High agency RMBS issuance
Number of Respondents Percentage Most Important 1 100.0 2nd Most Important 0 0.0 3rd Most Important 0 0.0 Total 1 100.0 - Federal Reserve's balance sheet reductions
Number of Respondents Percentage Most Important 5 38.5 2nd Most Important 7 53.8 3rd Most Important 1 7.7 Total 13 100.0 - Elevated interest rate volatility
Number of Respondents Percentage Most Important 9 60.0 2nd Most Important 4 26.7 3rd Most Important 2 13.3 Total 15 100.0 - Deterioration in financing conditions
Number of Respondents Percentage Most Important 2 25.0 2nd Most Important 2 25.0 3rd Most Important 4 50.0 Total 8 100.0 - Reduced willingness of dealers to intermediate RMBS markets
Number of Respondents Percentage Most Important 0 0.0 2nd Most Important 1 50.0 3rd Most Important 1 50.0 Total 2 100.0 - Diminished availability of dealer balance sheets
Number of Respondents Percentage Most Important 1 25.0 2nd Most Important 1 25.0 3rd Most Important 2 50.0 Total 4 100.0 - Other (please specify)
Number of Respondents Percentage Most Important 2 66.7 2nd Most Important 1 33.3 3rd Most Important 0 0.0 Total 3 100.0