FEDS Notes
October 11, 2024
A Better Way of Understanding the US Consumer: Decomposing Retail Spending by Household Income
Sinem Hacıoğlu Hoke, Leo Feler, and Jack Chylak*
Changes in retail spending reflect changes in consumer demand for goods. For the past several months, retail sales estimates published by the Census Bureau have indicated that consumer demand for retail goods remains resilient. However, published measures do not provide details on which consumers' spending has remained resilient. Using a detailed micro dataset, we construct a measure of average retail spending for low-, middle- and high-income households. Our measure of spending by income shows that middle- and high-income households have been fueling the strong demand for retail goods in the economy while low-income households' spending has been stable in the post-pandemic period. We also show the heterogeneity in spending by education, generation, and housing status.
The current understanding of retail spending
Every month, the Census Bureau publishes the Advance Monthly Sales for Retail and Food Services report (MARTS) to provide an estimate of retail and food services sales.1 Economists and financial markets track the results of this report as one of the indicators of the state of the US consumer.
To prepare the MARTS report, the Census Bureau collects the dollar value of sales directly from retailers by fielding establishment-level surveys and estimating total sales and sales by relevant 3-digit NAICS categories. Due to survey design, with establishments reporting monthly sales rather than consumers reporting monthly spending, there is no way to decompose retail sales into purchases by households of different demographic groups.
Figure 1 shows retail sales excluding motor vehicles and parts since 2015, indexed to 100 in 2019 for ease of interpretation.2 In the post-pandemic period, nominal retail sales (shown in blue) increased at a faster pace. Nominal retail sales are not adjusted for price changes, so while pent-up demand, Covid-era fiscal stimulus, and excess savings all boosted sales, higher prices also contributed to the increase.
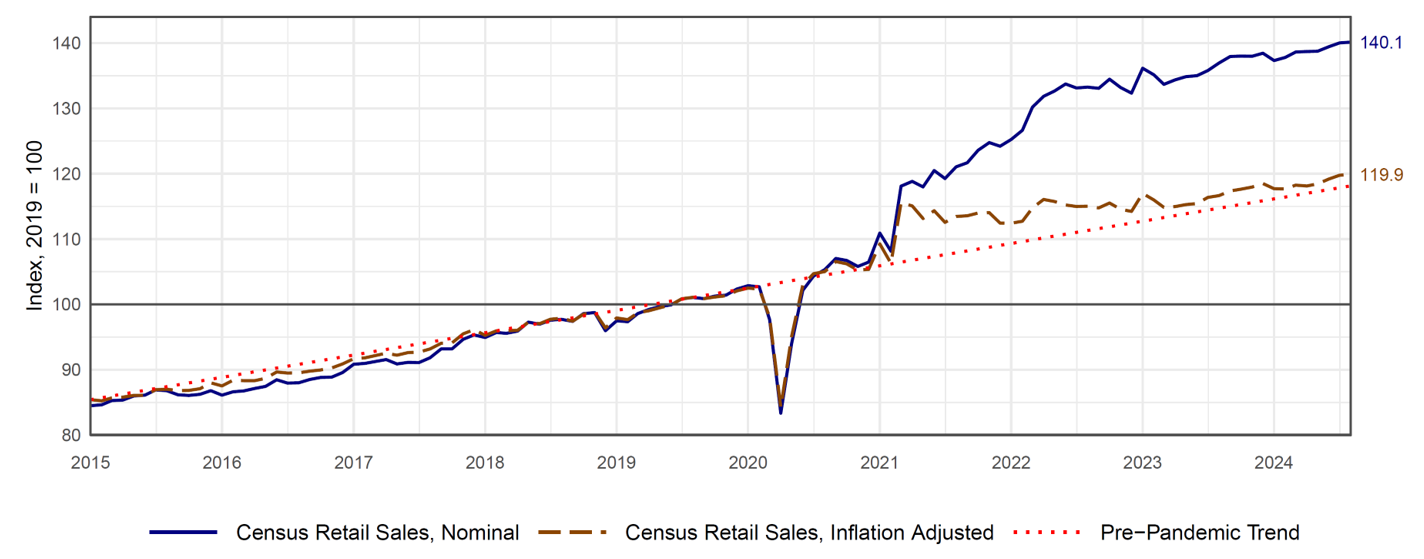
Note: Retail sales in solid blue line, retail sales adjusted for inflation in dashed orange line, and pre-pandemic trend for retail sales adjusted for inflation in dotted red line. Inflation adjustment uses the chain indexed PCE deflator for goods and food services excluding motor vehicles. The data are monthly from January 2015 through August 2024. Values are indexed to 100 in 2019.
Source: FRED, retail sales series code: RSFSXMV. PCE deflator used to inflation-adjust is based on authors' calculation.
To account for price changes and obtain a clearer picture of the real increase in retail sales, the orange dashed line shows retail sales adjusted for inflation. There was a jump in inflation-adjusted retail sales in March 2021 following the roll-out of vaccines, the pandemic re-opening, and the last fiscal stimulus program. Since then, inflation-adjusted retail spending has grown more slowly and is almost back to its pre-pandemic trend (shown in red).
A micro dataset to address a macro question: constructing a retail spending measure for different income groups
To understand retail sales from the bottom-up – looking at household spending rather than retailers' sales – we use data from a panel of 150,000 representative US households from Numerator, a consumer data company.3 The Numerator panel data are collected at the household level. The data include survey information on household income, age, education, zip code, household size, race/ethnicity, and various other measures. The data also include information on households' purchases from paper receipts, online receipts, and transaction records.4 The purchase information contains the quantity and price of each item purchased, the overall total on the receipt, and where and when the purchase took place. These details allow us to classify households' spending into the relevant 3-digit NAICS categories and aggregate them into a monthly total retail spending measure just as in the Census MARTS report. Moreover, we can investigate how spending differs between low, middle, and high-income households.
First, we establish the reliability of Numerator's retail spending measure. Figure 2 plots three lines, all seasonally-adjusted and inflation-adjusted, starting in 2018.5 The solid red line indicates the Census Bureau's official seasonally-adjusted measure for total retail sales excluding motor vehicles and parts, which we then inflation-adjust using the chain indexed PCE deflator for goods and food services excluding motor vehicles. The dashed blue line is the retail spending measure we construct from Numerator data, which we seasonally-adjust using the Census Bureau's X13-ARIMA-SEATS package and inflation-adjust as described previously.6 The dashed gray line is the non-seasonally adjusted Census series that we then seasonally-adjust and inflation-adjust using the same methodology we use for Numerator data. The purpose of the gray line is to show that our seasonal adjustment methodology closely aligns with the Census Bureau's methodology.7
Figure 2. Retail sales, total excluding motor vehicles and parts constructed using Census Bureau estimates and Numerator panel data (seasonally-adjusted and inflation-adjusted)
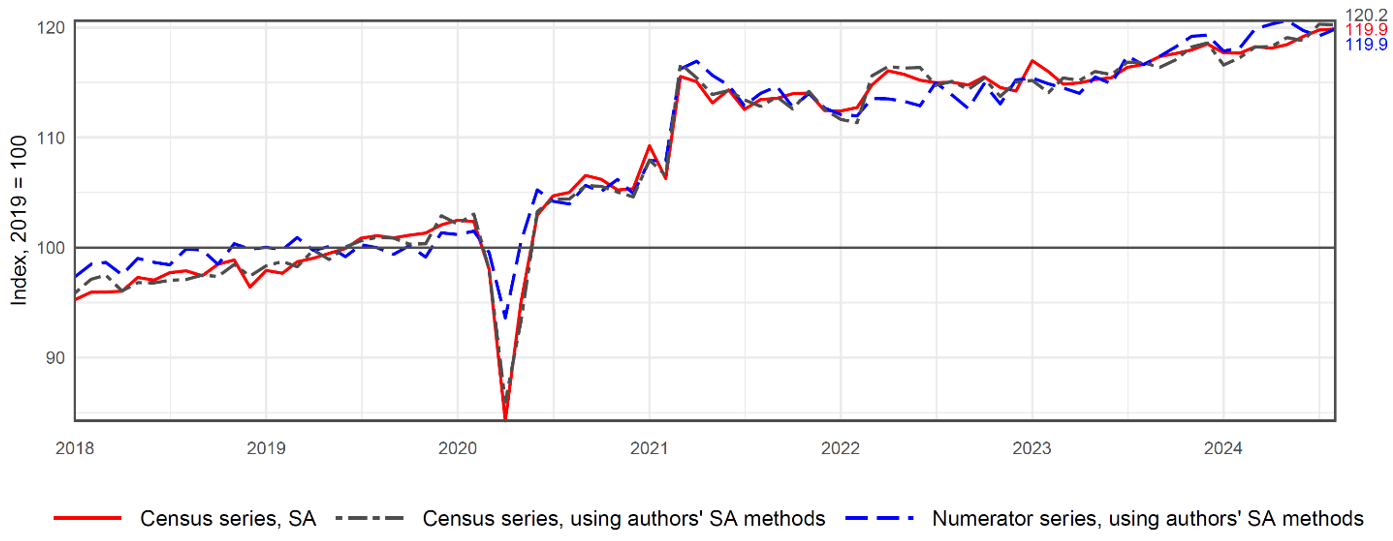
Note: The solid red line is the Census Bureau's seasonally-adjusted retail sales series excluding motor vehicles and parts. The dashed blue line is the retail spending measure we construct from the Numerator data, which we seasonally adjust. The dashed gray line is the non-seasonally adjusted Census series that we then seasonally adjust. The data are monthly from January 2018 through August 2024. Authors' seasonal adjustment method uses X13-ARIMA-SEATS. Inflation adjustment uses the chain indexed PCE deflator for goods and food services excluding motor vehicles. All three lines are indexed to 100 in 2019.
Source: Census Bureau and Numerator. PCE deflator used to inflation-adjust is based on authors' calculation.
The correlation between the Numerator series and the Census Bureau's official seasonally-adjusted retail sales series is 0.94 in levels and 0.83 when looking at monthly percent changes. Figure 2 allows us to verify that the bottom-up construction of the Numerator data, captured from household purchases, closely matches the top-down construction of the Census Bureau's retail sales series, captured from surveys of retail and food service establishments.8
Decomposing retail spending by household income
Having established that the aggregated Numerator retail spending series closely matches the Census Bureau's retail sales series, we now examine spending patterns based on household income using the Numerator series.
Figure 3 plots growth since January 2018 in average monthly household spending, adjusted for inflation and seasonality, overall and by three income groups:
- overall, shown in red,
- for low-income households ($0-$60K in annual household income), shown in purple,
- for middle-income households ($60K-$100K), shown in gray,
- and for high-income households ($100K+), shown in green.
Figure 3. Growth of average retail spending overall and decomposed by household income (seasonally-adjusted and inflation-adjusted)
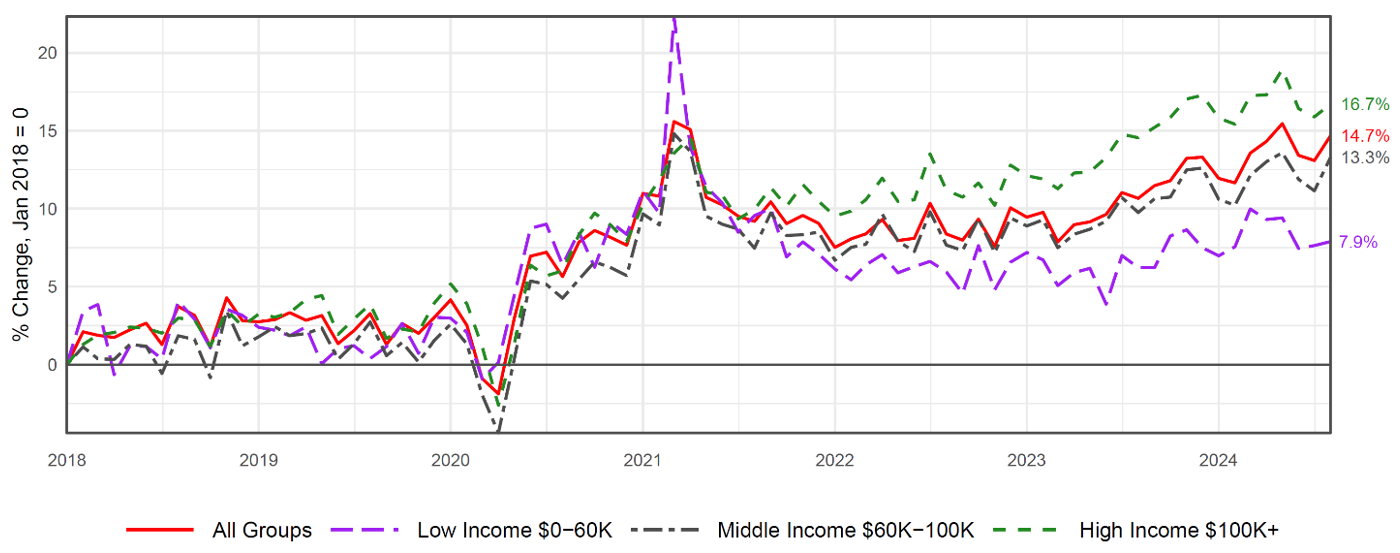
Note: The data are monthly from January 2018 through August 2024. All series are adjusted for inflation using the chain indexed PCE deflator for goods and food services excluding motor vehicles and are shown as growth relative to January 2018. All series are seasonally adjusted using X13-ARIMA-SEATS.
Source: Based on authors' calculations using Numerator data.
A few observations stand out in Figure 3:
- The growth in average household retail spending is similar across all income groups in the pre-pandemic era. Following the decline at the beginning of the pandemic, average household spending for all income groups, adjusted for inflation and seasonality, is now higher than before the pandemic.
- Low-income households appear to benefit more from pandemic-era stimulus. In percentage terms, low-income households increase their spending by more than middle and high-income households in 2020 and early 2021. The large jump in the average spending of low-income households in early 2021 coincides with the last stimulus program.
- The spending behavior of low, middle, and high-income households begins to diverge in mid-2021. Between mid-2021 and mid-2023, middle and high-income households maintain or increase their real average spending; low-income households reduce their real average spending compared with mid-2021 levels.
- Since mid-2023, low, middle, and high-income households have all been increasing their real average spending.
- As of August 2024, real average spending by low-income households is up 7.9% relative to January 2018, real average spending by middle-income households is up 13.3%, and real average spending by high-income households is up 16.7%.9
- Overall average retail spending (shown in red) better captures the spending behavior of middle- and high-income households than it does low-income households. While the overall average suggests consumers have remained resilient, similar to the narrative one obtains when looking at the Census Bureau's Advance Monthly Sales for Retail and Food Services reports, our decomposition suggests consumer resilience has been driven by middle- and high-income households, while low-income households have pulled back since mid-2021 through mid-2023 and only recently recovered to their mid-2021 levels of real average retail spending.
Additional results: decomposing retail spending by education, generation, and housing status
In addition to decomposing retail spending by household income, we can decompose retail spending by education, generation, and housing status.
Education
In Figure 4, we show average household retail spending by education. Education is based on the self-reported level of education of the primary shopper of a household in Numerator panel data. One benefit of decomposing retail sales by education rather than income is that education remains broadly stable between 2018 and today, whereas household incomes increase with inflation. The stability of the education groups over time allows us to check whether our results based on household income might have just been driven by compositional changes in income groups (e.g., if more households become high-income over time and fewer households remain low-income, that affects the composition of households in each income group and their average monthly retail spending). Our results for education are broadly similar to our results for household income, with households with lower education levels (high school completed or less) experiencing a pullback in real average household spending on retail goods and food services between mid-2021 and mid-2023, similar to households with lower income levels, while households with middle and higher education levels (some college or undergraduate degree and some graduate school or graduate degree) showing resilience and sustaining higher levels of retail spending on goods and food services since mid-2021.
Figure 4. Growth of average retail spending overall and decomposed by education (seasonally-adjusted and inflation-adjusted)
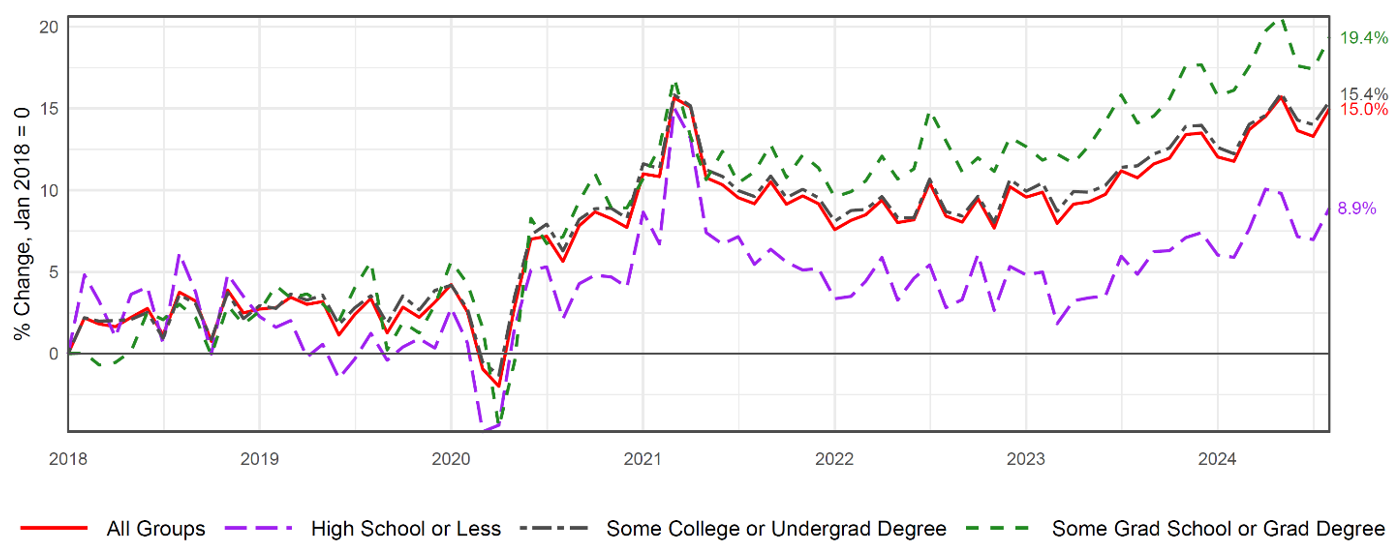
Note: The data are monthly from January 2018 through August 2024. All series are adjusted for inflation using the chain indexed PCE deflator for goods and food services excluding motor vehicles and are shown as growth relative to January 2018. All series are seasonally adjusted using X13-ARIMA-SEATS.
Source: Based on authors' calculations using Numerator data.
Generation
In Figure 5, we show average household retail spending by generation. Generation is based on the self-reported birth year of the primary shopper of a household in Numerator panel data. When decomposing average household spending by generation, we observe the following:
- Boomers (shown in purple) cut back the most at the onset of the pandemic. This makes sense considering older cohorts experienced higher mortality rates and may have wanted to limit their exposure by reducing in-person shopping more than younger cohorts.
- Boomers have increased their real retail spending the least relative to 2018 levels while Millennials (shown in green) have increased their spending the most. Again, these differences make sense considering the surge of retirements among Boomers at the onset of the pandemic and the fact that Boomers are increasingly on fixed-incomes. In contrast, Millennials are aging into their peak earning and spending years and have been able to benefit more from the strong labor market.
Figure 5. Growth of average retail spending overall and decomposed by generation (seasonally-adjusted and inflation-adjusted)
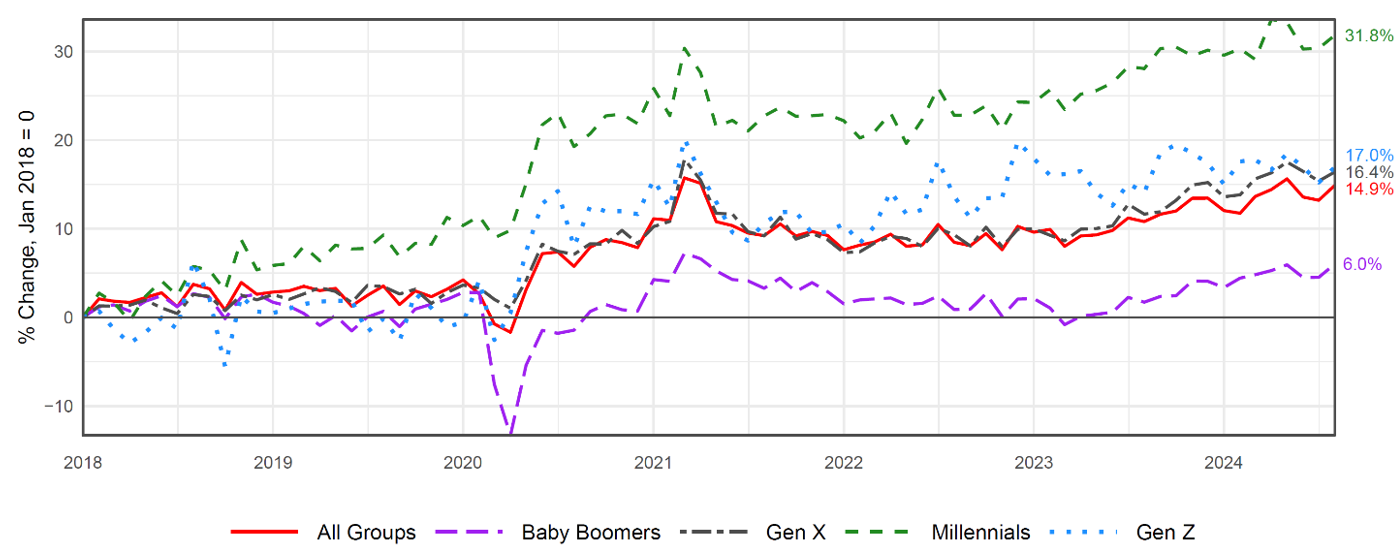
Note: The data are monthly from January 2018 through August 2024. All series are adjusted for inflation using the chain indexed PCE deflator for goods and food services excluding motor vehicles and are shown as growth relative to January 2018. All series are seasonally adjusted using X13-ARIMA-SEATS.
Source: Based on authors' calculations using Numerator data.
Housing Status
The Numerator data contain several different household attributes we could use to decompose retail spending.10 For this note, as a final result, we focus on housing status to test a hypothesis that households with the opportunity to lock-in low fixed-rate mortgages before 2022 have been better able to sustain higher retail spending.
In Figure 6, we show average household retail spending by whether households have owned their current homes since 2021 or prior ("long own"), whether households have only recently owned their current homes since 2022 to the present ("recent own"), and whether households are renters ("rent"). We observe households who are renters experienced the largest increase in retail spending at the onset of the pandemic. This makes sense considering renters tend to be lower-income, and as with low-income households shown in Figure 3, stimulus and support payments at the onset of the pandemic represented a greater percentage increase in both their incomes and spending. Households that are long-term owners had the opportunity to lock-in low fixed-rate mortgages in 2020 and 2021, allowing them to save on monthly housing payments and have more disposable income to sustain higher retail spending on goods and food services. Lastly, we see that those households that became homeowners since 2022 or more recently may exhibit self-selection. Those who can afford the higher monthly payments associated with higher mortgage rates and higher home prices are those who were able to maintain higher average real spending on retail goods and food services since mid-2021. However, real retail spending for these recent-owner households has been declining since mid-2022 to the present, which corresponds to the time when they purchased their homes, whereas spending has been increasing for other groups.
Figure 6. Growth of average retail spending overall and decomposed by housing status (seasonally-adjusted and inflation-adjusted)
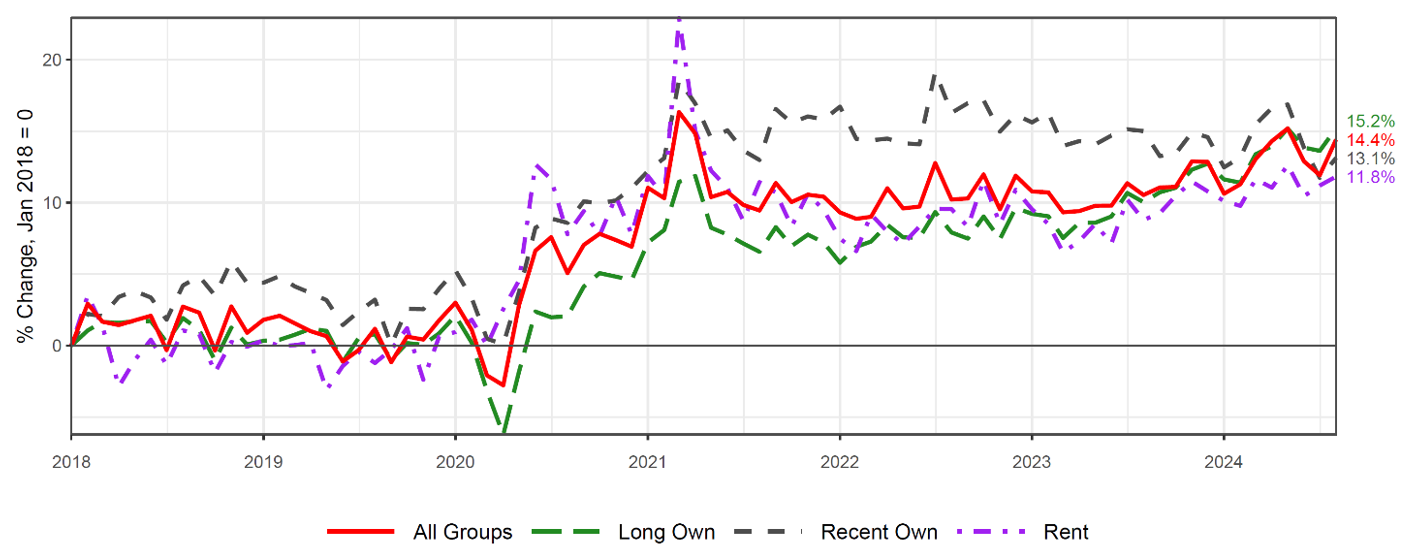
Note: The data are monthly from January 2018 through August 2024. All series are adjusted for inflation using the chain indexed PCE deflator for goods and food services excluding motor vehicles and are shown as growth relative to January 2018. All series are seasonally adjusted using X13-ARIMA-SEATS. "Long own" are households who own their current homes and have lived in their current homes since 2021 or prior, "recent own" are households who own their current homes and have lived in their current homes since 2022 or more recently, and "rent" are households who rent their current homes.
Source: Based on authors' calculations using Numerator data.
Discussion
The purpose of this note is to demonstrate a better way of understanding consumer spending on retail goods and food services by decomposing spending based on various household attributes such as income, education, generation, and housing status.
While our analysis does not offer evidence for the differences in the spending we observe for low-, middle-, and high-income households, we offer a few hypotheses for why these differences have emerged:
- Low-income households depleted pandemic-era excess savings earlier as documented by Abdelrahman, Oliveira, and Shapiro (2024).
- Government support programs such as SNAP emergency allotments, enhanced unemployment insurance, and enhanced child tax credits that disproportionately benefited low-income households expired and no longer provide a boost to these households' spending.
- High-income households might experience a wealth effect as their homes and investments increase in value, while they also receive more interest and investment income during periods of higher interest rates, all providing a stimulus for sustained levels of spending.
Our analysis and inflation adjustment likely undercounts the extent to which low-income households experienced inflation. Cavallo and Kryvtsov (2024) document that the prices of products low-income households tend to purchase increased at a faster pace. If there is heterogeneity in households' inflation experience, with low-income households experiencing higher inflation, low-income households' spending after the appropriate inflation adjustment would be lower than what our analysis has shown.
References
Cavallo, Alberto and Oleksiy Kryvtsov (2024). "Price Discounts and Cheapflation During the Post-Pandemic Inflation Surge," Journal of Monetary Economics.
Hamza, Abdelrahman, Luiz Edgard Oliveira, and Adam Shapiro (2024). "Pandemic-Era Liquid Wealth Is Running Dry," Federal Reserve Bank of San Francisco Economic Letter.
* The analysis and conclusions set forth are those of the authors and do not indicate concurrence by other members of the research staff or the Board of Governors of the Federal Reserve System. The use of commercially provided data here is for research purposes only and does not imply endorsement, recommendation, or favoring of any brand, product, service, or company by the Board of Governors or the Federal Reserve System. Return to text
1. According to the Census Bureau: "MARTS covers firms classified in the Retail Trade and Food Services sectors as defined by the North American Industry Classification System (NAICS). Retail Trade, as defined by NAICS sectors 44-45, includes establishments engaged in selling merchandise in small quantities to the general public, without transformation, and rendering services incidental to the sale of merchandise." Food and drinking services to final consumers, subsector 722, is also included in the survey. More information on how the data are collected is available at https://www.census.gov/retail/how_surveys_are_collected.html. Return to text
2. Throughout this note, we focus on retail sales excluding motor vehicles and parts. The micro data we use do not have information on sales of motor vehicles and parts. Therefore, any reference to and comparison of retail sales in this note corresponds to retail sales excluding motor vehicles and parts. Similarly, our analysis of retail spending does not cover broader spending on services included in the measurement of personal consumption expenditures. Return to text
3. The data contain 150,000 users who self-identify as the primary shopper of the household and whose transactions are continuous and complete for a period of at least 12 months. Numerator selects these 150,000 users from over 1 million users in a way that is demographically and nationally representative. Numerator then weights and balances households to ensure a match with Census demographic data and to ensure households' detailed purchases, when summed by retailer or by manufacturer, align with quarterly earnings reports of major retailers and consumer packaged goods manufacturers. Return to text
4. Numerator collects data from households in several ways. Using a mobile phone app called "Receipt Hog", consumers can (1) snap and upload a picture of their paper receipts, (2) allow Numerator to scrape their emails for digital receipts, and (3) link loyalty and membership accounts (such as Amazon, UberEats, Walmart, and Home Depot accounts), which Numerator then scrapes for transaction information. Panelists are rewarded with coins redeemable for Amazon or Visa gift cards or for cash through PayPal. On average, Numerator rewards panelists approximately $10 per month for providing their purchase information and completing surveys. Return to text
5. The Numerator series is available for academic research from 2018 onwards. Return to text
6. In addition, due to a change in Numerator's methodology starting in April 2021, we apply a fixed level-correction to the Numerator series for April 2021 and onwards. This level-correction is equivalent to a fixed-effect that accounts for the change in Numerator's methodology. Return to text
7. It is not possible for us to replicate the Census Bureau's seasonal-adjustment methodology. The Census methodology adjusts retail sales subcategories separately, sometimes even at a more granular level, and then combines them to sum to the total seasonally-adjusted retail sales series. This is the main reason why we perform our own seasonal adjustment in the series we work with. Due to the time span of the data and the reasons we explained above, we can get close to but cannot fully replicate the Census Bureau's official seasonally-adjusted retail sales series. More information on the Census Bureau's seasonal adjustment methods can be found at https://www.census.gov/retail/marts/www/timeseries.html. Return to text
8. The Federal Reserve Bank of Chicago uses the Numerator retail spending series in its Chicago Fed Advance Retail Trade Summary (CARTS) and has run additional analyses of the correlation between Numerator and Census data. See https://www.chicagofed.org/publications/chicago-fed-insights/2024/new-and-improved-carts. Return to text
9. The Economic Tracker by Opportunity Insights does not show a similar divergence in spending between households in low-, middle-, and high-income zip codes. In unreported results, we find that when we aggregate spending of individual households from the Numerator panel data into total spending at the zip code level, as in Opportunity Insights data, and examine average household spending in low-, middle, and high-income zip codes, our retail spending measures closely align with those from Opportunity Insights. When aggregating, our results also show there is no divergence between the average spending of households in low-, middle-, and high-income zip codes. This finding indicates that aggregating data at the zip code level masks heterogeneity in spending that occurs within zip codes. Return to text
10. In addition to household income, education, and generation, we could decompose average retail spending by occupation, race/ethnicity, state or region of the country, whether households have young children, whether households receive assistance from programs like SNAP or WIC, whether household members are recent immigrants, and several other attributes. Return to text
Hacıoğlu Hoke, Sinem, Leo Feler, and Jack Chylak (2024). "A Better Way of Understanding the US Consumer: Decomposing Retail Sales by Household Income," FEDS Notes. Washington: Board of Governors of the Federal Reserve System, October 11, 2024, https://doi.org/10.17016/2380-7172.3611.
Disclaimer: FEDS Notes are articles in which Board staff offer their own views and present analysis on a range of topics in economics and finance. These articles are shorter and less technically oriented than FEDS Working Papers and IFDP papers.