FEDS Notes
June 14, 2024
A Note On Revolving Credit Estimates1
Michael M. Chernousov, Jessica N. Flagg, Simona M. Hannon, Virginia L. Lewis, Suzanna M. Stephens, and Alice H. Volz*
Revolving credit represents a notable share of consumer debt and is an important part of household balance sheets. At the end of 2023, revolving credit was measured at over $1.3 trillion in the Z.1 Statistical Release, "Financial Accounts of the United States," and accounted for more than 25 percent of total consumer credit.2 (With the exception of the pandemic period, this share has hovered above 25 percent over the past decade.) These estimates are based on the G.19 Statistical Release, "Consumer Credit," produced by the Federal Reserve Board and are included in the set of Principal Federal Economic Indicators. That said, several other data sources can be used to construct estimates of revolving credit. In this note, we present an overview of the construction of the revolving credit estimates in the G.19 and compare these estimates to alternative measures of consumer credit.
Definition and Data Sources
Revolving credit primarily consists of credit card debt, but it also includes other revolving credit plans linked to overdraft arrangements and other revolving credit plans not accessed by credit cards. As of the end of 2023, data from the Reports of Condition and Income (Call Reports) for the commercial banking sector—the largest holder of such credit—indicate that approximately 92 percent of revolving credit balances consist of credit cards, with the remaining 8 percent attributed to revolving credit plans. Although commercial banks hold nearly 80 percent of revolving credit in the G.19 data, the entire universe of institutions holding such balances includes thrifts, credit unions, nonfinancial businesses, and finance companies.
Estimates of revolving credit in the U.S. can be obtained from five data sources. As summarized in Table 1, these sources vary in their representation of the revolving credit universe and in the frequency at which they are collected.
Table 1: Revolving Credit Data Source Overview
| Source | Representative of | Frequency |
|---|---|---|
| 1. G.19 Statistical Release, "Consumer Credit" | entire universe | monthly |
| 2. H.8 Statistical Release, "Assets and Liabilities of Commercial Banks in the United States" | commercial banks | weekly |
| 3. Federal Reserve Bank of New York Consumer Credit Panel (CCP)/Equifax | individuals with credit records | quarterly |
| 4. Survey of Consumer Finances (SCF) | U.S. households | triennially |
| 5. Capital Assessments and Stress Testing (FR Y-14M) | large firms | monthly |
- The G.19 Statistical Release, "Consumer Credit," reports outstanding credit extended to individuals for household, family, and other personal expenditures, excluding loans secured by real estate.3 The G.19 provides seasonally adjusted data for consumer credit outstanding, as well as simple annualized percent changes and not seasonally adjusted levels of total, revolving, and nonrevolving credit. Data are collected by sector—banks and thrifts grouped together under the depository institutions category, finance companies, credit unions, the federal government, non-profit and educational institutions, and nonfinancial businesses—from various sources that include weekly and monthly submissions to the Federal Reserve Board, as well as quarterly Call Report information. The G.19 covers the entire universe of consumer credit and is published at a monthly frequency.
- The H.8 Statistical Release, "Assets and Liabilities of Commercial Banks in the United States," provides an estimated, weekly aggregate balance sheet for all commercial banks in the United States.4 The H.8 release is primarily based on data that are reported weekly by an authorized sample of 850 domestically chartered banks and foreign-related institutions and quarterly Call Report data. Line item 21 in Table 2, "Credit Cards and Other Revolving Plans", presents estimates of revolving credit at domestically chartered commercial banks in the U.S.5 Like the G.19, the H.8 shows seasonally and not seasonally adjusted levels and growth rates based on season- ally adjusted levels for revolving credit. The H.8 covers the commercial banking universe and is published weekly.
- Estimates of revolving credit in the U.S. can also be obtained using Federal Reserve Bank of New York Consumer Credit Panel (CCP)/Equifax data. The CCP is a database on consumers' credit use and payment performance drawn from an anonymized 5 percent random sample of Equifax credit bureau records.6 Estimates based on the quarterly CCP version available to us are considered representative for the entire consumer credit universe in the U.S. reflected in credit bureau data.
- Additional estimates of revolving credit can be obtained from the Survey of Consumer Finances (SCF), which is a survey produced by the Federal Reserve Board in partnership with the Department of the Treasury.7 The SCF is a triennial, cross-sectional survey of U.S. families. The survey includes information on families' balance sheets, pensions, income, and demographic characteristics. The SCF contains an oversample of wealthy households, ensuring coverage of the full distribution of household wealth. Estimates based on the SCF are considered representative for the universe of revolving debt held by U.S. households.8
- Finally, the Capital Assessments and Stress Testing (FR Y-14M) data reflect a large share of revolving credit balances in the U.S. The data are collected by the Federal Reserve Board, while the estimates discussed are produced and publicly made available by the Federal Reserve Bank of Philadelphia.9 The FR Y-14M report collects detailed monthly domestic credit card data (among others). The respondent panel is comprised of U.S. bank holding companies, U.S. intermediate holding companies of foreign banking organizations, and covered savings and loan holding companies with $100 billion or more in total consolidated assets.10 As a result, the universe coverage is imperfect because the data collection does not include smaller lenders. The data have a monthly frequency.
Comparison of Estimates across Data Sources
Looking first at two related statistical releases produced by the Federal Reserve Board that publish levels and growth rates for revolving credit—G.19 "Consumer Credit" and H.8 "Assets and Liabilities of Commercial Banks in the United States"—we note that the monthly G.19 Statistical Release aims for complete coverage of the consumer credit universe in the U.S., while the weekly H.8 covers only the commercial banking sector. Since commercial banks are the major holder of the outstanding credit card debt, the principal data input for the G.19 revolving consumer credit series is from the weekly H.8 Statistical Release, line item 21, "Credit Cards and Other Revolving Plans."
Beyond differences in data coverage, there are several additional reasons why the measures of the G.19 revolving consumer credit and the H.8 credit card loans and other revolving plans series can differ in a given month. The second potential source of discrepancy arises from the frequency conversion used to calculate monthly levels of revolving consumer credit. The G.19 release uses the not seasonally adjusted, weekly H.8 data on credit card and other revolving plans and converts them into a monthly series by estimating the end-of-month levels. By contrast, the H.8 release calculates the pro rata averages of the Wednesday levels to construct the monthly level series. These computational differences can lead to considerable differences in the percent changes (that is, growth rates) between the G.19 and H.8 releases, especially in months with large changes in revolving credit card debt between the beginning and the end of the month.11
Differences can also arise as a result of seasonal adjustment. Both the H.8 and G.19 releases publish seasonally adjusted level series. However, there are two key differences in the methodologies employed. The H.8 release uses a multiplicative seasonal adjustment process to create seasonally adjusted weekly level series and then uses those series to construct seasonally adjusted monthly average levels and percent changes. The G.19 release, however, uses an additive process to seasonally adjust monthly flow values and then recursively constructs the seasonally adjusted level series and percent changes using the seasonally adjusted monthly flows. Additional differences in seasonal adjustment model selection can also cause discrepancies between the two measures.
Adjustments for structural activity in the H.8 release can further contribute to differences, creating a unique cause of discrepancy between the final published measures of the percent changes. In order to calculate the percent changes, both releases calculate flows of the series. However, for the percent changes, the H.8 release uses nonpublic level series that include adjustments for nonbank structure activities and accounting rule changes (e.g., a commercial bank acquires a thrift or adopts FAS 166/167), while the G.19 release incorporates the level series publicly reported on the H.8 release.12
Another source of discrepancy arises because of quarterly scaling of the monthly G.19 depository institutions estimates to the Call Report. H.8 estimates cannot be used directly, as the H.8 release is restricted to domestically chartered commercial banks which excludes savings institutions (e.g., thrifts) and some other depository institutions. To capture the entire universe of depository institutions, the G.19 release uses the quarterly Call Reports, which include these other institutions, as a benchmark and scales up the monthly data obtained from the H.8.
Finally, the G.19 release also adds adjustments, such as those related to interbank activity or transfers of loans between financial sectors, which may add to the discrepancies.
Although the factors discussed above contribute to differences between the revolving credit levels and growth rates reported by each release, the growth rates are very similar. In panel (a) of Figure 1, we show the G.19 and H.8 monthly annualized growth rates over the past decade. In panel (b) of Figure 1, we compare all revolving credit data sources discussed in this note. As can be seen in the figure, the SCF provides the lowest estimates of credit card debt, while the G.19 estimates are the highest, followed by estimates constructed from credit bureau data (CCP).
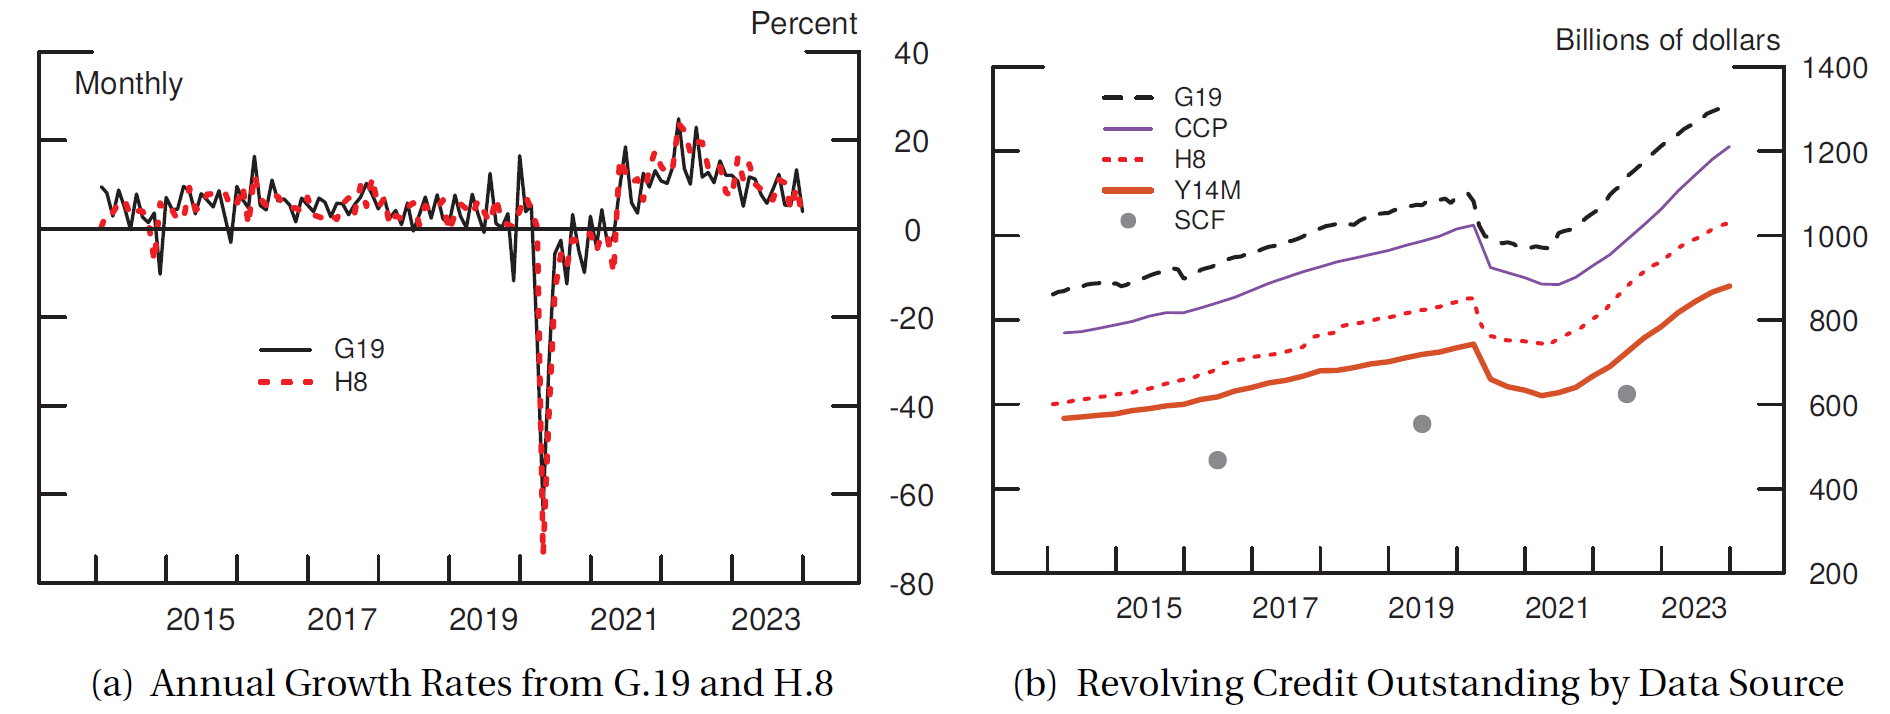
Note: The left panel shows the annualized growth rates for revolving credit as reported in the G.19 and H.8 statistical releases. The right panel shows total outstanding revolving credit estimates obtained from different sources. The SCF estimate combines convenience credit or balances that consumers may pay off in full without incurring charges, that is collected separately on the survey with revolving credit. With the exception of SCF, data are seasonally adjusted.
Source: Federal Reserve Board, G.19 Statistical Release, "Consumer Credit"; FRB, H.8 Statistical Release, "Assets and Liabilities of Commercial Banks in the United States"; FRB, Survey of Consumer Finances; Federal Reserve Bank of Philadelphia, Large Bank Credit Card and Mortgage Data; and Federal Reserve Bank of New York Consumer Credit Panel (CCP)/Equifax.
Unlike the H.8, which focuses on commercial banks, the SCF, G.19, and CCP aim to reflect the entire universe of revolving credit; however, there are differences between the data sources. First, there are differences related to the timing of the data collection. As previously noted, to estimate the month-end level, the G.19 release uses the not seasonally adjusted weekly "Credit Card and Other Revolving Plans" H.8 data and converts them into a monthly series. In addition, the G.19 revolving credit holdings by nonbank sectors are at varying frequencies: Thrifts, quarterly; credit unions and finance companies have holdings reported as of the last day of the month; whereas estimates for nonfinancial business are constructed based on an annual benchmark. The CCP, however, provides estimates of revolving credit at the end of each quarter. In addition, the CCP-derived estimates can be subject to delays in loan servicer reporting, which do not affect other data sources. Furthermore, whereas the G.19 and the CCP measure balances at a discrete point in time without reference to the payment cycle, the SCF asks about credit card balances as of the time the respondent made their last payment and thus excludes charges incurred in the interim. The measurement of revolving credit in the triennial SCF is also subject to some drawbacks, such as the lag between data collection and data release and the relatively small sample size (Henriques and Hsu, 2013).
Other discrepancies can be attributed to differences in the treatment of delinquencies and defaults that can vary among the data sources. As highlighted by Bricker et al. (2015), the G.19 follows the reporting conventions of each institution type, while the CCP contains charged-off loans. Although the SCF should capture delinquencies and defaults, it is possible that respondents are less likely to report loans on which they have not been making payments for a while (Bricker et al., 2015).
Additionally, the SCF differs in the data collection and reporting concept of revolving debt. Whereas the G.19, CCP, and Y-14M estimates collect and report the total revolving debt outstanding (which includes convenience credit), the SCF collects the two components of revolving credit—the revolving component and the convenience credit—separately (Henriques and Hsu, 2013).13
Finally, estimates of revolving credit can also be obtained by examining FR Y-14M data.14 These estimates represent approximately 69 percent of the revolving credit universe reflected in the G.19. The difference is due to the fact that FR Y-14M is submitted only for bank holding companies, savings and loan holding companies, and intermediate holding companies with $100 billion or more in total consolidated assets.15 Moreover, the FR Y-14M balances we used for comparison do not include charge cards, while the G.19 estimates do. In addition, the Y-14M balances do not include amounts that were charged off.16
Conclusion
In this note, we discussed several data sources providing the estimation of the revolving credit universe in the U.S. Two of these data sources—G.19 and H.8—publish both levels and growth rates for such credit. Other data sources, such as the CCP, SCF, or FR Y-14M, allow for the construction of level estimates for revolving credit. Although all the discussed series differ on a variety of dimensions—such as representation, frequency, seasonal adjustment, or timing of data collection, among several others—of note, is the similarity in the overall trends exhibited by the estimates based on the different sources discussed, as well as that in the growth rates reported by the G.19 and H.8.
References
Bricker, J., M. Brown, S. Hannon, and K. Pence (2015). "How Much Student Debt is Out There?" FEDS Notes. Washington: Board of Governors of the Federal Reserve System, August 7.
Henriques, A. and J. Hsu (2013). "Analysis of Wealth Using Micro and Macro Data: A Comparison of the Survey of Consumer Finances and Flow of Funds Accounts" FEDS Working Paper No. 2013-46. Washington: Board of Governors of the Federal Reserve System, May.
Lee, D. and W. van der Klaauw (2010). "An Introduction to the FRBNY Consumer Credit Panel". Staff Report no. 479, New York: Federal Reserve Bank of New York, November 10.
* Address:
Board of Governors of the Federal Reserve System
20th Street and Constitution Avenue NW
Washington, DC 20551, USA.
Emails For Authors:
Michael Chernousov. Email: [email protected].
Jessica N. Flagg. Email: [email protected].
Simona M. Hannon. Email: [email protected].
Virginia Lewis. Email: [email protected].
Suzanna Stephens. Email: [email protected].
Alice Volz. Email: [email protected].
Return to text
1. We thank Vitaly Bord, Sarena Goodman, Alvaro Mezza, Michael Palumbo, Joelle Scally, Shane Sherlund, and Kamila Sommer for useful comments and suggestions and Shannon Luk for outstanding editing. The views in this note are those of the authors and do not necessarily reflect those of the Board of Governors of the Federal Reserve System or its staff. Return to text
2. See: Z.1 Statistical Release. Return to text
3. More information can be found on the G.19 About page. Return to text
4. More information can be found on the H.8 About page. Return to text
5. Foreign-related institutions do not report any consumer data. Return to text
6. The sampling procedure ensures that the same individuals remain in the sample in each quarter and allows for entry into and exit from the sample, so that the sample is representative of the target population in each quarter. See Lee and van der Klaauw (2010) for a description of the design and content of the CCP. See also https://www.newyorkfed.org/medialibrary/interactives/householdcredit/data/pdf/data_dictionary_HHDC.pdf. Return to text
7. More information can be found on the SCF About page. Return to text
8. Credit cards used for business purposes are deliberately excluded in SCF. Return to text
9. See: https://www.philadelphiafed.org/surveys-and-data/large-bank-credit-card-and-mortgage-data. Return to text
10 See: https://www.federalreserve.gov/apps/reportingforms/Report/Index/FRY − 14M . Return to text
11. Since the H.8 series is a weekly series (that is, captures stock at close of business on Wednesday of a given week), the G.19 release estimates the month-end value when needed. If the last daily value of the month falls on a Wednesday, the G.19 release uses that value. Otherwise, the G.19 release uses the last weekly value of the current month and the first weekly value of the next month and extrapolates based on where the month-end falls between these two values. For more detail, see the G.19 About page monthly estimate description. Return to text
12. The nonpublic level series is only used for the calculation of published percent rate changes. Return to text
13. Convenience credit consists of balances that consumers may pay off in full without incurring interest. Return to text
14. The Y-14M estimates discussed in this note are based on publicly released information, and not on new analysis based on Y-14M micro data. Return to text
15. See: https://www.federalreserve.gov/apps/reportingforms/Report/Index/FRY − 14M. Return to text
16. See: https://www.philadelphiafed.org/-/media/frbp/assets/surveys-and-data/y14/y-14-data-methodology.pdf. Return to text
Chernousov, Michael M., Jessica N. Flagg, Simona M. Hannon, Virginia L. Lewis, Suzanna M. Stephens, and Alice H. Volz (2024). "A Note On Revolving Credit Estimates," FEDS Notes. Washington: Board of Governors of the Federal Reserve System, June 14, 2024, https://doi.org/10.17016/2380-7172.3526.
Disclaimer: FEDS Notes are articles in which Board staff offer their own views and present analysis on a range of topics in economics and finance. These articles are shorter and less technically oriented than FEDS Working Papers and IFDP papers.