FEDS Notes
December 20, 2024
An investigation into the economic slowdown in the euro area
Francois de Soyres, Ece Fisgin, Joaquin Garcia-Cabo Herrero, Mitch Lott, Chris Machol, and Keith Richards1
On January 7, 2025, the right panel of figure 3 was updated, with the blue line's label corrected to "Euro area".
Euro-area economic performance has been subdued since around 2018, and especially so in more recent years. As discussed in both Enrico Letta's and Mario Draghi's reports, the euro area economy faces notable structural challenges that were exacerbated by the pandemic and the disruption to energy markets that ensued from the Russian invasion of Ukraine. This contrasts with the recent strength in the U.S. economy, which did not suffer as much from the energy shock and continues to be supported by strong government spending.2
On the demand side, this divergence is most clearly evident in consumption, as shown in Figure 1, as household accumulated significant excess savings amid elevated uncertainty. Moreover, as noted in de Soyres et al. (2024), the gap in output performance between the U.S. and the euro area can be traced to a divergence in labor productivity, likely reflecting under-utilization of labor within firms stemming from weakness in aggregate demand.3 In this note, we focus on the particular role of manufacturing in the ongoing economic euro-area slowdown. In particular, we describe the heterogeneous performance across countries within the monetary union, and we highlight the role of energy prices and trade with China in shaping recent developments.

Left Chart:
Note: The data extend through 2024:Q3.
Source: Statistical Office of the European Communities; Bureau of Economic Analysis; FRB staff calculations.
Center Chart:
Note: The data extend through 2024:Q2 for Italy and 2024:Q3 for all others.
Source: Statistical Office of the European Communities; Bureau of Economic Analysis; FRB staff calculations.
Right Chart:
Note: Labor productivity is output per hour worked. The data extend through 2024:Q2 for Italy and 2024:Q3 for all others.
Source: Statistical Office of the European Communities; Bureau of Labor Statistics; FRB staff calculations.
Manufacturing Woes
Figure 1 reveals significant geographical disparities in economic performance amongst European economies, especially between the protracted stagnation in the manufacturing-heavy and natural gas-dependent German economy and the recent strength in the services and tourism oriented Spanish economy.
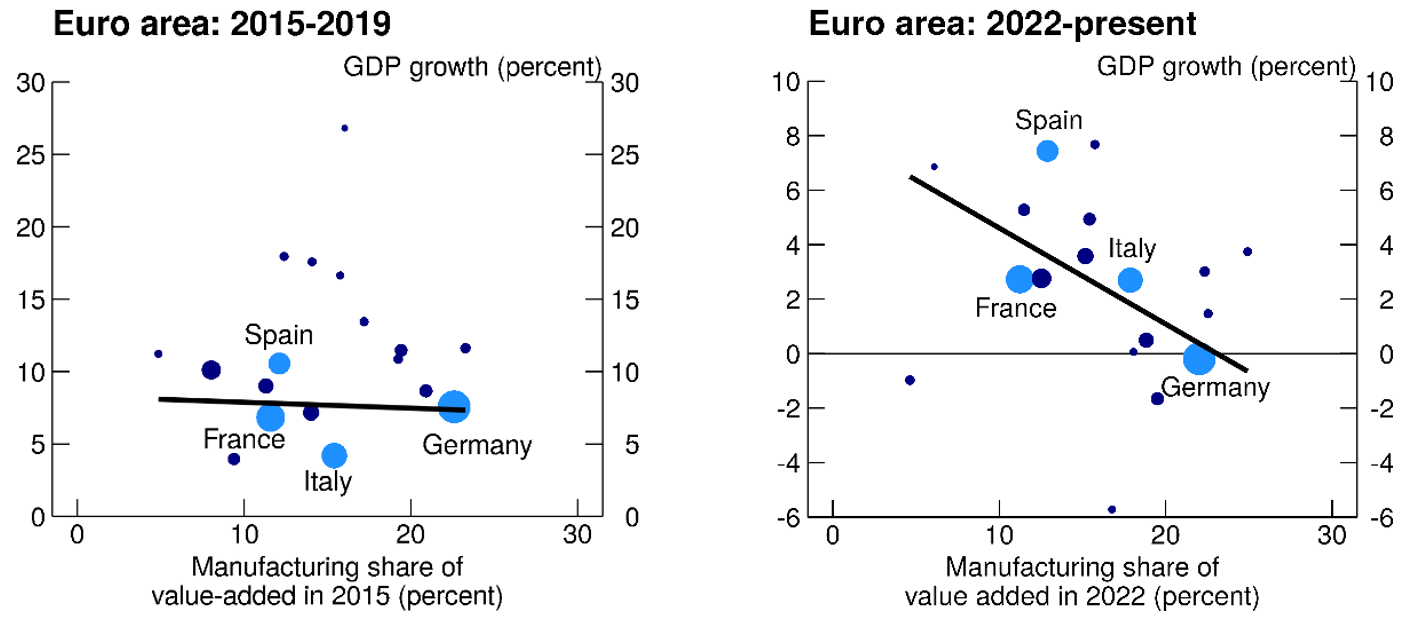
In the left panel of Figure 2, we relate cumulative economic growth in the 2015-2019 period to the share of manufacturing in total value added at the beginning of that period. We see that during that period, the share of manufacturing did not correlate with overall economic performance. The right panel of Figure 2 repeats this exercise for the more recent period encompassing data between 2022:Q1 and 2024:Q3. Strikingly, the strong negative association reveals that manufacturing share is correlated with poor economic performance of the last few years.4

Left Chart:
Note: GDP growth is cumulative growth from 2015 to 2019 for each country in the euro area excluding Ireland and Malta. Manufacturing share measures manufacturing total value-added in millions of euros as a share of total value-added. Dots are sized based on GDP.
Source: Eurostat; FRB staff calculations.
Right Chart:
Note: GDP growth is cumulative growth from 2022:Q1 until latest available data for each country in the euro area excluding Ireland and Malta. Manufacturing share measures manufacturing total value-added in millions of euros as a share of total value-added. Dots are sized based on GDP.
Source: Eurostat; FRB staff calculations.
There are many reasons why manufacturing is reeling in the euro area. For example, Ruslana and Fleck (2024) highlights that monetary policy might have been an important factor, as high interest rates have depressed economic activity more in euro-area countries with large manufacturing sectors. Additionally, the unprecedented energy shock of 2022 might also have played a notable role, as discussed in the next section.
Energy Price and Natural Gas Dependence
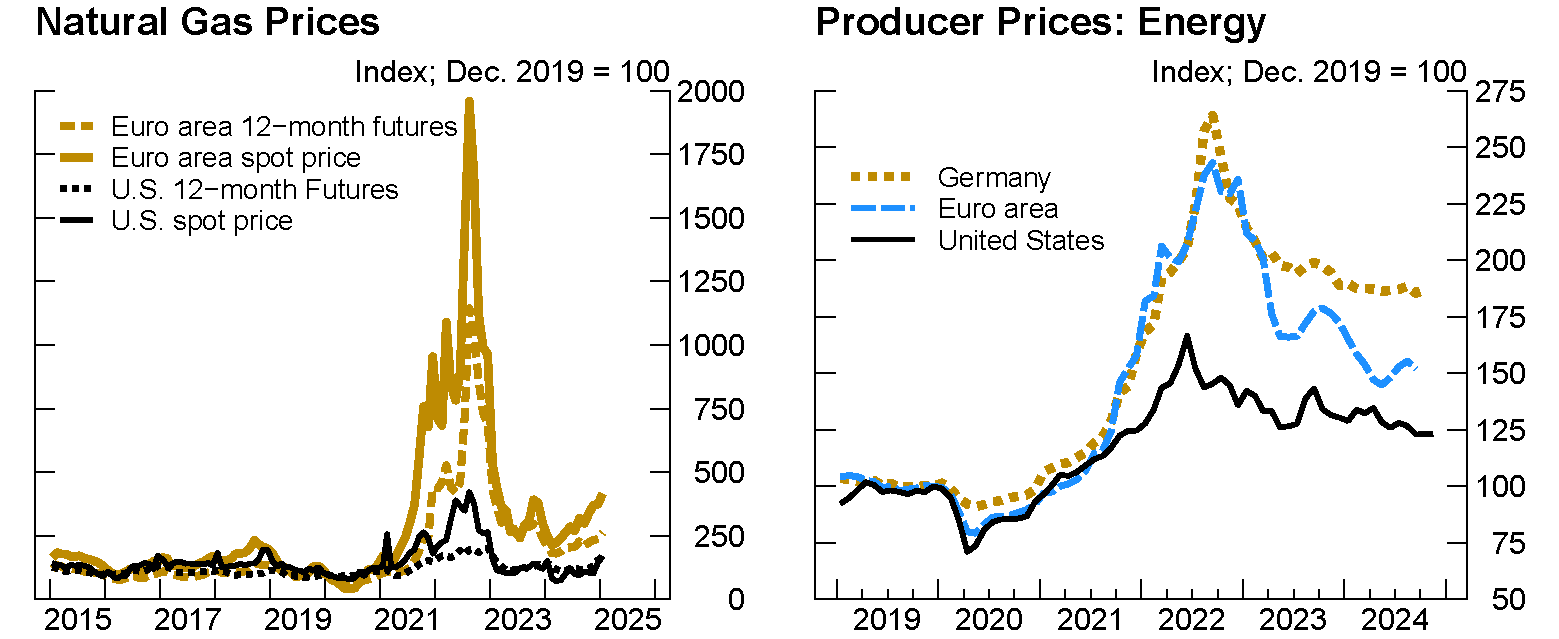
The euro area underwent unprecedented energy market disruptions that ensued from the Russian invasion of Ukraine. As shown in Figure 3, Brent and European natural gas prices spiked in 2022, resulting in large increases in consumer and producer energy prices. While commodity prices have largely retraced their previous increases—Brent and TTF natural gas spot prices still stand 17 percent and 117 percent higher, respectively, than their 2017-2019 average—this reversal did not fully pass-through the energy components of CPI and PPI in the euro area, which remain about 50 to 60 percent above pre-pandemic level. There is notable heterogeneity across countries, with Germany standing out as the country where energy PPI remains the highest, above twice its pre-pandemic level.

Left Chart:
Note: The data are presented as monthly averages of daily data and extend through November, which represents the daily average through November 21st.
Source: Bloomberg, Haver Analytics.
Right Chart:
Note: The data extend through November for the U.S., October for Germany, and September for the euro area.
Source: Statistical Office of the European Communities via Haver Analytics; FRB staff calculations.
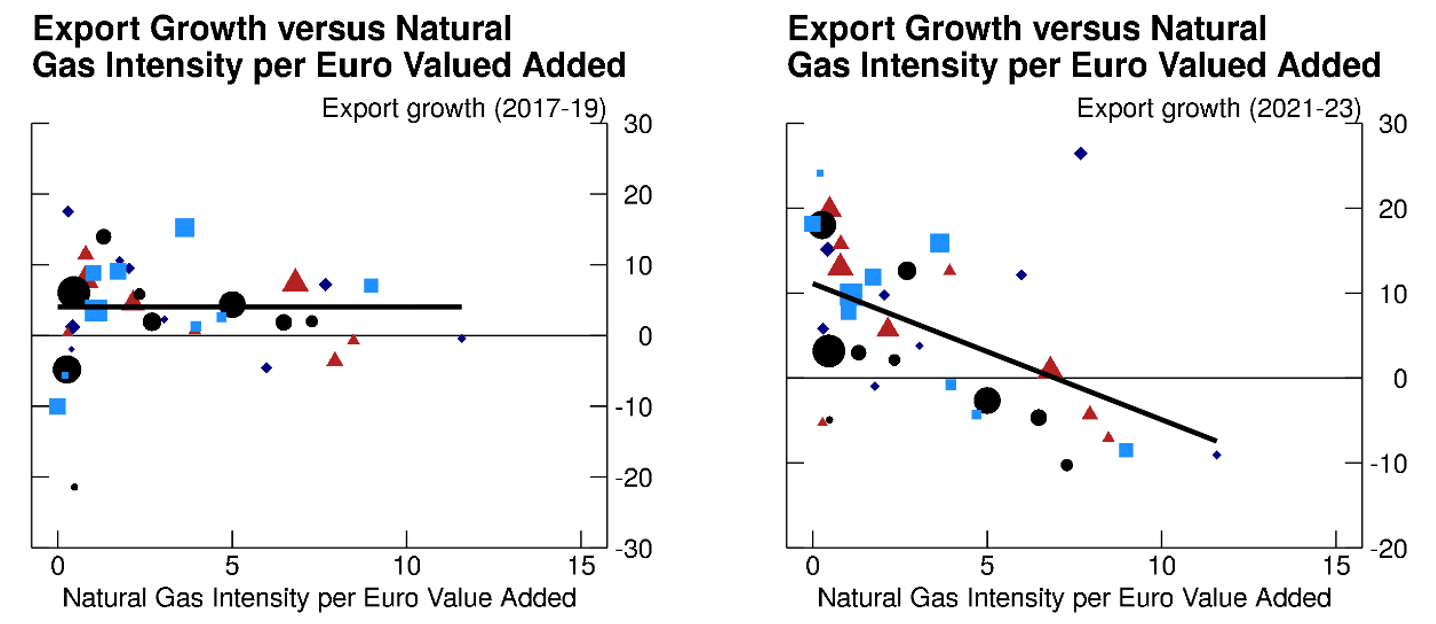
To investigate the role of the natural gas shock in ongoing economic weakness, we turn to sectoral data across several European economies and compute natural gas intensity, defined as terajoules of natural gas usage per euro of value added output for nine sectors across four economies. The sectors of interest include agriculture, chemicals, food, machinery, metals, nonmetals, paper, textiles, and transport equipment; and the countries of interest include Germany, France, Austria, and Italy. We then relate this metric to export performance across two time periods, as shown in Figure 4.

Note: Each shape represents an industry in a particular country. The following countries are included Germany (black circles), Italy (light blue squares), France (red triangles), and Austria (navy blue diamonds). The size of each shape represents the size of the industry.
Source: UN Comtrade, Statistical Office of the European Communities via Haver Analytics; FRB staff calculations.
We find that prior to the energy shock and the pandemic, there was no statistically significant relationship between export growth and natural gas intensity (left panel). However, this relationship changed significantly amidst the energy price shock with export growth for sectors in the top decile of natural gas intensity declining on average 7.2 percent, contrasting starkly with the export growth in sectors at the bottom decile of natural gas intensity, which on average experienced export growth of 13.8 percent (right panel).5 Interestingly, the negative association between natural gas intensity and export performance also holds when only looking at sectoral variations within countries.
The Role of China
Since 2018, Chinese officials have been emphasizing the need for China to achieve greater self-reliance. As discussed in de Soyres and Moore (2024), China seems to have made some progress towards the goal of decreasing its reliance on imported inputs, while actually increasing its reliance on foreign demand to absorb its production of manufacturing goods.
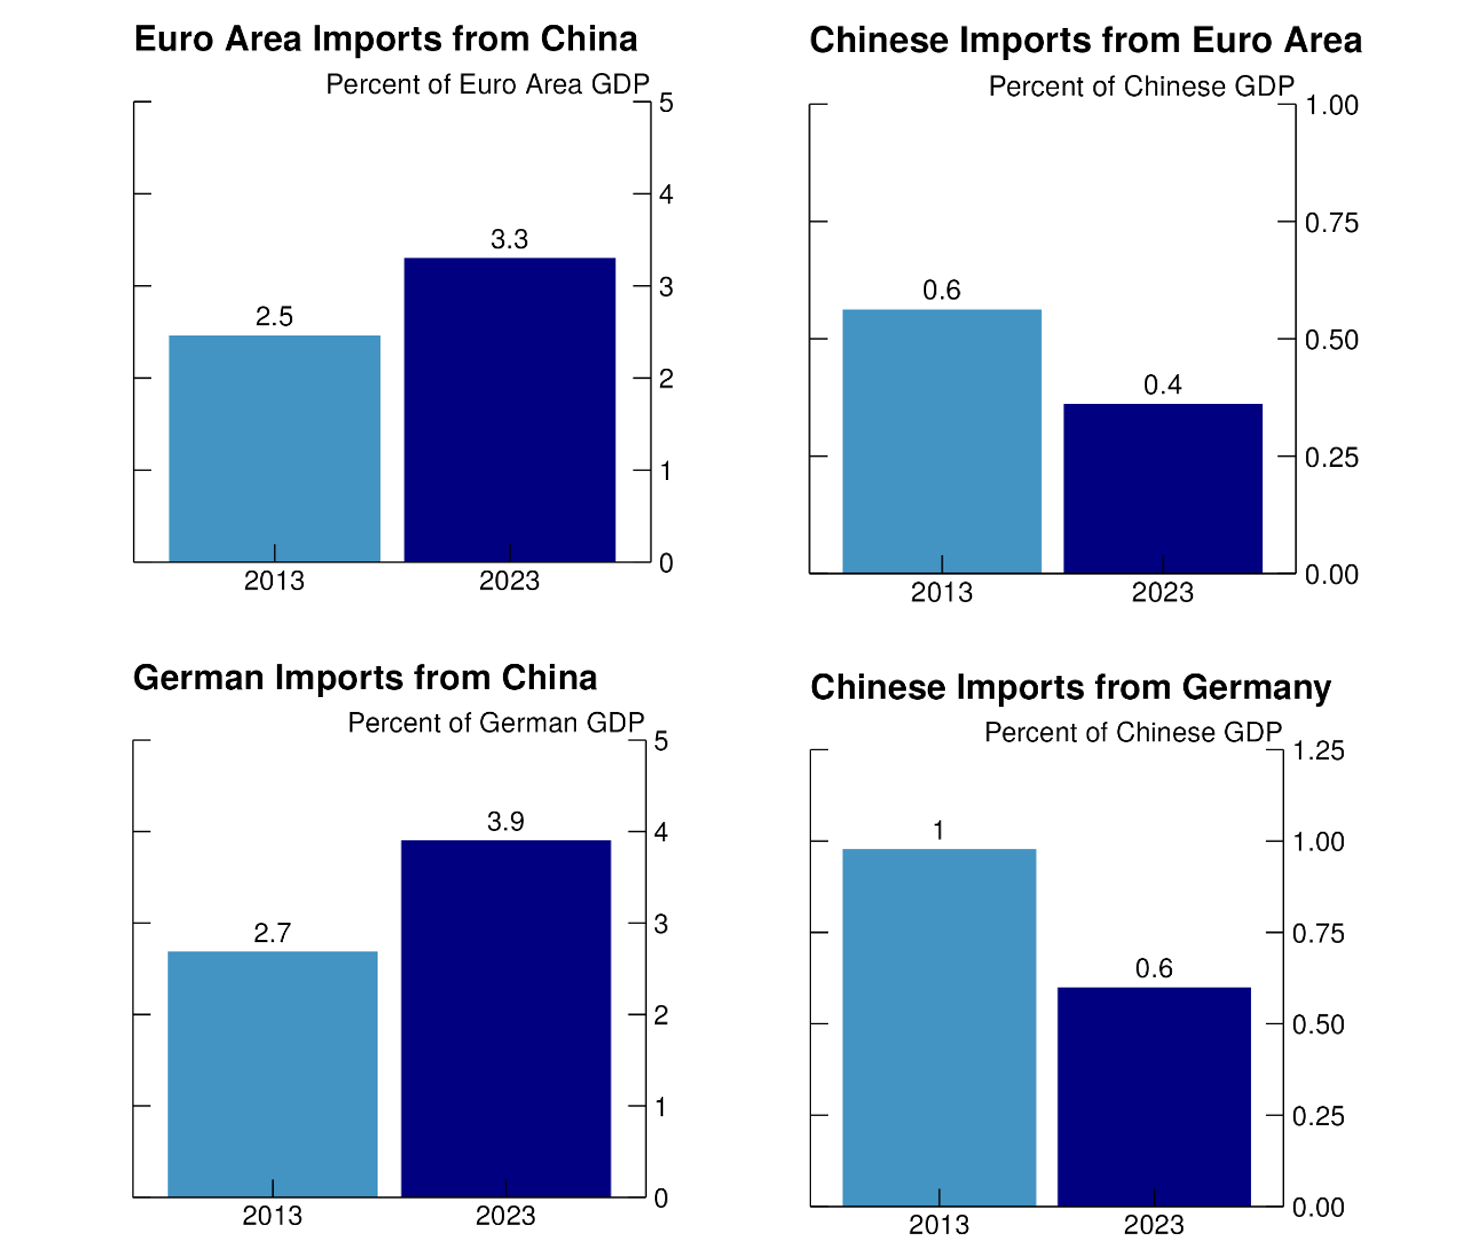
The consequences of China's development strategy can be seen by looking at the evolution of its imports from and exports to the euro area in general, and Germany in particular. In Figure 5, the top left chart shows that euro area imports from China increased from 2.5 to 3.3 percent of euro-area GDP, while the top right chart reveals that the Chinese imports from the euro area (as a share of euro-area GDP) decreased by almost half in the same period. Focusing on Germany in bottom row, the same pattern is at play, with Germany increasing its import from China (as a share of German GDP) by 44 percent while China decreased its import from Germany (as a share of Chinese GDP) by almost half.

Top-Left Chart:
Note: Data are annual. Euro area aggregate comprises of Germany, France, Italy, and Spain
Source: UNComtrade.
Top-Right Chart:
Note: Data are annual. Euro area aggregate comprises of Germany, France, Italy, and Spain
Source: UNComtrade.
Bottom-Left Chart:
Note: Data are annual.
Source: UNComtrade.
Bottom-Right Chart:
Note: Data are annual.
Source: UNComtrade.
As China tries to continue to reduce its import dependency, can exports to China remain a tailwind for growth for euro area countries? Figure 6 explores this question by looking at the association between GDP growth and the share of exports to China over three different time periods. During the 2014-2016 period, exposure to China as an export destination was not correlated with economic performance. However, the relationship gradually turned negative in the past few years, as stronger export links with China was associated with mildly lower GDP growth in 2017-2019, and a more pronounced weakness in 2022-2023.6

Left Chart:
Note: GDP growth is cumulative percent growth from 2014:Q1 until 2016:Q4. Exports are 2014-2016 euro area goods exports to China as a percent of total exports. Dots are sized based on GDP.
Source: Eurostat.
Center Chart:
Note: GDP growth is cumulative percent growth from 2017:Q1 until 2019:Q4. Exports are 2017-2019 euro area goods exports to China as a percent of total exports. Dots are sized based on GDP.
Source: Eurostat.
Right Chart:
Note: GDP growth is cumulative percent growth from 2022:Q1 until latest available data. Exports are 2023 euro area goods exports to China as a percent of total exports. Dots are sized based on GDP.
Source: Eurostat.
Conclusion
The subdued economic performance in the euro area's underscores the multifaceted challenges of energy dependency, manufacturing vulnerabilities, and shifting global trade dynamics. While structural issues and external shocks have significantly impacted economic performance, understanding the interplay between energy prices, sectoral dependencies, and global trade relationships remains critical.
References
Cascaldi-Garcia, Danilo, and Hyunseung Oh (2024). "Global Implications of Brighter U.S. Productivity Prospects," FEDS Notes. Washington: Board of Governors of the Federal Reserve System, July 19, 2024.
Datsenko, Ruslana, and Johannes Fleck (2024). "Country-Specific Effects of Euro-Area Monetary Policy: The Role of Sectoral Differences," FEDS Notes. Washington: Board of Governors of the Federal Reserve System, November 12, 2024.
de Soyres, François, and Dylan Moore (2024). "Assessing China's Efforts to Increase Self-Reliance," FEDS Notes. Washington: Board of Governors of the Federal Reserve System, February 02, 2024.
de Soyres, François, Dylan Moore, and Julio Ortiz (2023). "An update on Excess Savings in Selected Advanced Economies," FEDS Notes. Washington: Board of Governors of the Federal Reserve System, December 15, 2023.
de Soyres, François, Joaquin Garcia-Cabo Herrero, Nils Goernemann, Sharon Jeon, Grace Lofstrom, and Dylan Moore (2024). "Why is the US GDP recovering faster than other advanced economies?," FEDS Notes. Washington: Board of Governors of the Federal Reserve System, May 17, 2024.
1. François de Soyres ([email protected]), Ece Fisgin ([email protected]), Joaquin Garcia-Cabo Herrero ([email protected]), Mitch Lott ([email protected]), Chris Machol ([email protected]), and Keith Richards ([email protected]) are with the Board of Governors of the Federal Reserve System. The views expressed in this note are our own, and do not represent the views of the Board of Governors of the Federal Reserve, nor any other person associated with the Federal Reserve System. Return to text
2. According to the most recent IMF Fiscal Monitor data, U.S. fiscal deficit (computed as net lending) reached to 8.8% of GDP in 2023 and is expected to amount to 6.5% of GDP in 2024. This contrasts with the sharper fiscal consolidation in the euro area, where fiscal deficit was 3.6% of GDP in 2023 and is expected to reduce to 2.9% pf GDP in 2024. Return to text
3. Cascaldi-Garcia and Oh (2024) noted that several features of the data, including asset price, relative investment and currency movements, are consistent with a rise on optimism about future growth in U.S. productivity. Return to text
4. In Figure 2, the right panel features a negative slope of -0.4, statistically significant at the 5% level. Return to text
5. In Figure 4, the right panel features a slope of -1.6, significant at the 1% level. Return to text
6. In figure 6, the middle panel shows a negative slope of -0.2 (statistically significant at the 5% level), and the right panel shows a negative slope of -0.5 (statistically significant at the 1% level). Return to text
de Soyres, Francois, Ece Fisgin, Joaquin Garcia-Cabo Herrero, Mitch Lott, Chris Machol, and Keith Richards (2024). "An investigation into the economic slowdown in the euro area," FEDS Notes. Washington: Board of Governors of the Federal Reserve System, December 20, 2024, https://doi.org/10.17016/2380-7172.3683.
Disclaimer: FEDS Notes are articles in which Board staff offer their own views and present analysis on a range of topics in economics and finance. These articles are shorter and less technically oriented than FEDS Working Papers and IFDP papers.