FEDS Notes
October 22, 2024
Assessment of Dealer Capacity to Intermediate in Treasury and Agency MBS Markets
Paul Cochran, Lubomir Petrasek, Zack Saravay, Mary Tian, Edward Wu1
Summary
We provide an assessment of broker-dealers' current and future capacity to support the smooth functioning of the Treasury and agency MBS markets, considering increases in Treasury issuance and continued Federal Reserve balance sheet normalization. Drawing on regulatory data analysis, recent research, and experiences with fixed income market functioning, we focus on two types of constraints that are most relevant for dealers' intermediation activities: regulatory constraints—specifically the minimum Supplementary Leverage Ratio (SLR) requirement at the Bank Holding Company (BHC) level—and internal risk limits—specifically Value at Risk (VaR) limits at the trading-desk level for each dealer.
Since the beginning of the Federal Reserve's balance sheet normalization in June 2022, dealers' intermediation activities in the Treasury and MBS markets have increased. Dealers' SLR constraints have become less binding as Tier 1 capital generally grew more quickly than total leverage exposure. At the same time, new research suggests that dealers' risk-based constraints may have become more binding amid elevated interest rate volatility and increased dealer inventories of Treasury securities.2
Going forward, dealers' intermediation activities in the Treasury and MBS markets are likely to continue to expand with the total amount outstanding of these securities held by the public. In particular, client demand for transacting and financing is expected to rise as a result of additional Treasury issuance. As demand picks up, dealer balance sheets are likely to edge closer to their capacity constraints, which could limit dealers' willingness to support these important markets.3
However, notwithstanding the projected increase in dealers' balance sheets, our estimates through the end of 2024 indicate that, under normal market conditions, the regulatory minimum SLR requirements would not limit dealers' intermediation activities.
Under stressed market conditions, however, high market volatility could significantly increase the effect of internal risk-sensitive limits at fixed income trading desks and constrain dealers' ability to support market functioning by supplying liquidity.
Regulatory capital constraints on dealer intermediation
Regulatory capital constraints mainly apply to bank-affiliated dealers, which are subject to regulatory capital requirements imposed at the BHC level.4 The SLR has been the most binding capital requirement for several large primary dealers in recent years.5 The SLR is particularly relevant for Treasury market intermediation as it has the potential to impose a high regulatory capital requirement for a relatively low-risk but high-volume activity.
Figure 1 shows the reported SLRs of the six largest dealers of Treasury securities. All of these dealers are subject to the minimum SLR of five percent because they are affiliated with U.S. Global Systemically Important Banks (GSIBs). In recent quarters, their SLRs have largely trended upward from their historical lows in early 2022 and the SLRs of several large dealers are gradually approaching pre-COVID levels. This, in turn, increases their headroom for balance sheet growth, that is the amount of additional leverage exposure that dealers could take on at current capital levels and still maintain the SLR of 5% at the BHC level. Still, as of June 2024 (the most recent reporting date), the SLR is the most binding capital requirement for two of the six largest dealers, as indicated by the overlaid crosses in the figure.6
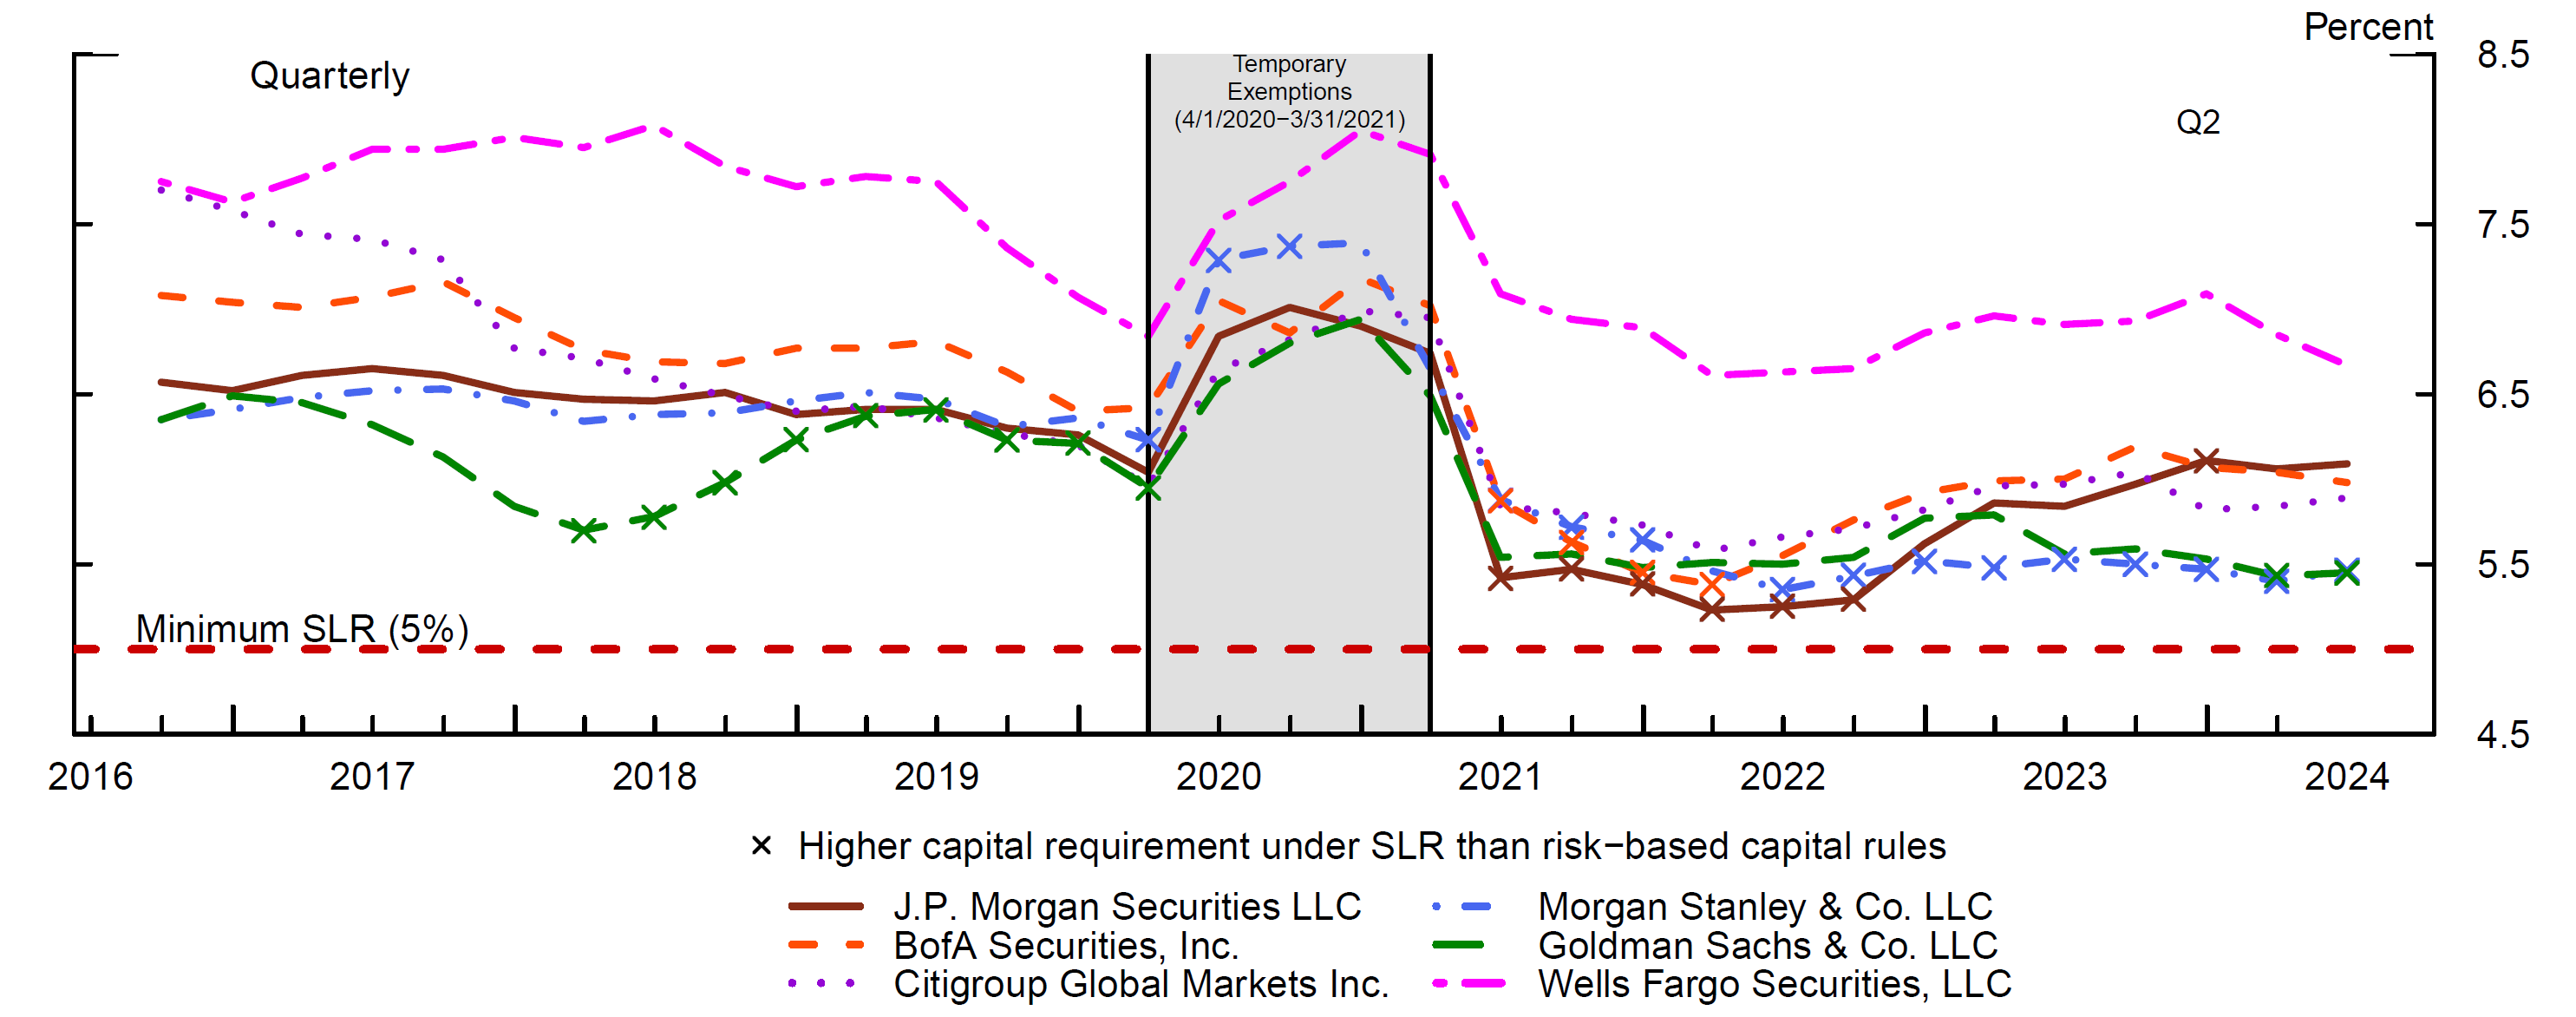
Note: The temporary exemption period reflects the temporary exclusion of Treasury securities and reserves from total leverage exposure.
Source: FR Y−9C and FFIEC 101
As shown in Table 1, as of June 2024, all six dealers have sufficient headroom to allow a sizeable expansion of their Treasury market activities at current capital levels. BHCs under which primary dealers operate that are subject to the SLR could, in the aggregate, expand their total leverage exposure by 39 percent at current (Jun. 2024) capital levels (second to last column). Hypothetically, if those dealers were to use the entire headroom to expand their Treasury intermediation – including long positions and financing – they would be able to expand those activities by 316 percent from recent levels (last column).7 Among all primary dealers, the total capacity to expand Treasury intermediation is likely even greater since several smaller dealers are not subject to the SLR.
Table 1: SLR and Dealer Intermediation Capacity
| Primary Dealer | Treasury long pos. ($ bn) | Treasury financing ($ bn) | SLR | Total leverage exposure ($ bn) | Headroom ($ bn) | Headroom % of total leverage exposure | Headroom % of Treas. long & financing |
|---|---|---|---|---|---|---|---|
| J.P. Morgan Securities | 154.44 | 472.32 | 6.09 | 4768.2 | 1039.47 | 21.8 | 165.85 |
| Citigroup Global Markets | 85.46 | 247.28 | 5.89 | 2949.53 | 525.02 | 17.8 | 157.79 |
| Goldman Sachs | 70.87 | 256.72 | 5.45 | 2078.74 | 187.09 | 9 | 57.11 |
| BofA Securities | 34.59 | 298.24 | 5.98 | 3756.53 | 736.28 | 19.6 | 221.22 |
| Morgan Stanley | 43.93 | 157.22 | 5.46 | 1473.39 | 135.55 | 9.2 | 67.39 |
| Wells Fargo Securities | 15.79 | 43.36 | 6.67 | 2258.52 | 754.35 | 33.4 | 1275.32 |
| All SLR primary dealers | 450.63 | 1863.26 | 6.971 | 18535.42 | 7306.66 | 39.42 | 315.77 |
| Non-SLR primary dealers | 119.1 | 726.36 |
Note: SLR is measured as of June 2024 from form FR Y−9C. Treasury intermediation is an average over June 2024 based on information reported on form FR 2004. Minimum SLR requirement at the bank holding company level is 5 percent of Tier 1 capital for the 6 largest dealers (listed by name), and 3 percent for other SLR dealers. There are five additional dealers not listed by name that the SLR applies to. The SLR in the second to last row is an average of the SLRs. We measure balance sheet "headroom" as the amount of additional leverage exposure that dealers could take on and still maintain the SLR of 5% at the BHC level, given their current Tier 1 capital and total leverage exposure.
Source: FR Y−9C and FR 2004.
However, it is possible that the SLR could still affect dealer Treasury intermediation. First, there is considerable variation in headroom under the SLR among dealers, and dealers may not be comfortable with using up their spare capacity, potentially moderating their intermediation activity before their headroom is completely consumed. Moreover, activities other than dealer Treasury intermediation may put demands on spare capacity at the BHC level at the same time as demand for dealer intermediation rises, as was the case in March 2020 when BHC balance sheets expanded due to bank credit line drawdowns and loan increases.
Historical relationship between dealer balance sheets and Treasury securities held by the public
As shown in Figure 2, the market value of Treasury securities held by the public, that is, Treasury securities outstanding (excluding the Federal Reserve's System Open Market Account (SOMA) holdings8) has grown rapidly over the past decade from around $8.3 trillion in 2012 to $22.9 trillion in July 2024 (dotted green line), a 176 percent increase. Over the same period, primary dealers' intermediation of Treasury securities, as measured by their gross positions (solid blue line) and secured financing provided to clients (dashed red line), have increased by significantly less, 80 percent and 43 percent respectively. During the current balance sheet normalization, between June 2022 and present, Treasury securities outstanding ex. SOMA have increased by 31 percent while dealers' gross positions and secured financing provided to clients have increased by 47 percent and 19 percent respectively.
Figure 2. Primary Dealer Positions and Financing in Treasuries vs Total Treasuries Outstanding (excl. SOMA)
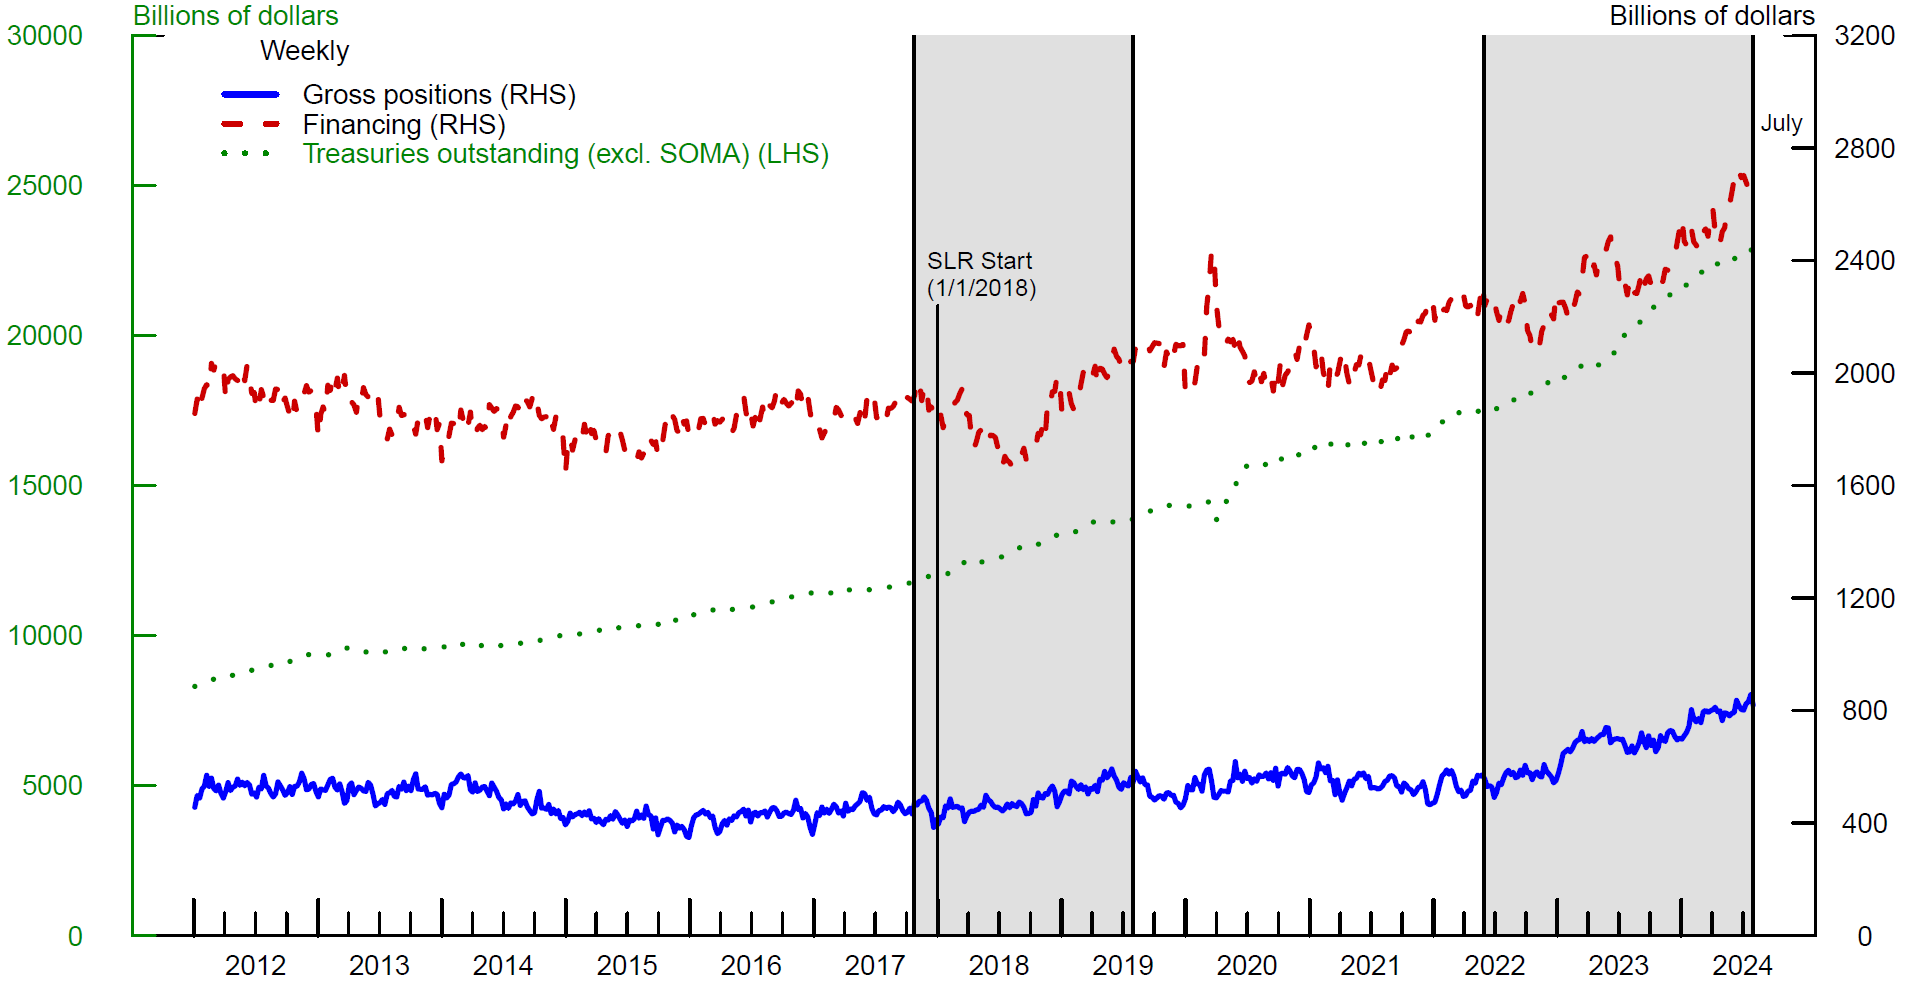
Note: The sample contains all primary dealers. Financing refers to financing for clients (securities borrowing, reverse repo, etc.). Treasury holdings of the SOMA portfolio are excluded from total UST outstanding. The shaded regions represent periods of balance sheet runoff spanning from Oct. 2017 − Jul. 2019 and Jun. 2022 − present.
Source: FR 2004A, FR 2004C, and Treasury Direct.
Regression analysis indicates that primary dealer Treasury positions and financing are positively related to Treasury securities held by the public, consistent with primary dealers' roles in the primary and secondary markets as providers of intermediation. In the primary market for Treasury securities, primary dealers are required to participate in Treasury auctions, while in the secondary market, dealers facilitate trading by taking bonds into their inventory and financing clients' purchases. Both dealers' primary and secondary market activities tend to increase with the amount of outstanding Treasury securities. Indeed, as shown in Table 2, between January 2012 and July 2024 (Full period), for every $1 increase in Treasury securities held by the public, primary dealers' gross positions of Treasury securities increased by 1.9 cents. Over the QT periods in which the Federal Reserve was substantially decreasing its holdings of Treasury and Agency securities, the sensitivity of positions to Treasuries outstanding was higher, consistent with increased client demand for transacting and financing during periods of balance sheet normalization. Over the QT1 period, the sensitivity was 5.5 cents per dollar (column 2), while for the current QT period, beginning in June 2022 (QT2 period), the sensitivity has been at 4.5 cents per dollar (column 3).
Table 2: Regression analysis of Dealer Treasury Gross positions vs Total Treasuries Outstanding (excl. SOMA)
| Full (1) | QT1 (2) | QT2 (3) | Pre-SLR (4) | Post-SLR (5) | |
|---|---|---|---|---|---|
| Treasuries outstanding (excl. SOMA) | 0.019*** | 0.055*** | 0.045*** | -0.034*** | 0.029*** |
| Quarter end flag | -68,676.940** | -92,828.220*** | -46,778.140* | ||
| Observations | 648 | 92 | 113 | 309 | 339 |
| R2 | 0.608 | 0.640 | 0.805 | 0.414 | 0.795 |
*p<0.1; **p<0.05; ***p<0.01
Note: The sample contains all primary dealers. The full-sample period is Jan. 2012 - Jul. 2024. The pre-SLR period is Jan. 2012 - Dec. 2017. The post-SLR period is Jan. 2018 - Jul. 2024. QT refers to periods of the Federal Reserve's balance sheet normalization. QT1 period is Oct. 2017 - Jul. 2019. QT2 period is Jun. 2022 - Jul. 2024. The quarter end flag variable specifies when a reporting date from the FR 2004 falls on the last day of a quarter. This controls for quarter end window dressing effects. The data is at weekly frequency and the regression is in levels.
Source: FR 2004A, FR 2004C, and Treasury Direct.
Table 3 displays the relationship between Treasury securities held by the public and dealers' financing of Treasury securities. Dealer financing provided to clients increased 4.9 cents per dollar of increase in Treasury securities held by the public in the Full period (column 1), more than twice the magnitude of the sensitivity on dealers' gross positions. The QT1 period had an increase of 8.2 cents per dollar (column 2) while the QT2 period has seen an increase of 7.3 cents per dollar (column 3). Overall, the regression results in Tables 2 and 3 highlight that dealers intermediate more Treasury securities during the Federal Reserve's QT periods than in other periods. However, dealer Treasury intermediation appears somewhat less responsive to the amount of outstanding Treasury securities in QT2 compared to QT1.9
Table 3: Regression analysis of Dealer Treasury Financing vs Total Treasuries Outstanding (excl. SOMA)
| Full (1) | QT1 (2) | QT2 (3) | Pre-SLR (4) | Post-SLR (5) | |
|---|---|---|---|---|---|
| Treasuries outstanding (excl. SOMA) | 0.049*** | 0.082*** | 0.073*** | -0.017*** | 0.068*** |
| Quarter end flag | -144,317.900*** | -182,798.500*** | -107,641.400* | ||
| Observations | 648 | 92 | 113 | 309 | 339 |
| R2 | 0.760 | 0.222 | 0.717 | 0.089 | 0.799 |
*p<0.1; **p<0.05; ***p<0.01
Note: The sample contains all primary dealers. The full-sample period is Jan. 2012 - Jul. 2024. The pre-SLR period is Jan. 2012 - Dec. 2017. The post-SLR period is Jan. 2018 - Jul. 2024. QT refers to periods of the Federal Reserve's balance sheet normalization. QT1 period is Oct. 2017 - Jul. 2019. QT2 period is Jun. 2022 - Jul. 2024. The quarter end flag variable specifies when a reporting date from the FR 2004 falls on the last day of a quarter. This controls for quarter end window dressing effects. The data is at weekly frequency and the regression is in levels.
Source: FR 2004A, FR 2004C, and Treasury Direct.
An important question is whether the decreased sensitivity of dealer Treasury positions and financing during QT2 compared to QT1 may be driven by regulatory constraints, in particular the SLR, which was introduced in 2018. To examine this possibility, we compare the sensitivities during the pre-SLR and post-SLR periods. As shown in columns 4 and 5, the sensitivity of dealers' gross positions (Table 2) and dealer financing (Table 3) to total Treasury outstanding increased after the implementation of the SLR requirement. Although the increase in sensitivity could be driven by a variety of factors, this finding appears inconsistent with the hypothesis that the implementation of the SLR limited dealers' capacity to expand their intermediation over time in response to increases in Treasury securities outstanding.
Projection of dealer U.S. Treasury positions and financing
Using the estimated historical relationships over the 2022-2024 QT period shown in Tables 2 and 3 and the U.S. Department of the Treasury's estimate of privately-held net marketable borrowing10 as a proxy for net changes in total Treasuries outstanding, we provide projections of dealer Treasury positions and financing until the end of 2024. As shown in Figure 3, the U.S. Department of the Treasury projects that Treasury securities held by the public will increase by $976 billion from August 2024 to December 2024 (dotted green line), from $22.944 trillion to $23.920 trillion. Using the regression coefficients from Tables 2 and 3 (column 3), we arrive at the following projections for changes in dealer balance sheets between August to December 2024:
- An increase in dealer gross Treasury positions of $44 billion (= $976 billion x 0.045) [solid blue line].
- An increase in dealer financing of $71 billion (= $976 billion x 0.073) [dashed red line].
- An increase, therefore, in the asset side of primary dealer balance sheets of $115 billion.11
Figure 3. Projected Net change in Primary Dealer Positions and Financing and Total Treasuries Outstanding (excl. SOMA)
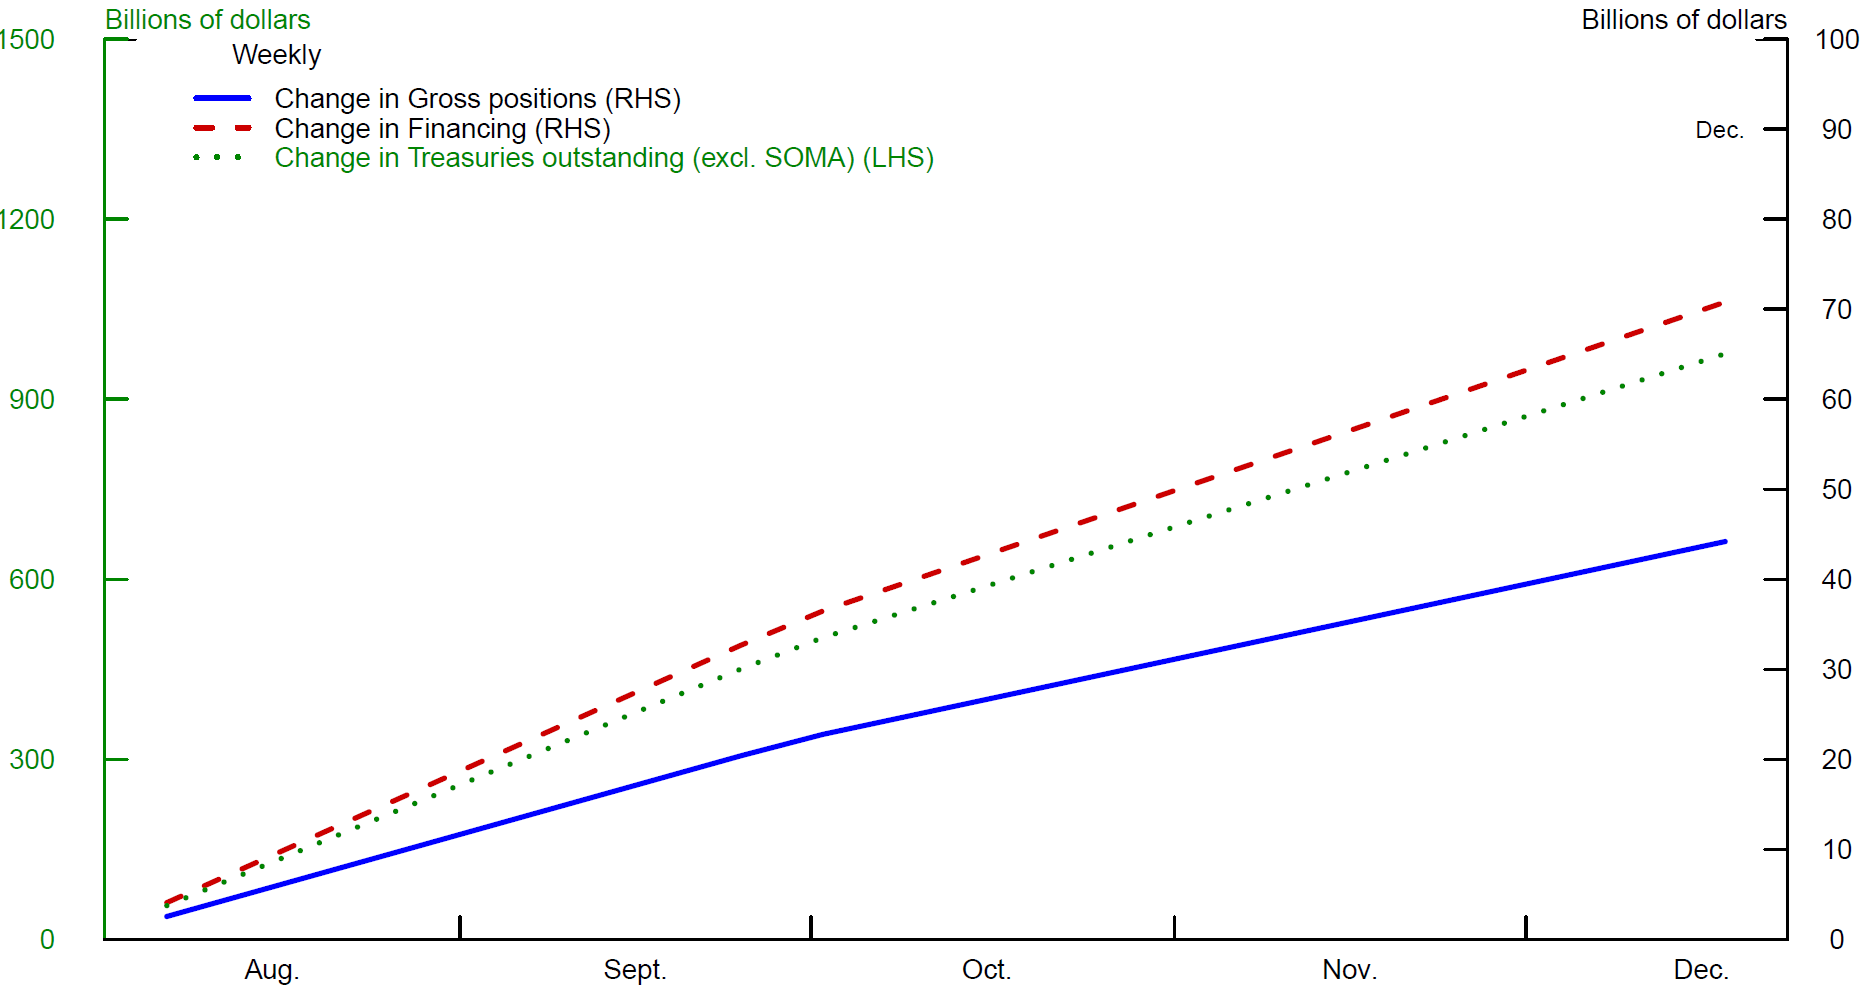
Note: The sample contains all primary dealers. Financing refers to financing for clients (securities borrowing, reverse repo, etc.). Treasury holdings of the SOMA portfolio are excluded from total UST outstanding. We use the U.S. Department of the Treasury's projection of privately-held net marketable borrowing for the Jul. - Sep. 2024 quarter and the Oct. - Dec. 2024 quarter to approximate net changes in Treasuries Outstanding. We take this approximation as an input and estimate changes in dealers' positions and financing based on the relationships estimated over Jun. 2022 - Jul. 2024 as shown in Tables 2 and 3.
Source: FR 2004A, FR 2004C, Treasury Direct, and U.S. Department of the Treasury.
Overall, dealer gross Treasury positions are projected to increase from $820 billion at the end of July 2024 to $864 billion in December 2024, while dealer financing is projected to increase from $2.663 trillion to $2.734 trillion.
Based on the regulatory capital ratios reported in June 2024 and shown in Table 1, dealer balance sheets appear to have ample headroom under the SLR ($7.307 trillion) to absorb the projected increase of $115 billion. Still, changes in other parts of the BHC's balance sheets, particularly bank subsidiaries' holdings of Treasury securities or loan portfolios, could further consume the SLR headroom.
Historical relationship between dealer balance sheets and agency MBS securities held by the public
Relative to their role in the U.S. Treasury market, dealers appear to play an even more important role as market makers in the agency MBS market, though they provide less leverage (through repo) to clients in this market. Dealer positions of agency MBS are quite large, both in terms of magnitude and as a share of agency MBS held by the public. As of March 2024,12 primary dealers' gross positions of agency MBS were approximately $1.06 trillion, with positions increasing 22 percent since March 2012 and 85 percent since the beginning of the QT2 period, as displayed in Figure 4 (solid blue line). In comparison, their gross positions of Treasuries were about $800 billion as of March 2024. Dealer financing of agency MBS was around $280 billion in the beginning of 2024, decreasing by 51 percent between March 2012 and March 2024 (dashed red line). Over the same period, the amount of agency MBS securities held by the public grew from $6.8 trillion to $8.6 trillion (dotted green line), a 26 percent increase and a considerably smaller increase compared to total Treasury securities held by the public.
Figure 4. Primary Dealer Positions and Financing in Agency MBS vs Total Agency MBS Outstanding (excl. SOMA)
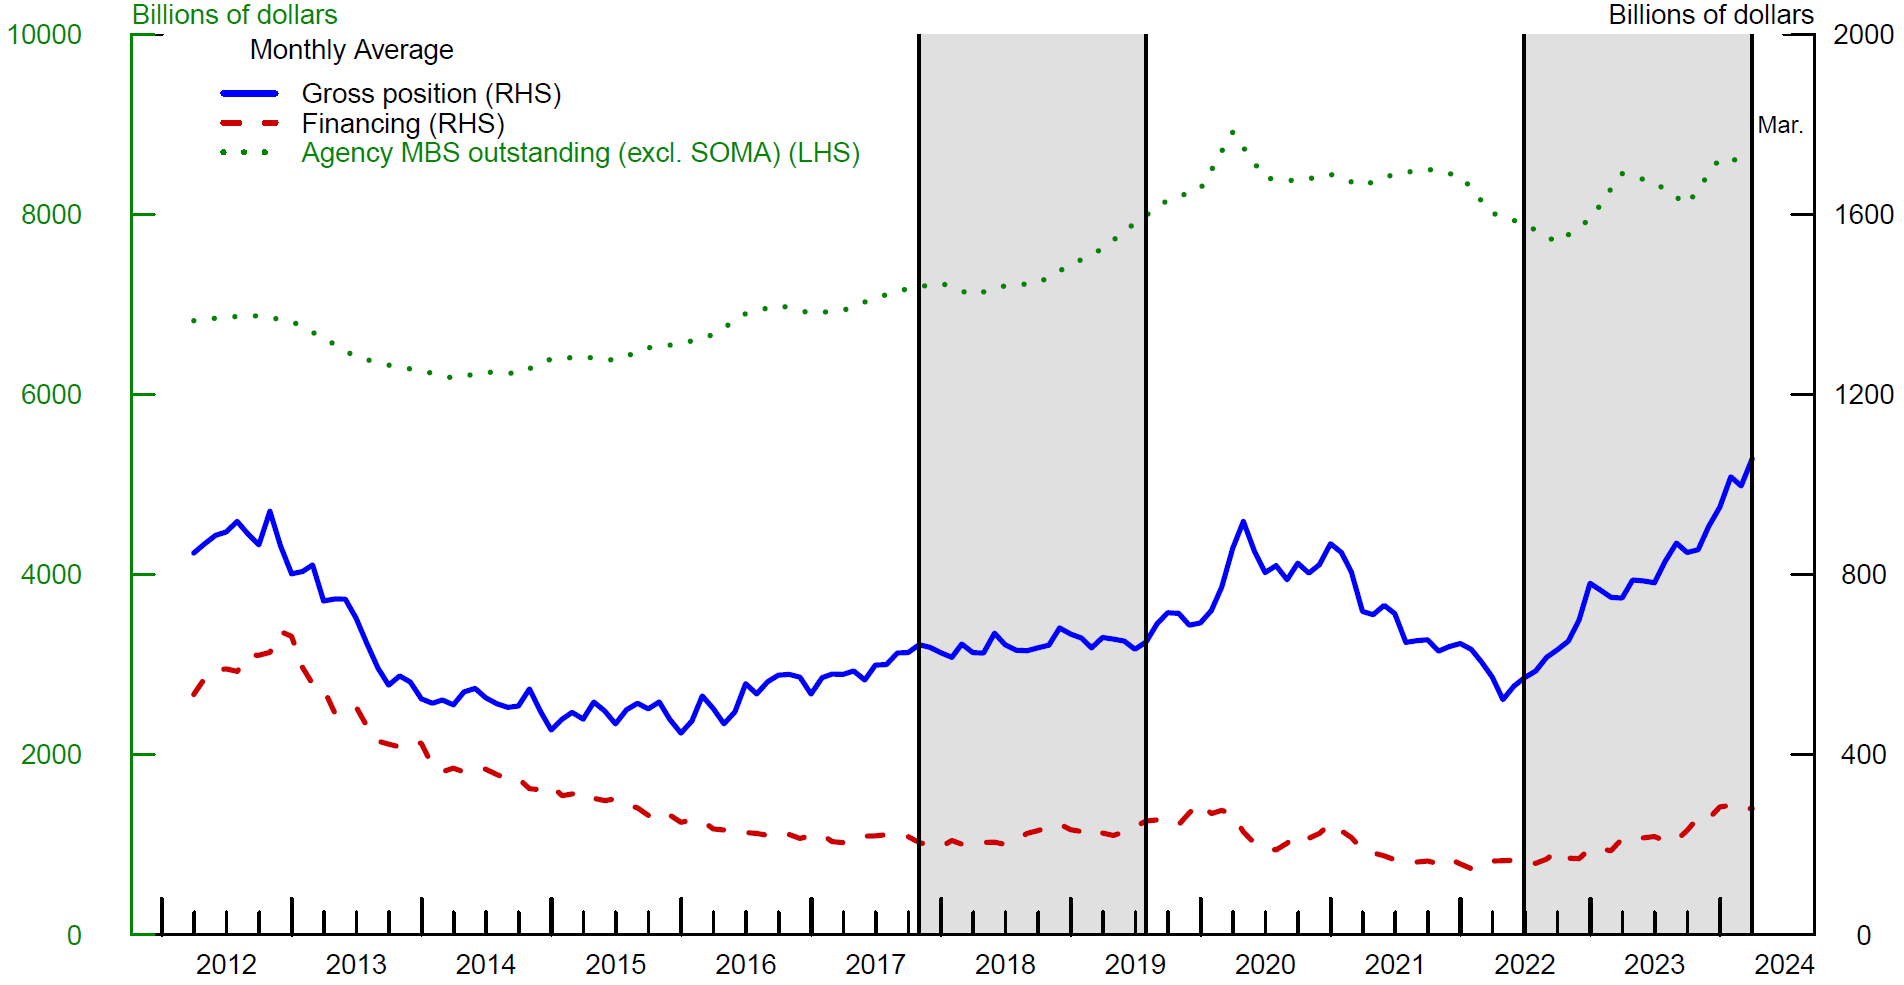
Note: The sample contains all primary dealers. Financing refers to financing for clients (securities borrowing, reverse repo, etc.). Agency MBS holdings of the SOMA portfolio are excluded from total Agency MBS outstanding. The shaded regions represent periods of balance sheet runoff spanning from Oct. 2017 - Jul. 2019 and Jun. 2022 - present.
Source: FR 2004A, FR 2004C, and Z.1 Financial Accounts of the United States.
As shown in Tables 4 and 5, we conduct similar regressions to those discussed for Treasury securities, which show that in general, levels of dealer positions and financing for agency MBS securities are positively related to agency MBS held by the public, and that the sensitivity is highest during the Federal Reserve's current QT period. As shown in the first column of Table 4, between March 2012 and March 2024 (Full period), for every $1 increase in agency MBS held by the public, primary dealers' inventory of agency MBS securities increased by 10.5 cents. Over the 2017-2019 QT period (QT1), the sensitivity was 1.8 cents per dollar, though statistically insignificant (column 2). For the current QT period (QT2) beginning in June 2022, the sensitivity is significantly higher, at 37.4 cents per dollar (column 3). Overall, the larger magnitudes of these coefficients suggest that dealers' agency MBS positions respond more strongly to changes in supply than their Treasury positions, particularly during the current QT period.
Table 4: Regression analysis of Dealer Agency MBS Gross positions vs Total Agency MBS Outstanding (excl. SOMA)
| Full (1) | QT1 (2) | QT2 (3) | |
|---|---|---|---|
| Agency MBS outstanding (excl. SOMA)t-1 | 0.105*** | 0.018 | 0.374*** |
| Observations | 145 | 21 | 22 |
| R2 | 0.381 | 0.068 | 0.719 |
*p<0.1; **p<0.05; ***p<0.01
Note: The sample contains all primary dealers. The full-sample period is Mar. 2012 - Mar. 2024. QT refers to periods of the Federal Reserve's balance sheet normalization. QT1 period is Oct. 2017 - Jul. 2019. QT2 period is Jun. 2022 - Mar. 2024. The data is at monthly frequency using interpolated quarterly data and the regression is in levels.
Source: FR 2004A, FR 2004C, and Z.1 Financial Accounts of the United States.
Table 5 illustrates that dealer financing provided to clients decreased 7.7 cents per dollar increase in agency MBS held by the public between March 2012 and March 2024 (column 1). However, the sensitivity was positive during both QT periods, with an increase of 4.7 cents per dollar during the QT1 period (column 2) and an increase of 11.7 cents per dollar during the QT2 period (column 3). The sensitivity between dealer financing and agency MBS held by the public is larger than for Treasuries during the current QT period. The regression results for both dealer positions and dealer financing highlight that dealers have intermediated a larger share of outstanding agency MBS securities in the current QT period than in the previous QT period. Overall, we expect the amount of agency MBS securities on dealer balance sheets to continue to increase as QT progresses.13
Table 5: Regression analysis of Dealer Agency MBS Financing vs Total Agency MBS Outstanding (excl. SOMA)
| Full (1) | QT1 (2) | QT2 (3) | |
|---|---|---|---|
| Agency MBS outstanding (excl. SOMA)t-1 | -0.077*** | 0.047*** | 0.117*** |
| Observations | 145 | 21 | 22 |
| R2 | 0.268 | 0.429 | 0.693 |
*p<0.1; **p<0.05; ***p<0.01
Note: The sample contains all primary dealers. The full-sample period is Mar. 2012 - Mar. 2024. QT refers to periods of the Federal Reserve's balance sheet normalization. QT1 period is Oct. 2017 - Jul. 2019. QT2 period is Jun. 2022 - Mar. 2024. The data is at monthly frequency using interpolated quarterly data and the regression is in levels.
Source: FR 2004A, FR 2004C, and Z.1 Financial Accounts of the United States.
Non-regulatory constraints on dealer intermediation
In addition to regulatory constraints, dealer intermediation during QT could be limited by internal risk limits, imposed by management at the trading desk level. The most widely used limit by Treasury trading desks is the maximum Value at Risk (VaR), which specifies the maximum level of trading portfolio risk a desk could carry, in terms of a model-calibrated potential loss in a tail event.14
Li, Petrasek, and Tian (2024) find evidence that internal risk limits at Treasury trading desks limit dealers' appetite for risks and their capacity to intermediate in Treasury markets in times of market stress. In particular, dealers are more inclined to reduce their positions as they get closer to their internal risk limit, consistent with such limit being meaningful and costly for traders to breach.
Overall, the likelihood of internal risk limits limiting dealer market making depends crucially on financial market volatility. By design, VaR captures the magnitude of potential tail losses, and is highly sensitive to sharp changes in market volatility. A static portfolio would have substantially higher VaR should market volatility rise. Since the beginning of the Federal Reserve's balance sheet normalization in June 2022, fixed income volatility has been elevated while dealers accumulated large Treasury positions, suggesting that VaR limits on Treasury trading desks may have become more binding. Moreover, further increases in market volatility could significantly increase the effect of internal risk-sensitive limits at fixed income trading desks and limit dealers' willingness and capacity to intermediate in Treasury and MBS markets.
Further Discussion
Our conclusions in this note are subject to a number of caveats and considerable uncertainty. First, we assume that dealer intermediation capacity will remain unchanged over the projection horizon. In practice, dealers are likely to increase their intermediation capacity to accommodate customer demand, including by allocating additional capital for Treasury and MBS intermediation and raising their risk limits at trading desks. Indeed, most dealers reported to the June 2024 Senior Credit Officer Opinion Survey (SCOOS) that they plan to increase their Treasury intermediation capacity in the coming year, largely in response to increased demand from clients.15 Moreover, our estimates assume that dealers are willing to use all their remaining headroom under regulatory capital ratios and internal risk limits to intermediate in Treasury and MBS markets. In practice, dealers may step back from intermediation well before reaching these limits, especially during periods of market stress when they are faced with considerable uncertainty and simultaneous demands on capital and liquidity from other lines of their business.
1. We thank Rochelle Edge, Dan Li, Bert Loudis, and Min Wei for helpful comments. Return to text
2. Li, Dan and Petrasek, Lubomir and Tian, Mary H., Risk-averse Dealers in a Risk-free Market – The Role of Internal Risk Limits (March 1, 2024). Available at SSRN: https://ssrn.com/abstract=4824250 Return to text
3. Primary dealer balance sheets are an imperfect proxy for total intermediation capacity. While primary dealers still play a central role in intermediating Treasury and MBS markets, changes to market structure in recent years (e.g., the use of electronic trading, the entrance of non-dealer participants like PTFs, and the increased use of cleared repo) have decreased market participants' reliance on dealer balance sheets for intermediation. Return to text
4. All registered broker dealers are also subject to SEC regulations such as the net capital rule, which requires them to maintain a minimum level of liquid assets. These requirements are likely to be less stringent than those imposed through bank regulations on BHC-affiliated dealers. Return to text
5. The SLR formula measures Tier 1 capital, which consists mostly of common and preferred stock, as a percent of total leverage exposure. The total leverage exposure (denominator) is a broad measure of a bank's assets and includes a bank's on- and off-balance sheet items. Return to text
6. The most binding capital requirement determines the minimum level of capital (Tier 1, CET1, or total) that BHCs are required to hold under the different risk-based and non-risk-based capital rules. Return to text
7. These estimates are based on regulatory capital ratios as of June 2024 and assume that other balance sheet items will remain unchanged. In practice, the dealer balance sheet capacity will depend on the evolution of other BHC balance sheet items, including loans, reserves and securities held by the depository institution. Return to text
8. The Federal Reserve SOMA holdings include Treasury and Agency MBS securities acquired through open market operations, including through large scale asset purchase programs (LSAPs) to support the smooth functioning of markets and support the Federal Reserve's macroeconomic objectives. Return to text
9. The difference between QT1 and QT2 coefficients is statistically significant for gross positions, but not for financing. Return to text
10. The U.S. Department of the Treasury's Quarterly Refunding Statement: 2024 - 3rd Quarter provides estimates of privately-held net marketable borrowing for the July to September 2024 quarter and October to December 2024 quarter which are used to project net changes in Treasuries Outstanding. Return to text
11. This estimate is calculated by summing dealers' gross Treasury positions and dealer financing and assumes no balance sheet netting of dealer repo. In practice, the balance sheet effect of Treasury financing is likely reduced by about 40% due to balance sheet netting. Return to text
12. Data for agency MBS outstanding is available through March 2024, so our analysis period is March 2012-March 2024. Return to text
13. We are unable to project dealer positions and financing of agency MBS, given the lack of data for projected net agency MBS outstanding. Return to text
14. VaR is defined as the 95th or 99th percentile measurement of the risk of future financial loss in the value of the trading desk's aggregated positions over a one-day holding period, based on current market conditions. Return to text
15. The SCOOS collects qualitative information on changes in credit terms and conditions in securities financing and over-the-counter (OTC) derivatives markets, along with a set of special questions each quarter. The 23 institutions participating in the survey account for almost all dealer financing of dollar-denominated securities to nondealers. The full results of the June SCOOS are available at: https://www.federalreserve.gov/data/scoos/scoos-202406.htm. Return to text
Cochran, Paul, Lubomir Petrasek, Zack Saravay, Mary Tian, and Edward Wu (2024). "Assessment of Dealer Capacity to Intermediate in Treasury and Agency MBS Markets," FEDS Notes. Washington: Board of Governors of the Federal Reserve System, October 22, 2024, https://doi.org/10.17016/2380-7172.3610.
Disclaimer: FEDS Notes are articles in which Board staff offer their own views and present analysis on a range of topics in economics and finance. These articles are shorter and less technically oriented than FEDS Working Papers and IFDP papers.