FEDS Notes
July 12, 2024
Central Clearing Counterparties in the Financial Accounts of the United States
Matthew Guse, Matthew Hoops, and Maria Perozek1
Introduction
The March 7, 2024, release of the Z.1 Financial Accounts of the United States (the Accounts) introduced a new supplementary table, Central Clearing Counterparties (table L.132.c), which separately reports financial assets and liabilities of central clearing counterparties (CCPs). CCPs in the Accounts are financial intermediaries that support the functioning of financial markets by taking on counterparty credit risk and providing clearing and settlement of securities and derivatives.2 In the United States, CCPs clear a large majority of securities and derivatives transactions in the markets they operate in and are therefore critical to the functioning and stability of the financial system. For example, in 2022, the three subsidiaries of the Depository Trust and Clearing Corporation (DTCC) collectively processed $2.5 quadrillion in securities transactions and the Chicago Mercantile Exchange (CME) Group processed clearing transfers of $6 billion each day.3
The purpose of this note is to describe the important role that CCPs play in financial markets and to discuss their relevance in financial statistics, with particular focus on how the assets and liabilities of CCPs are measured and classified in the Accounts. The note will also highlight notable developments that influenced the growth of CCP balance sheet assets and changes in the composition of holdings over time.
Background
CCPs in the Accounts are designated financial market utilities (FMUs) that provide clearing and settlement services for a large share of securities and derivatives transactions.4 In this role, CCPs act as the counterparty to both the buyer and seller in a transaction, guaranteeing payment if the other party defaults. This central counterparty structure allows the CCP to facilitate multilateral netting of exposures across the clearing members, which typically reduces the amount of funds needed to settle transactions. This system also promotes financial stability by eliminating counterparty risk for the participants and mitigating knock-on effects that could otherwise be triggered by a large single counterparty default.
To manage the risks associated with guaranteeing clearing and settlement activity, CCPs require clearing members to make margin deposits and contribute to clearing funds, which can be used to offset large losses, such as the simultaneous default of two large clearing members. If an individual counterparty's margin deposits are insufficient to cover its obligations, the total pool of clearing funds is available to cover additional losses, further reducing the risk of significant loss and potential knock-on effects in the financial system.
Central Clearing Counterparties in the Accounts
Since the 2008-2009 global financial crisis (GFC), there has been increased demand for official statistics on CCPs. In particular, proposed updates to the international guidelines that govern the compilation of the Accounts, known as the System of National Accounts (SNA), recommend that CCPs be separately identified in the financial accounts as a subsector of other financial corporations.5 The G20 Data Gaps Initiative phase II, recommendation II.5 also requests detailed data on nonbank financial intermediaries, including CCPs, to be reported within the SNA framework.6 In response to this increased demand, Board staff began compiling publicly available data on CCPs for use in the Accounts. CCP statistics are now integrated in the Accounts and are provided for international data collections such as the Financial Stability Board Nonbank Financial Intermediary annual monitoring exercise.7
In the March 10, 2022, Z.1 release, financial assets and liabilities of CCPs were incorporated into the Accounts' other financial business sector (tables F.132 and L.132).8 The sector currently includes five CCPs: the Chicago Mercantile Exchange; ICE Clear Credit; the Options Clearing Corporation; and two of three subsidiaries of the Depository Trust and Clearing Corporation, the Fixed Income Clearing Corporation, and the National Securities Clearing Corporation. Three of the eight designated FMUs are not considered CCPs because they do not interpose themselves between counterparties in trades and positions.9,10,11 More recently, in the March 7, 2024, Z.1 release, a new supplementary table, Central clearing counterparties (table L.132.c), was added to provide detail on financial assets and liabilities of CCPs separately from other entities in the other financial business sector.
Source data for each of the five CCPs in the Accounts are obtained from public annual and quarterly financial statements beginning 2000:Q1.12 The financial statements provide balance sheet information, including clearing fund investments and liabilities, cash and other assets, and other liabilities.
The assets of CCPs primarily consist of margin and clearing fund contributions from members that can be in the form of cash, securities, or other non-cash assets. Only cash margin, cash contributions, or securities where economic ownership is transferred to the CCP are recorded as assets on the CCP balance sheet.13 For these contributions, a corresponding liability to clearing members is also recorded. In the Accounts, these collective liabilities are called "clearing fund contributions" and are classified as loans in the financial instrument category "other loans and advances" (tables F.216 and L.216).14 This aligns with the current Accounts treatment of securities brokers and dealers' payables to customers, which include margin deposits, and are also classified as loans. In the SNA, margin deposits may be classified as other deposits under certain circumstances, but such a classification is ruled out in this case for two reasons. First, these contributions are not available for discretionary withdrawal by members and are returned at settlement; second, only repayable margin deposits may be classified as deposits; however, CCP financial statements do not contain sufficient detail to separately identify margin deposits from other clearing fund contributions in most cases.15
CCPs in the Financial Accounts Tables
The new supplementary table for CCPs in the Accounts (L.132.c, shown below) records the financial assets and liabilities of CCPs separately from other entities captured in the other financial business sector.16 On the liability side, line 10 shows other loans and advances (clearing fund contributions), which accounts for almost all CCP liabilities. Table L.216 (also shown below) from the core Accounts shows the sector counterparties to these contributions. Security brokers and dealers claims on CCPs for clearing fund contributions account for around 60 percent of the total in 2023:Q4, while U.S.-chartered depository institutions account for 9 percent.17 The remainder is attributed to other non-CCP entities in the other financial business sector because there is no readily available data to distinguish other counterparties, which may include insurance companies, asset managers, and entities in the rest of the world. Other CCP liabilities on L.132.c include relatively small amounts of commercial paper (line 11), and other miscellaneous liabilities (line 12).18
Table 1: L.132.c Central Clearing Counterparties (1)
Billions of dollars; amounts outstanding end of period, not seasonally adjusted
| 2021 | 2022 | 2023 | 2022 | 2023 | |||||||
|---|---|---|---|---|---|---|---|---|---|---|---|
| Q3 | Q4 | Q1 | Q2 | Q3 | Q4 | ||||||
| 1 | FL504090025 | Total financial assets | 287.5 | 260.3 | 236.6 | 265.1 | 260.3 | 262.9 | 248.0 | 221.9 | 236.6 |
| 2 | FL503020025 | Checkable deposits and currency | 233.7 | 212.4 | 167.9 | 218.2 | 212.4 | 208.6 | 183.6 | 160.0 | 167.9 |
| 3 | FL713129003 | Federal Reserve deposits | 216.7 | 192.1 | 148.6 | 201.1 | 192.1 | 187.8 | 164.9 | 140.9 | 148.6 |
| 4 | FL503020023 | Other | 16.9 | 20.3 | 19.2 | 17.1 | 20.3 | 20.8 | 18.7 | 19.0 | 19.2 |
| 5 | FL503034023 | Money market fund shares | 3.7 | 0 | 0 | 0 | 0 | 0 | 0 | 0 | 0 |
| 6 | FL502051023 | Security repurchase agreements | 3.6 | 3.9 | 5.4 | 4.4 | 3.9 | 5.0 | 4.3 | 5.1 | 5.4 |
| 7 | FL503061123 | Treasury securities | 45.5 | 42.8 | 62.3 | 41.5 | 42.8 | 48.2 | 59.1 | 55.7 | 62.3 |
| 8 | FL503093023 | Miscellaneous assets | 1.0 | 1.1 | 1.0 | 1.0 | 1.1 | 1.0 | 1.0 | 1.1 | 1.0 |
| 9 | FL504190025 | Total liabilities | 285.5 | 258.1 | 234.4 | 263.0 | 258.1 | 260.7 | 245.8 | 219.6 | 234.4 |
| 10 | FL503169023 | Other loans and advances (2) | 272.1 | 242.4 | 219.7 | 250.0 | 242.4 | 244.9 | 231.5 | 205.2 | 219.7 |
| 11 | FL503169123 | Commercial paper | 8.3 | 9.1 | 9.1 | 7.9 | 9.1 | 9.2 | 7.7 | 7.9 | 9.1 |
| 12 | FL503193023 | Miscellaneous liabilities | 5.1 | 6.6 | 5.6 | 5.0 | 6.6 | 6.5 | 6.6 | 6.6 | 5.6 |
(1) Central clearing counterparties are included in the other financial business sector (tables F.132 and L.132). Return to table
(2) Clearing fund contributions listed on table L.216. Return to table
Table 2: L.216 Other Loans and Advances
Billions of dollars; amounts outstanding end of period, not seasonally adjusted
| 2021 | 2022 | 2023 | 2022 | 2023 | |||||||
|---|---|---|---|---|---|---|---|---|---|---|---|
| Q3 | Q4 | Q1 | Q2 | Q3 | Q4 | ||||||
| 41 | FL503169023 | Clearing funds at other financial business | 272.1 | 242.4 | 219.7 | 250.0 | 242.4 | 244.9 | 231.5 | 205.2 | 219.7 |
| 42 | FL763069023 | Asset: U.S.-chartered depository institutions | 18.1 | 14.9 | 20.0 | 13.5 | 14.9 | 18.1 | 18.4 | 19.4 | 20.0 |
| 43 | FL663069025 | Brokers and dealers | 199.5 | 182.4 | 132.9 | 197.9 | 182.4 | 175.4 | 150.5 | 119.7 | 132.9 |
| 44 | FL503069025 | Other financial business | 54.5 | 45.2 | 66.9 | 38.7 | 45.2 | 51.5 | 62.6 | 66.1 | 66.9 |
On the asset side of the CCP balance sheet, nearly all $236.6 billion in total financial assets shown in line 1 on table L.132.c for 2023:Q4 are held in highly liquid assets, reflecting the need for funds to be available for immediate use to manage margin or in the event of a member default. The largest share of liquid assets is held in deposits, primarily Federal Reserve deposits (line 3), which accounted for 62.8 percent in 2023:Q4. Treasury securities (line 7) were 26.3 percent and also account for a significant portion of CCP assets for the same period. Other types of assets, such as money market funds (line 5), security repurchase agreements (line 6), and miscellaneous assets (line 8), each account for a small share of the total.
In the core sector tables in the Accounts, CCPs are included in the other financial business (OFB) sector, tables F.132 and L.132, along with other financial corporations that are not captured elsewhere in the Accounts.19 In the L.132 table shown below, lines 1, 2, 3, 4, 7, 13 include assets of CCPs, and lines 14, 15, 17, 19, 21, and 25 include liabilities of CCPs. Notably, the clearing fund contributions to CCPs account for virtually all other loans and advances liabilities for the sector (line 21).
Table 3: L.132 Other Financial Business (1)
Billions of dollars; amounts outstanding end of period, not seasonally adjusted
| 2021 | 2022 | 2023 | 2022 | 2023 | |||||||
|---|---|---|---|---|---|---|---|---|---|---|---|
| Q3 | Q4 | Q1 | Q2 | Q3 | Q4 | ||||||
| 1 | FL504090005 | Total financial assets | 1350.2 | 1261.9 | 1302.1 | 1249.9 | 1261.9 | 1291.4 | 1238.4 | 1294.7 | 1302.1 |
| 2 | FL503020005 | Checkable deposits and currency | 236.9 | 214.8 | 169.4 | 220.9 | 214.8 | 211.0 | 186.0 | 162.1 | 169.4 |
| 3 | FL503034005 | Money market fund shares | 599.8 | 408.2 | 427.3 | 423.1 | 408.2 | 455.8 | 453.9 | 460.5 | 427.3 |
| 4 | FL502051005 | Security repurchase agreements | 3.6 | 3.9 | 5.4 | 4.4 | 3.9 | 5.0 | 4.3 | 5.1 | 5.4 |
| 5 | FL504022005 | Debt securities | 301.0 | 441.4 | 491.5 | 403.4 | 441.4 | 412.7 | 382.0 | 428.2 | 491.5 |
| 6 | FL503069105 | Open market paper | 180.5 | 326.1 | 359.2 | 287.3 | 326.1 | 289.2 | 248.0 | 298.7 | 359.2 |
| 7 | FL503061123 | Treasury securities | 45.5 | 42.8 | 62.3 | 41.5 | 42.8 | 48.2 | 59.1 | 55.7 | 62.3 |
| 8 | FL503063005 | Corporate and foreign bonds | 70.9 | 69.6 | 70.0 | 71.7 | 69.6 | 72.3 | 71.9 | 70.9 | 70.0 |
| 9 | FL503062003 | Municipal securities | 4.1 | 2.9 | 0 | 2.9 | 2.9 | 2.9 | 2.9 | 2.9 | 0 |
| 10 | FL503069005 | Loans (other loans and advances) | 99.3 | 83.0 | 91.8 | 80.5 | 83.0 | 88.8 | 97.0 | 100.3 | 91.8 |
| 11 | FL503064105 | Corporate equities | 0 | 0 | 0 | 0 | 0 | 0 | 0 | 0 | 0 |
| 12 | FL503094505 | Equity investment in affiliates | 108.5 | 109.4 | 115.6 | 116.6 | 109.4 | 117.1 | 114.2 | 137.5 | 115.6 |
| 13 | FL503093023 | Miscellaneous assets | 1.0 | 1.1 | 1.0 | 1.0 | 1.1 | 1.0 | 1.0 | 1.1 | 1.0 |
| 14 | FL504194005 | Total liabilities and equity | 3520.5 | 3212.8 | 3421.1 | 3086.7 | 3212.8 | 3158.0 | 3182.2 | 3270.3 | 3421.1 |
| 15 | FL504190005 | Total liabilities | 1328.9 | 1246.5 | 1294.7 | 1232.0 | 1246.5 | 1276.0 | 1225.0 | 1280.6 | 1294.7 |
| 16 | FL504122005 | Debt securities | 120.6 | 117.4 | 128.2 | 125.6 | 117.4 | 138.3 | 123.3 | 149.8 | 128.2 |
| 17 | FL503169105 | Open market paper | 120.6 | 117.4 | 128.2 | 125.6 | 117.4 | 138.3 | 123.3 | 149.8 | 128.2 |
| 18 | FL503163003 | Corporate bonds | 0 | 0 | 0 | 0 | 0 | 0 | 0 | 0 | 0 |
| 19 | FL504123005 | Loans | 295.4 | 260.1 | 229.5 | 269.0 | 260.1 | 261.7 | 247.2 | 219.5 | 229.5 |
| 20 | FL713068505 | Depository institution loans n.e.c. | 21.0 | 15.3 | 7.4 | 16.6 | 15.3 | 14.4 | 13.3 | 12.0 | 7.4 |
| 21 | FL503169005 | Other loans and advances | 274.4 | 244.8 | 222.0 | 252.4 | 244.8 | 247.3 | 233.9 | 207.5 | 222.0 |
| 22 | FL503192305 | Foreign direct investment: intercompany debt | 0 | 0 | 0 | 0 | 0 | 0 | 0 | 0 | 0 |
| 23 | FL503190005 | Miscellaneous liabilities | 912.9 | 869.0 | 937.0 | 837.4 | 869.0 | 876.1 | 854.5 | 911.2 | 937.0 |
| 24 | FL663070675 | Securities lending (net) | 685.8 | 672.4 | 676.3 | 693.4 | 672.4 | 699.5 | 695.9 | 685.4 | 676.3 |
| 25 | FL503193005 | Other | 227.1 | 196.6 | 260.7 | 144.1 | 196.6 | 176.6 | 158.6 | 225.8 | 260.7 |
| 26 | FL503181105 | Total equity | 2191.6 | 1966.3 | 2126.4 | 1854.7 | 1966.3 | 1882.0 | 1957.3 | 1989.7 | 2126.4 |
| 27 | LM503164105 | Corporate equities (market value) | 2170.4 | 1950.9 | 2119.0 | 1836.8 | 1950.9 | 1866.6 | 1943.9 | 1975.6 | 2119.0 |
| 28 | LM503192103 | Foreign direct investment: equity | 0 | 0 | 0 | 0 | 0 | 0 | 0 | 0 | 0 |
| 29 | LM503194305 | Equity interest under PPIP | 0 | 0 | 0 | 0 | 0 | 0 | 0 | 0 | 0 |
| 30 | FL503194205 | Equity in Federal Reserve facilities (2) | 21.3 | 15.4 | 7.4 | 17.9 | 15.4 | 15.4 | 13.4 | 14.1 | 7.4 |
(1) Includes funding subsidiaries, custodial accounts for reinvested collateral of securities lending operations, funds associated with the Public-Private Investment Program (PPIP), Federal Reserve funding, credit, and liquidity facility special purpose vehicles (SPV) created in response to the 2008 Financial Crisis and COVID-19 pandemic, and U.S. central clearing parties. Return to table
(2) U.S. Treasury Exchange Stabilization Fund Economic Recovery Programs investment in Federal Reserve SPVs. Return to table
Historical Trends in the Data
This section highlights a few notable changes in financial assets and shifts in portfolio holdings of CCPs over time. First, we note that CCP assets tend to increase markedly during times of financial stress; for instance, during the GFC in 2008 and again at the onset of the COVID pandemic in 2020, CCP financial assets nearly doubled over a single quarter. As shown in Figure 1 below, total financial assets increased from $38.4 billion to $70.3 billion during the GFC from 2008:Q3 to 2008:Q4. Figure 1 also shows that CCP financial assets spiked at the outset of the COVID pandemic, increasing from $121.3 billion in 2019:Q4 to $227.2 billion in 2020:Q1. As noted above, CCPs holdings of assets are driven by the clearing fund contribution liabilities. During periods of high market volatility where daily financial market prices are changing rapidly, members may be required to increase margin and clearing fund contributions to mitigate risk. Indeed, volatility increased sharply during both episodes in 2008:Q4 and 2020:Q1, and required margin and clearing contributions increased in these quarters.20
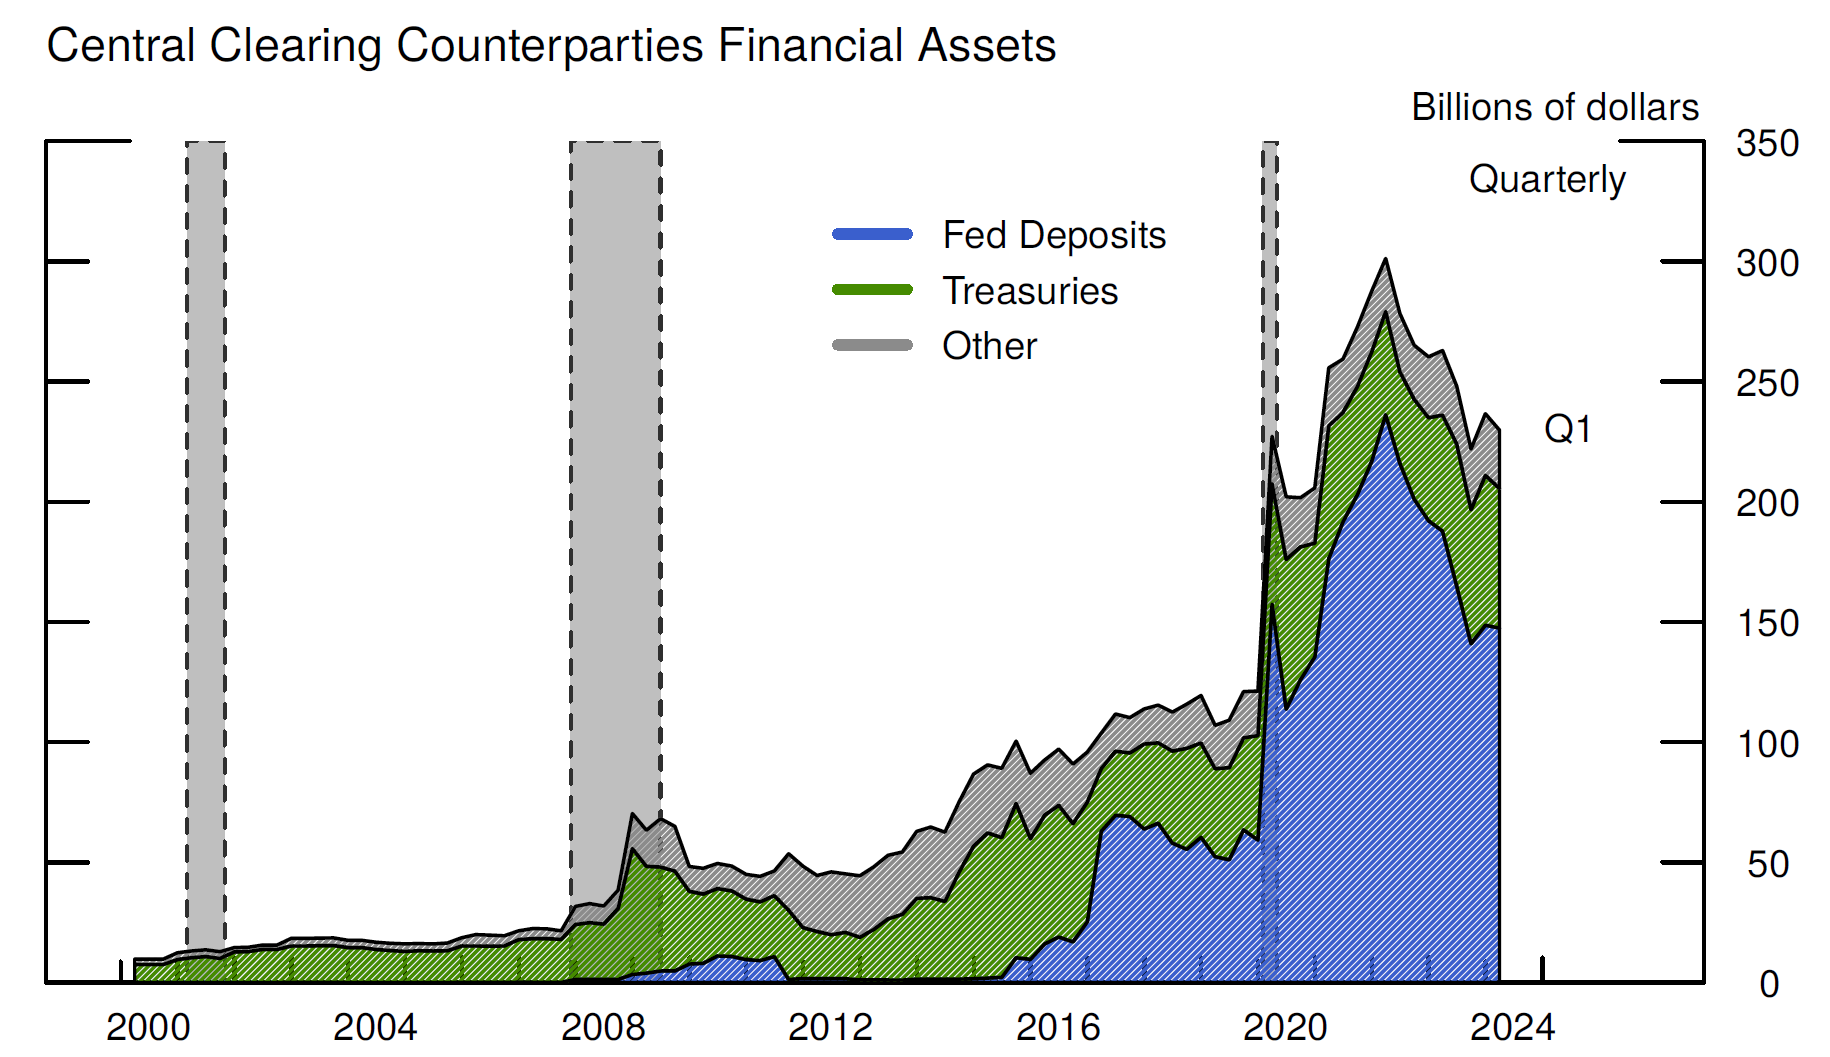
Notes: Key identifies series in order from bottom to top. Other includes other checkable deposits and currency, money market fund shares, security repurchase agreements, and miscellaneous assets. Gray shaded vertical areas with dashed borders indicate recession periods as dated by the National Bureau of Economic Research: March 2001-November 2001, December 2007-June 2009, and February 2020-April 2020.
Source: Financial Accounts of the United States, June 7, 2024.
Another notable historical development concerns the reallocation of CCP financial assets from Treasury securities to deposits at Federal Reserve banks (Fed deposits) over the period 2015:Q3 through 2017:Q1. During this period, CCPs gained access to Fed deposits after being designated as systemically important by the Financial Stability Oversight Council (FSOC). Figure 1 shows that Fed deposits reported in the Accounts (the blue shaded area) increased from 2.5 percent of total financial assets in 2015:Q2 to 60.7 percent of assets in 2017:Q1.21 The offset mainly stems from a shift out of Treasury securities (green shaded area) which decreased from 65.2 percent of assets to 25.1 percent of assets over the same time frame.
Conclusion
CCPs play a critical role in U.S. financial system, providing the infrastructure for the clearing and settlement of securities and derivatives, as well as mitigating counterparty risk in financial markets. Data on the financial assets and liabilities of CCPs are an important addition to the Financial Accounts of the United States, providing visibility to an important group of entities not previously captured in the Accounts. CCPs are recorded within the other financial business sector but are also detailed separately on a new supplementary table, L.132.c, which was introduced in the March 7, 2024, Z.1 release.
1. Division of Research and Statistics, Federal Reserve Board. We thank Elizabeth Holmquist, Edward Anderson, and Julia Barmeier for their helpful comments, and Victoria Chbane, Nyssa Kim, and Natalia Kreciglowa for their valuable assistance. Return to text
2. CCPs are defined by the Bank of International Settlements as an "entity that interposes itself between counterparties to contracts traded in one or more financial markets, becoming the buyer to every seller and the seller to every buyer and thereby ensuring the performance of open contracts". Return to text
3. For more information on DTCC see https://www.dtcc.com/annuals/2022/performance/. For information on CME see https://www.cmegroup.com/solutions/clearing.html. Return to text
4. In 2012, the Financial Stability Oversight Council (FSOC) designated eight entities as systematically important FMUs, recognizing their critical role in clearing a large majority of trades in the markets they operate in, and in mitigating risk to the financial system. For additional information on FSOC designations see https://home.treasury.gov/policy-issues/financial-markets-financial-institutions-and-fiscal-service/fsoc/designations. For more details on designated financial market utilities see https://www.federalreserve.gov/paymentsystems/designated_fmu_about.htm. Return to text
5. The Accounts are compiled according to System of National Accounts (SNA) 2008 guidelines, a robust national economic accounting framework that is internationally accepted and internationally comparable. See https://unstats.un.org/unsd/nationalaccount/docs/SNA2008.pdf. For 2008 SNA update recommendations on financial sectoring, including CCPs, see the endorsed guidance notes F.1 and F.6 https://unstats.un.org/unsd/nationalaccount/SNAUpdate/GuidanceNotes.asp. Return to text
6. For details on G-20 Data Gaps Initiative phase II see https://www.imf.org/en/News/Seminars/Conferences/DGI/g20-dgi-recommendations#dgi2. Return to text
7. For information on the annual monitoring exercise see https://www.fsb.org/work-of-the-fsb/financial-innovation-and-structural-change/non-bank-financial-intermediation/ Return to text
8. The other financial business sector includes financial corporations not elsewhere classified in the Accounts. For more information, see the table description for F.132 and L.132 https://www.federalreserve.gov/apps/fof/Guide/z1_tables_description.pdf. Return to text
9. Depository Trust Company (DTC) is a central securities depository and securities settlement system structured as a limited-purpose trust company under New York State banking law and files Call Report FFIEC 041. It is included in the U.S.-chartered depository institutions sector (tables F.111 and L.111). Return to text
10. CLS Bank International settles foreign exchange transactions. It is structured as is an Edge Act corporation owned by a foreign parent and files Call Report FR 2886b. It is included in the Financial Accounts foreign banking offices in the U.S. sector (tables F.112 and L.112). Return to text
11. Clearing House Payments Company L.L.C., which operates the Clearing House Interbank Payments System (CHIPS), is a bank-owned multilateral payments system for large dollar payments. It is not currently included in the Accounts because public financial statements are not readily available; however, the firm does not require clearing fund contributions and therefore holds relatively few assets. See https://www.theclearinghouse.org/payment-systems/chips. Return to text
12. Although designated FMUs are supervised by the federal agency that has primary jurisdiction under federal banking, securities, or commodity futures laws, data collected for supervisory purposes are confidential and cannot be published in the Z.1 Accounts. Return to text
13. Clearing members can also use securities as collateral to satisfy requirements for clearing fund contributions where the clearing member retains economic ownership, or the ownership right to accrue the benefits, but also incurs the risks of holding the asset. In accordance with SNA 2008 guidelines, these securities are not included on the CCP balance sheet and are not treated as assets of CCPs in the Accounts; however, such securities can be used to satisfy obligations of members in the case of default. Securities on deposit where economic ownership remains with the depositor can be substantial and exceed cash contributions. For instance, CME Group Inc.'s 2023 10-K statement reports total on-balance sheet clearing fund cash contributions of $90.2 billion, while off-balance sheet non-cash and other deposits amounted to $189.1 billion. Return to text
14. CCPs have differing terminology and rules for the required margin deposits and clearing fund contributions which are explained in each firm's financial statement notes. Return to text
15. SNA 2008 notes it is difficult to distinguish loans and deposits in some cases. SNA recommends classifying repayable margin deposits as other deposits if the depositor retains economic ownership, and the assets are available for discretionary withdrawal. Clearing fund contributions and margin deposits represent a direct and non-negotiable position, with no possibility of discretionary withdrawal, between CCPs and their members, which is in line with the SNA 2008 definition of loans. SNA guidelines offer other accounts payable and receivable as an alternative classification. Staff may revisit this classification in the future. Return to text
16. Data for all tables are from the Z.1 Financial Accounts of the United States, June 7, 2024, release. Return to text
17. Data for securities brokers and dealers are from SEC tabulations of FOCUS and FOGS reports. Data for U.S.-chartered depository institutions are from Federal Reserve forms FFIEC 031, 041 and 051. Return to text
18. Commercial paper (CP) liabilities of CCPs are solely issued by the National Securities Clearing Corporation (NSCC). NSCC invests the proceeds from CP issuance in highly liquid instruments that can be used as an additional backstop in the event of a clearing member default. Miscellaneous liabilities are computed residually by subtracting identified liabilities from total liabilities and include items such as payables to members. Return to text
19. Other entities in the sector include certain subsidiaries of foreign bank and nonbank financial firms, broker dealer custodial accounts for cash collateral, and several Federal Reserve funding, credit, liquidity, and loan facilities. For details on Federal Reserve facilities in the Accounts see: Hoops, Matthew, and Robert J. Kurtzman (2021). "Accounting for COVID-19 Related Funding, Credit, Liquidity, and Loan Facilities in the Financial Accounts of the United States," FEDS Notes. Washington: Board of Governors of the Federal Reserve System, July 30, 2021. Return to text
20. For historical price data on the VIX index see https://www.cboe.com/tradable_products/vix/vix_historical_data/. Return to text
21. It is important to note that Federal Reserve data on the deposits of specific entities are confidential and not available for publication in the Accounts; therefore, data from public financial statements are collected and utilized for the time series on Fed deposits. Return to text
Guse, Matthew, Matthew Hoops, and Maria Perozek (2024). "Central Clearing Counterparties in the Financial Accounts of the United States," FEDS Notes. Washington: Board of Governors of the Federal Reserve System, July 12, 2024, https://doi.org/10.17016/2380-7172.3540.
Disclaimer: FEDS Notes are articles in which Board staff offer their own views and present analysis on a range of topics in economics and finance. These articles are shorter and less technically oriented than FEDS Working Papers and IFDP papers.