FEDS Notes
November 12, 2024
Country-Specific Effects of Euro-Area Monetary Policy: The Role of Sectoral Differences1
Ruslana Datsenko2 and Johannes Fleck3
Economic growth in some euro area countries has been lackluster since the COVID-19 pandemic. Concurrently, the ECB hiked its policy rate to fight inflation. In this note, we show that high interest rates have depressed economic activity more in those euro-area countries with large manufacturing sectors. Our analysis also suggests that activity in those countries stands to gain more from lower interest rates.
Introduction
In response to a burst of inflation, the European Central Bank (ECB) rapidly hiked its deposit interest rate from -0.5 to 4 percent between July 2022 and September 2023, as illustrated by the left panel of Figure 1. The bank then maintained this peak rate for about ten months until it cut the rate by 25 basis points in June, September and October 2024. Currently, market participants expect the ECB to cut further, for two reasons. First, euro-area headline inflation has declined from its record high of 10.6 percent in October 2022 to 1.8 percent in September 2024 and the latest ECB projections see inflation at or below 2 percent from 2025Q4.4
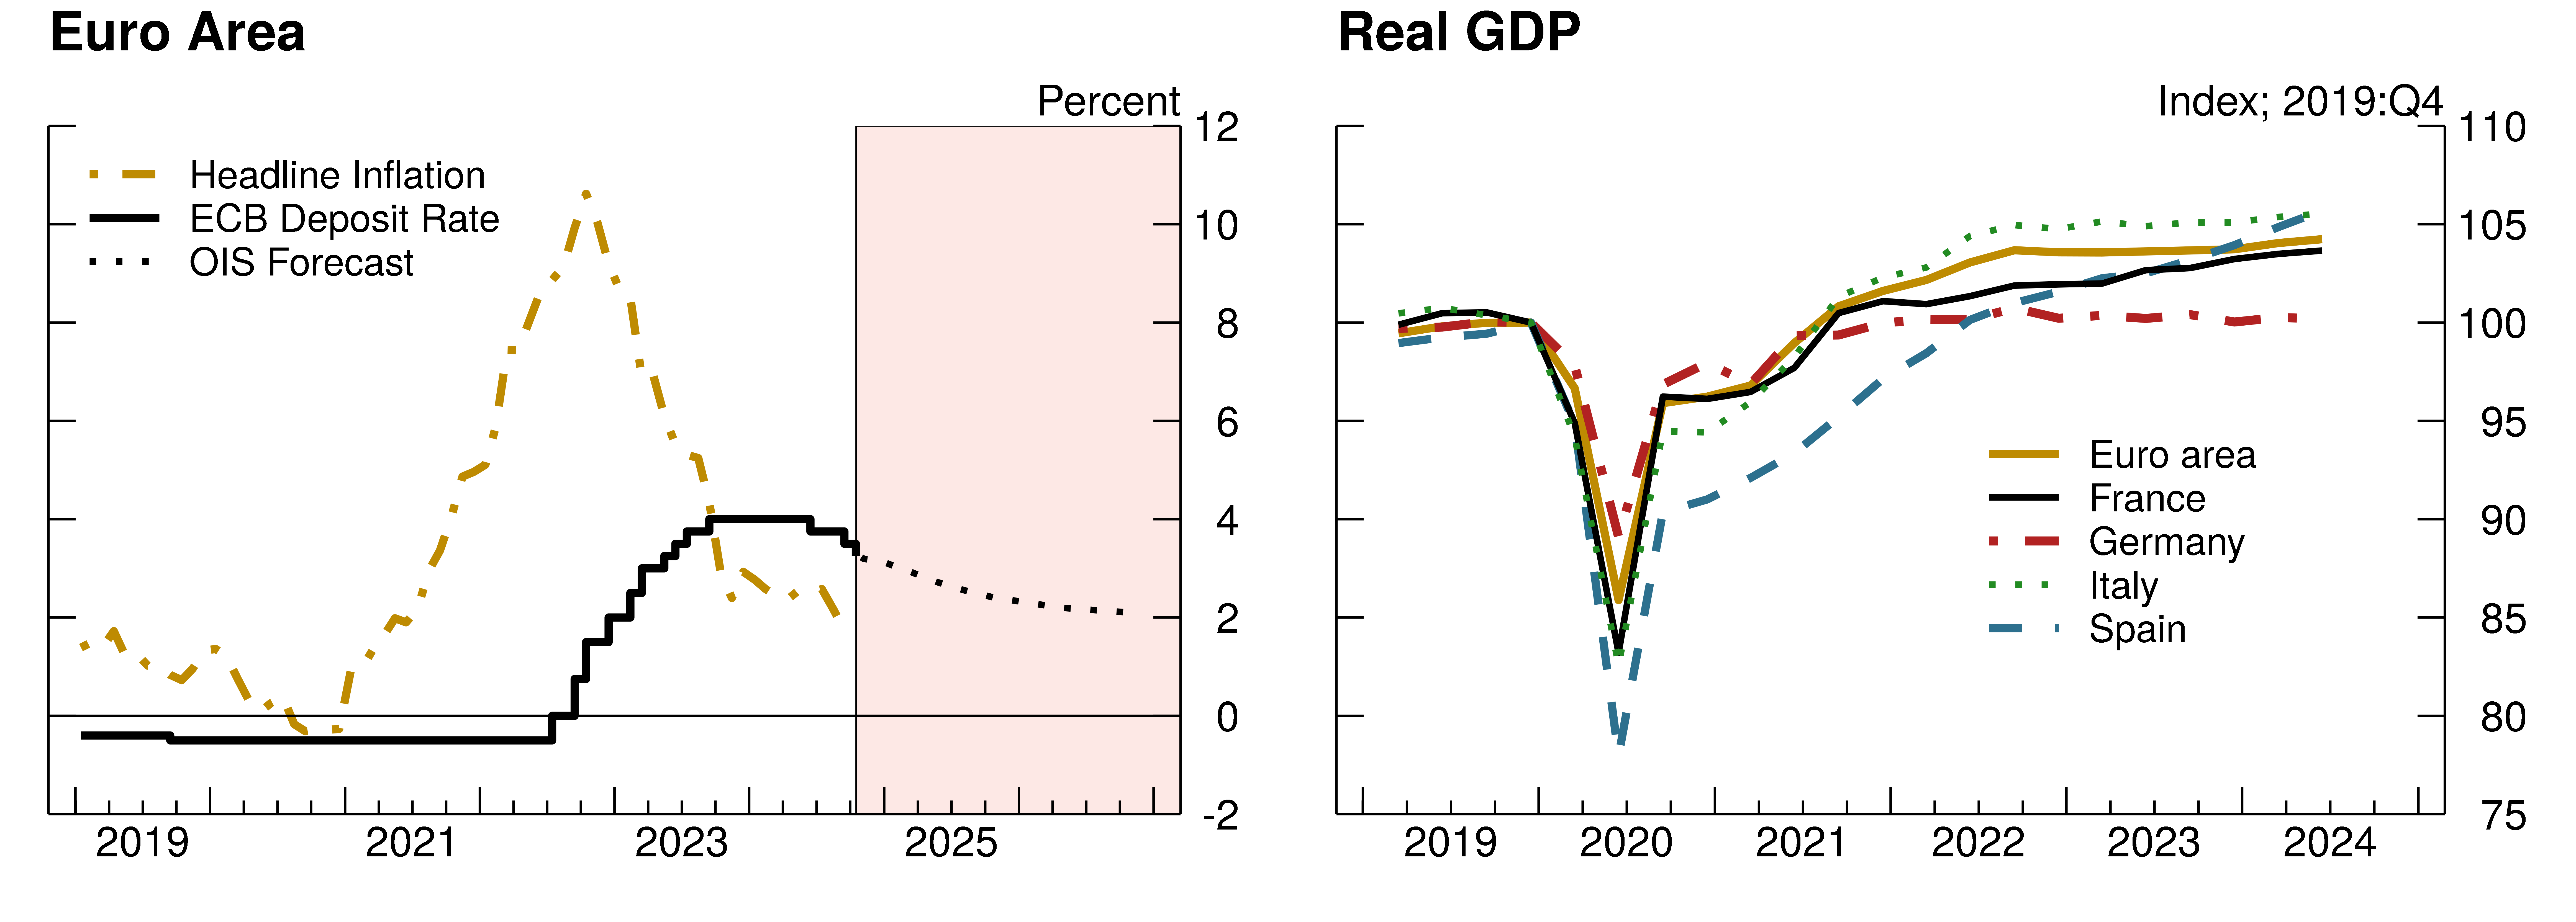
Note: (Left Panel) Euro-area headline inflation (12-months), ECB deposit rate, and policy rate forecast implied by overnight index swap (OIS) quotes. Euro-area headline inflation (12-months), ECB deposit rate, and policy rate forecast implied by overnight index swap (OIS) quotes. Forecast period is shaded.
Source: ECB, Bloomberg.
Note: (Right Panel) Real GDP of the euro area, France, Germany, Italy and Spain (in levels, with 2019:Q4 set to 100).
Source: Haver Analytics.
Second, economic activity in the euro area has been stagnant since mid 2022, as shown in the right panel of Figure 1, and the ECB expects growth to pick up notably only from mid- 2025. Hence, as inflationary pressures have subsided, the bank's policy focus has now shifted towards stimulating a faster rate of economic expansion. However, the figure also points to remarkable growth differences within the euro area. Germany, the currency bloc's largest economy, performed comparatively well during the COVID-19 pandemic but has been stagnant since then. Spain, on the other hand, contracted sharply during the pandemic but has recorded strong growth ever since - despite the ECB's restrictive stance.
While some of the early post-pandemic growth of the Spanish economy presumably reflected a catch up from its contraction during the pandemic, its growth rate has remained above pre-pandemic prints. The German economy, on the other hand, has been hit especially hard by several post-pandemic adverse events.5 Furthermore, as we argue in this note, due to its sectoral composition, high ECB interest rates appear to have affected Germany's economy more than other euro-area economies; as Figure 2 shows, measured in value added terms just before the COVID-19 pandemic, the manufacturing sector in Germany is larger than the euro-area average while the service sector is comparably small. Spain, on the other hand, has a much smaller manufacturing and a somewhat larger service sector.
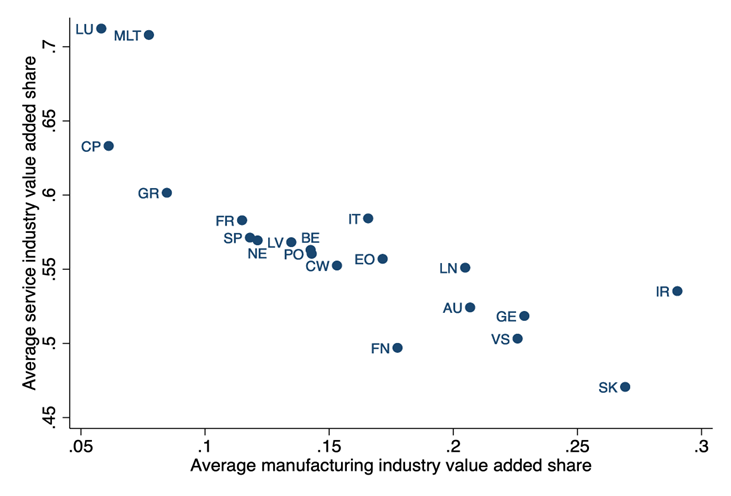
Note: Value added of the manufacturing and service sector, as a share of total 2019 value added.
Source: Eurostat. AU: Austria, BE: Belgium, CW: Croatia, CP: Cyprus, EO: Estonia, FN: Fin-land, FR: France, GE: Germany, GR: Greece, IR: Ireland, IT: Italy, LV: Latvia, LN: Lithuania, LU: Luxembourg, MLT: Malta, NE: Netherlands, PO: Portugal, SK: Slovakia, VS: Slovenia, SP: Spain; Authors' calculations
Since the seminal contribution of Bernanke and Gertler (1995), it is well-understood that restrictive monetary policy tends to have a stronger impact on activity in the manufacturing than in the service sector.6 The main reason is that demand for manufactured goods, especially for durable and business equipment goods, is more interest rate sensitive than demand for services. Another reason is that manufacturing firms typically have larger capital expenses than service firms, making their supply decisions more sensitive to interest rate changes.
For the U.S., we demonstrate in Datsenko and Fleck (2024) that these different sensitivities are reflected at the level of various geographical units; counties, core based statistical areas and metropolitan statistical areas with high shares of manufacturing workers experience stronger employment declines following increases in the Federal Reserve's policy rate. Other research on geographic variation in the transmission of monetary policy, for example, Bellifemine, Couturier and Jamilov (2023), studies county-level employment in sectors producing tradeable vs. non-tradeable output and arrives at conclusions consistent with our analysis.
Estimation and data
To investigate whether differences in sectoral composition contribute to differential impacts of restrictive monetary policy across euro-area economies, we use a local projection framework (Jorda, 2005).7 This framework allows us to employ a widely used measure characterizing changes in the ECB's monetary policy stance. Specifically, we use the monetary policy shock series of Jarocinski and Karadi (2020). This series aims to measure surprises in the central bank's policy decisions, excluding anticipated changes, which are already reflected in market conditions prior to the ECB's official announcements.
Our local projection specification is as follows:
$$$$\Delta y_{t+h,t} = \frac{y_{t+h}-y_{t-1}}{y_{t-1}} = \alpha^h + \nu_q^h + \eta^h d_t +\sum_{j=0}^{8} \beta^{h,j}e_{t-j}^{MP} + \sum_{j=1}^{2} \phi^{h,j} \Delta y_{t-j} + \gamma^hX_{t-1} + \varepsilon_t$$$$
$$\Delta y_{t+h,t}$$, is the cumulative percentage change in an outcome variable between time $$t-1$$ and $$t+h$$, where $$h$$ refers to the estimation horizon. As our outcome data are quarterly, we choose an estimation horizon of $$h$$ = 0, 1, ..., 12 which allows us to estimate effects until about three years after the change. $$\alpha$$ is an estimation horizon specific intercept and we also include quarter fixed effects, $$ν$$, and an indicator $$d$$, which is equal to 1 during the Great Financial Crisis of 2007 and 0 otherwise. $$e^MP_t-j$$ is the monetary policy shock series which measures changes in the ECB's main policy rate (we use shocks at $$t$$ and add lags $$j$$ to capture delayed effects). Finally, $$\Delta y_{t-j}$$ are lags in the outcome variable and $$X$$ denotes a vector of control variables. Throughout our estimations, we use Newey and West (1987) standard errors which account for serial correlation in the error term, $$\varepsilon$$.
In our specification, the beta coefficient estimates capture the effect of ECB monetary policy shocks on the outcome variable at each horizon, comprising an impulse response function. To estimate it, we use quarterly data on euro-area aggregate and country-specific variables from Eurostat. We include years from 1999 (when the Euro was introduced) to 2019 in order to ensure our results are not confounded by the highly unusual behavior of variables during the recent pandemic and the subsequent large energy supply shocks. Finally, we include all twenty countries which are currently euro area members.8
Results
Our baseline estimates, shown in Figure 3, illustrate that making euro area monetary policy more restrictive reduces aggregate economic activity, but the response differs between sectors. We arrive at this finding by estimating the above equation separately for real GDP and for manufacturing and service value added at the euro area level. In the estimation, we include lags of euro-area inflation and unemployment rates as controls.
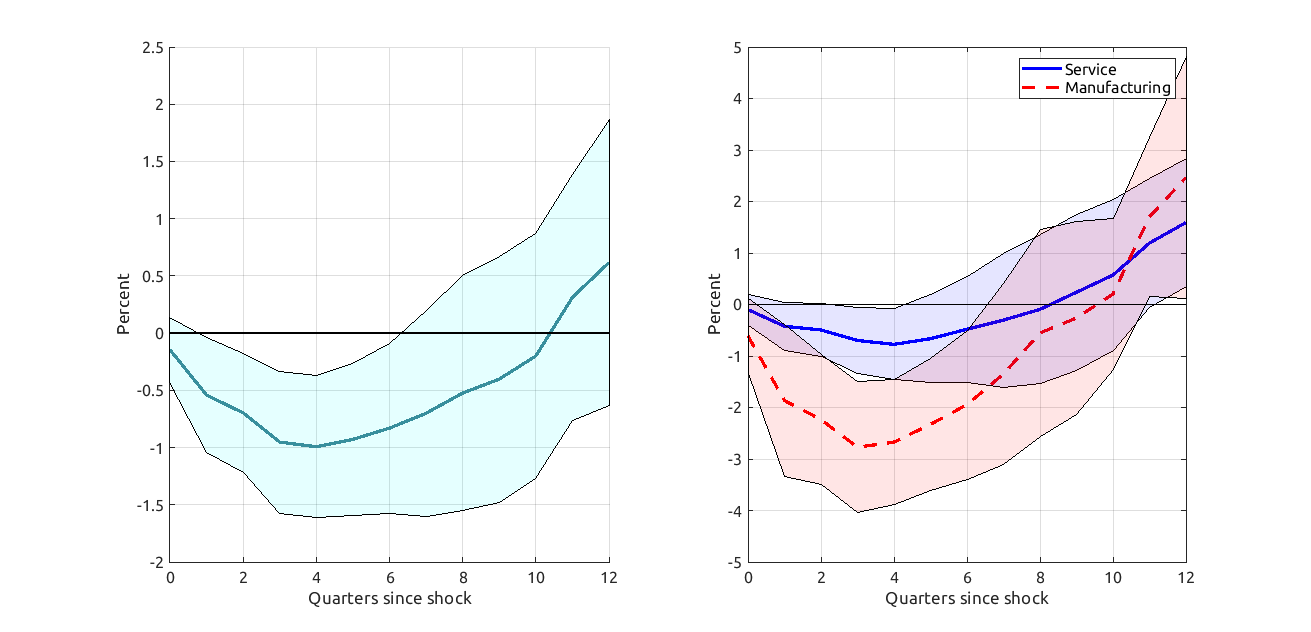
Note: (Left panel) Effect of unexpected increase in ECB policy rate by one percentage point on euro-area real GDP. Solid lines show the point estimates of beta, while the shaded areas represent 90 percent confidence bands.
Source: Eurostat; Author calculations.
Note: (Right Panel) Effect of unexpected increase in ECB policy rate by one percentage point on euro-area manufacturing and services value added. Solid lines show the point estimates of beta, while the shaded areas represent 90 percent confidence bands.
Source: Eurostat; Authors' calculations.
The panels of Figure 3 show the effect of an unexpected one percentage point increase in the ECB's policy rate. The left panel indicates that this increase lowers euro-area real GDP by around one percent after three to four quarters. The right panel shows that it also reduces service and manufacturing sector value added for about eight quarters. Yet, the estimated effect is not statistically significant after four quarters for the service sector and after seven for the manufacturing sector. However, the effect is notably larger for the manufacturing sector; the peak impact is nearly three percent, around three times larger than the peak impact on service sector value added.
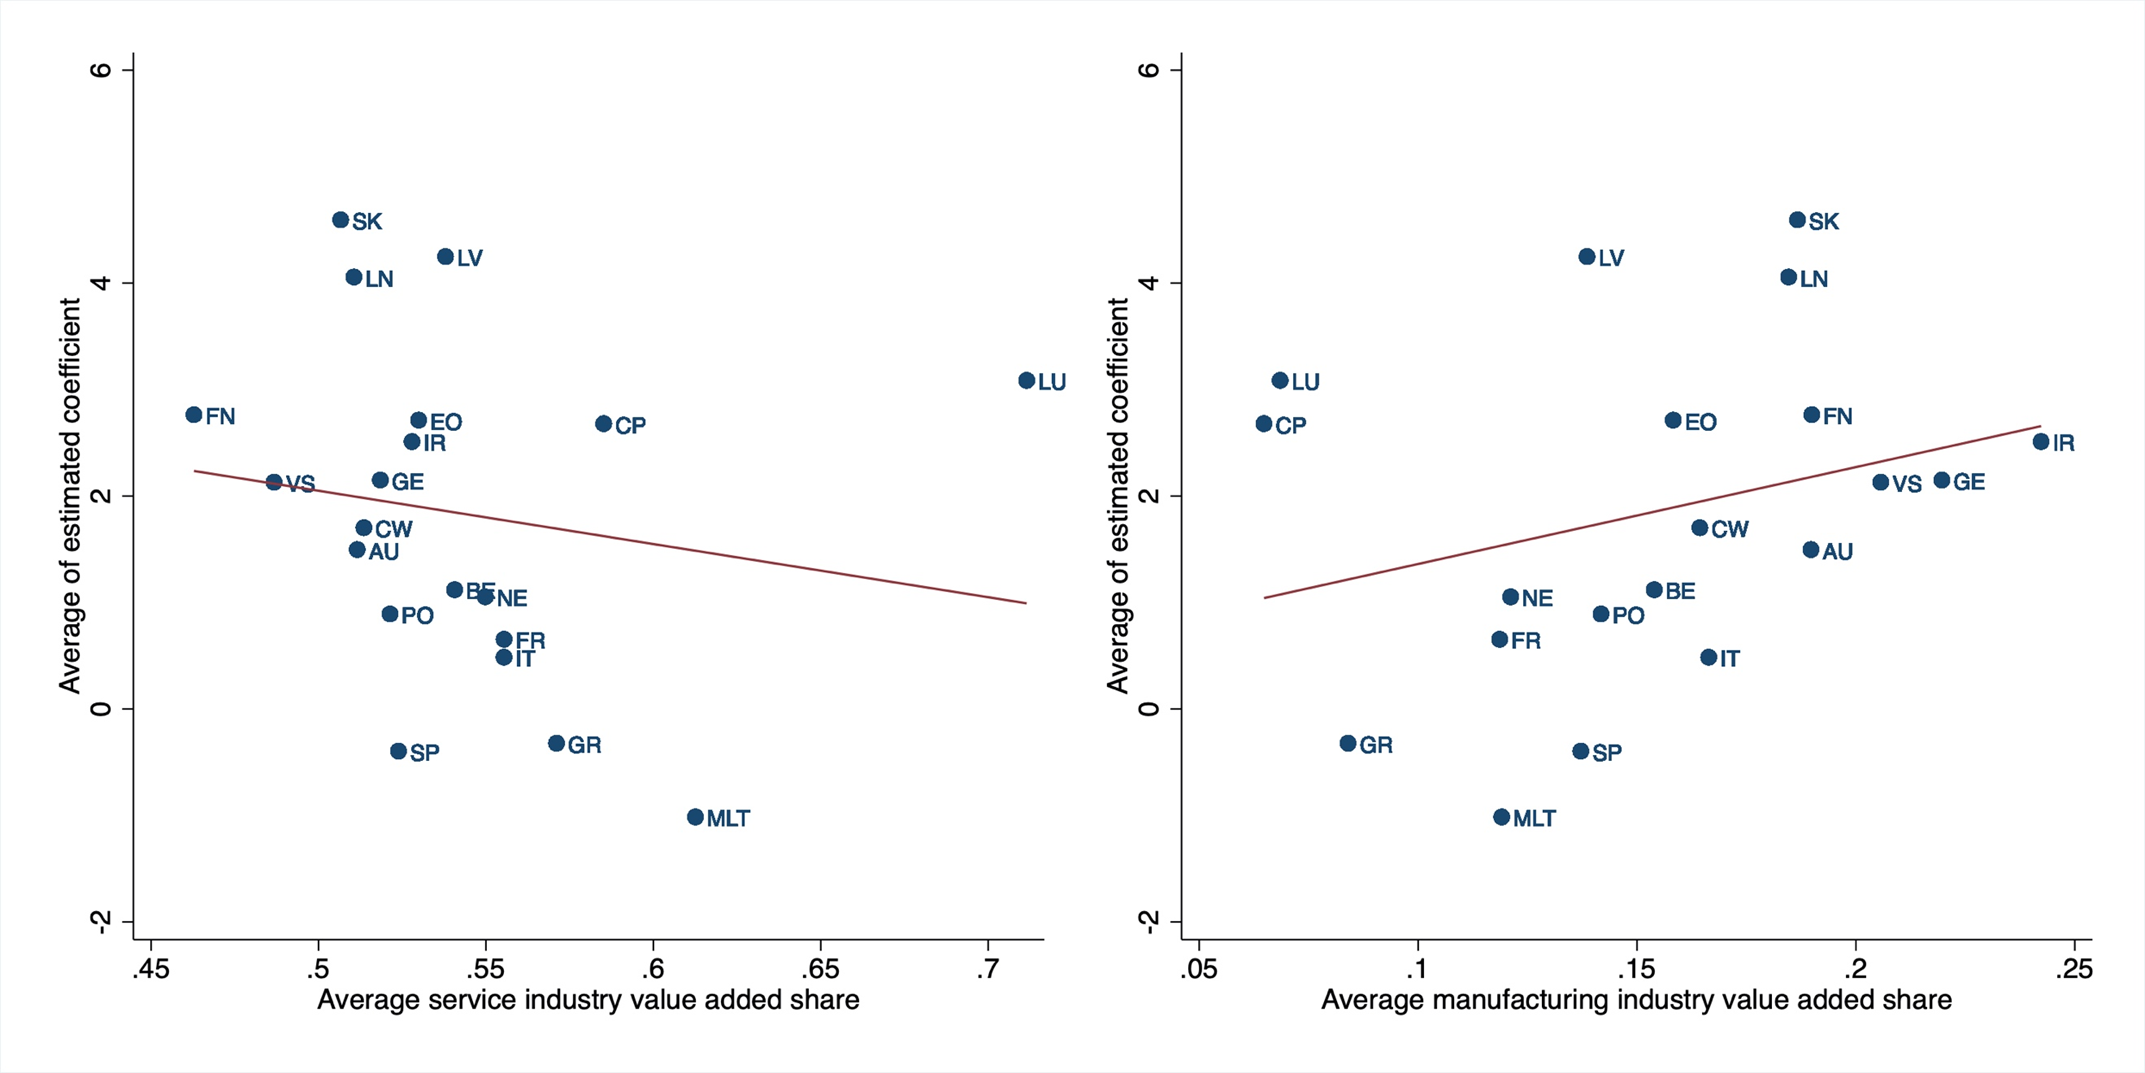
Next, we implement the estimation for each euro-area country separately. In addition to the aggregate controls for inflation and unemployment, we also include country specific variables (mean income and lags of changes in real GDP), which, together with the country specific term alpha, help control for characteristics other than sectoral differences. For each country, we report on the vertical axis of Figure 4 the effect of a one percentage point policy rate surprise on GDP (averaged over the first ten quarters following the surprise). On the horizontal axis, we plot each country's service (left panel) and manufacturing share (right panel).
Figure 4. ECB Policy Rate Increase: Change in Country Specific Real GDP By Sectoral Value Added Share
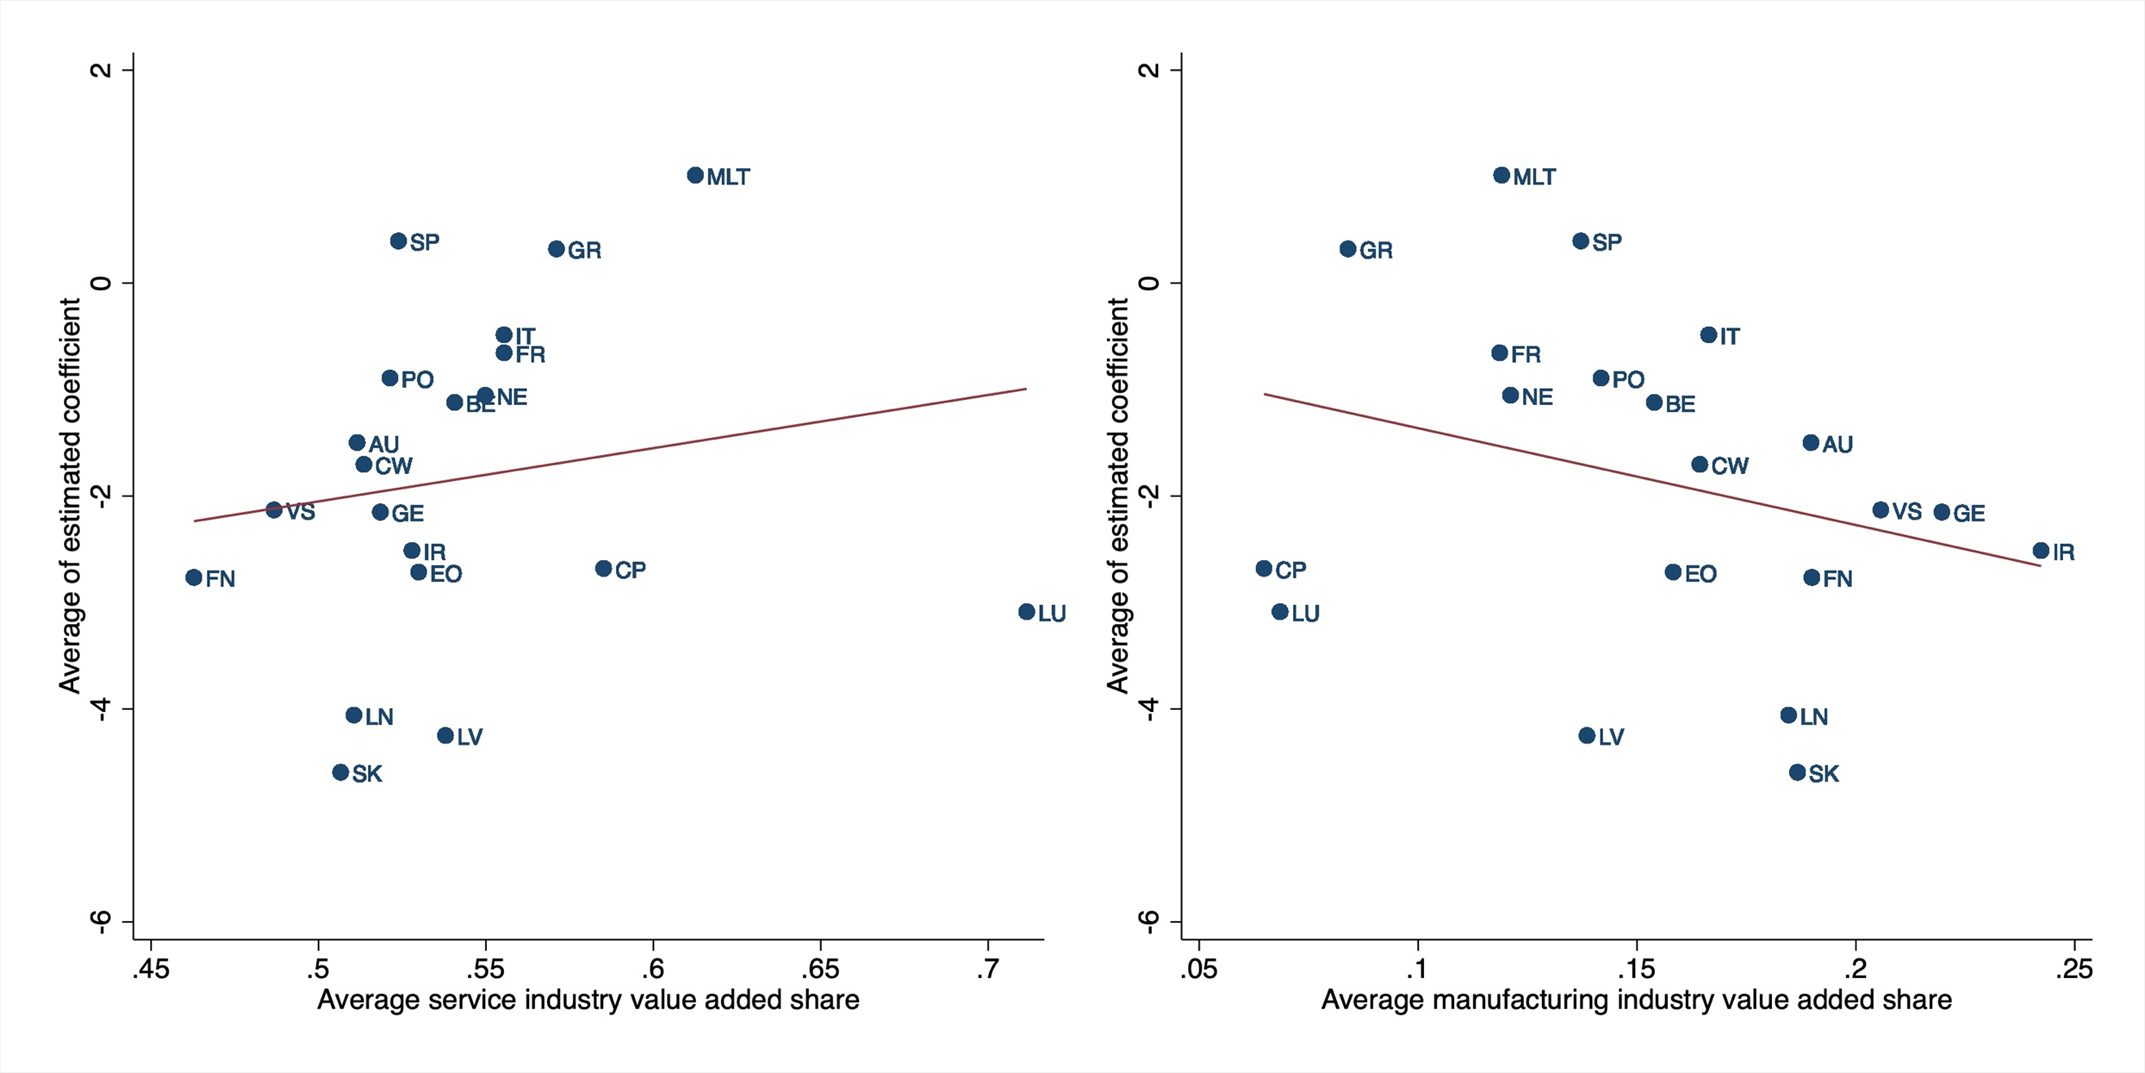
Note: (Left Panel) Vertical axis: Country specific effect of an unexpected increase in the ECB’s policy rate by one percentage point on real GDP by services value added share. Country specific effect of an unexpected increase in the ECB’s policy rate by one percentage point on real GDP. Horizontal axis: Value added share of each country’s service. Shares are averaged over all sample quarters.
Source: Eurostat; Authors' calculations
Note: (Right Panel) Vertical axis: Country specific effect of an unexpected increase in the ECB’s policy rate by one percentage point on real GDP by manufacturing value added share. Country specific effect of an unexpected increase in the ECB’s policy rate by one percentage point on real GDP. Horizontal axis: Value added share of each country’s manufacturing. Shares are averaged over all sample quarters.
Source: Eurostat; Authors' calculations
We find that countries with a larger manufacturing share experienced a stronger GDP decline following an increase in the ECB's policy rate. For instance, the effect on Germany is about twice as large as on the next three largest euro-area economies. The opposite finding applies to the service sector; GDP in countries with larger service sectors tends to be less affected by increases in policy rates.9
Asymmetries: Restrictive vs. accommodative monetary policy changes
Up to this point, our estimation results have been produced under the assumption that changes in restrictive and accommodative monetary policies have symmetrical effects on GDP and sectoral value added. However, it has been argued that monetary tightening can have a stronger impact than easing, as the two affect prices, wages, and credit conditions differently. For example, Debortoli, Forni, Gambetti, and Sala (2020) provide evidence in support of this view.
As the ECB is currently expected to continue moderating its restrictive stance by lowering its policy rate, we also explore asymmetries between the effect of interest rate hikes and cuts. Accordingly, we now estimate the GDP impulse responses separately for negative and positive shocks; differences between the absolute values of these responses may suggest asymmetrical effects of restrictive and accommodative monetary policy changes.
In Figure 5, we report our findings for the effect of accommodative monetary policy changes, that is interest rate decreases. The findings indicate that making the ECB's monetary policy less restrictive has a stronger impact on GDP in countries with a higher manufacturing share. The opposite is true for countries with a larger service share. Importantly, the effects are overall symmetric between restrictive and accommodative changes as Figure 5 is inversely mirroring Figure 4. This provides support for the view that GDP in euro-area economies with larger manufacturing sectors might increase more as the ECB cuts rates.10
Figure 5. ECB Policy Rate Decrease: Change in Country Specific Real GDP By Sectoral Value Added Share
Note: (Left Panel) Vertical axis: Country specific effect of accommodative ECB interest rate changes by one percentage point on real GDP by services value and manufacturing added share. Country specific effect of accommodative ECB interest rate changes by one percentage point on real GDP. Horizontal axis: Value added share of each country’s service. Shares are averaged over all sample quarters.
Source: Eurostat; Authors' calculations
Note: (Right Panel) Vertical axis: Country specific effect of accommodative ECB interest rate changes by one percentage point on real GDP by manufacturing value added share. Country specific effect of accommodative ECB interest rate changes by one percentage point on real GDP. Horizontal axis: Value added share of each country’s manufacturing. Shares are averaged over all sample quarters.
Source: Eurostat; Authors' calculations
Conclusion
Our analysis provides evidence that ECB restrictive monetary policy has a stronger impact on real GDP in euro-area economies with a larger manufacturing sector. This evidence suggests that the interest rate hikes between 2022 and 2024 have had a stronger contractionary impact on GDP in euro-area economies such as Germany. We also find that the effects of restrictive and accommodative shocks are broadly symmetrical which indicates that an easing of the ECB's monetary policy stance is likely to benefit countries with larger manufacturing sectors more than those with smaller ones.
References
Bellifemine, Couturier and Jamilov (2023), "The Regional Keynesian Cross", working paper
Bernanke and Mark (1995), "Inside the Black Box: The Credit Channel of Monetary Policy Transmission", Journal of Economic Perspectives, 9 (4): 27–48.
Datsenko and Fleck (2024), "Structural Transformation and the Efficacy of Monetary Policy", working paper
Debortoli, Forni, Gambetti and Sala (2020), "Asymmetric Effects of Monetary Policy Easing and Tightening", working paper
Galesi and Rachedi (2018): "Services Deepening and the Transmission of Monetary Policy", Journal of the European Economic Association, 17(4), 1261–1293.
Jarocinski and Karadi (2020), "Deconstructing Monetary Policy Surprises - The Role of Information Shocks", American Economic Journal: Macroeconomics 2020, 12(2): 1–43
Jorda (2005), "Estimation and Inference of Impulse Responses by Local Projections", American Economic Review, 95(1), 161–182.
Kreamer (2022), "Sectoral Heterogeneity and Monetary Policy", American Economic Journal: Macroeconomics, 14 (2): 123–59.
Newey and West (1987), "A Simple, Positive Semi-Definite, Heteroskedasticity and Auto-correlation Consistent Covariance Matrix", Econometrica, 55(3), 703–708.
1. We thank Jonathan Lin and Keith Richards for excellent research assistance. Return to text
2. Research Economist. Bank of England. Return to text
3. Economist. Federal Reserve Board of Governors. Return to text
4. June and September 2024 ECB staff projections. Return to text
5. Examples of these adverse events are the redirecting of global supply chains, the gas supply disruptions in the wake of Russia's war on Ukraine, and the slowdown of China's imports. Return to text
6. Some recent contributions to this research literature are Galesi and Rachedi (2018) and Kreamer (2022). Return to text
7. The local projection framework allows to estimate the dynamic response of an outcome variable to exogenous changes in other variables, for example unexpected changes in policy interest rates. Return to text
8. Prior to their official entry into the euro area, monetary conditions in future member economies were already strongly influenced by the ECB's monetary policy decisions, for example because exchange rates were pegged. Return to text
9. If we remove some of the smaller euro-area economies (for example Luxemburg, Cyprus or Slovakia) or use GDP weights to compute the trendlines, the relationship between the effect estimates and the sectoral composition becomes even stronger. Return to text
10. The effects of monetary policy shocks, which we use in our analysis, are not necessarily the same as those of expected policy changes but are their best proxy measures. Return to text
Datsenko, Ruslana, and Johannes Fleck (2024). "Country-Specific Effects of Euro-Area Monetary Policy: The Role of Sectoral Differences," FEDS Notes. Washington: Board of Governors of the Federal Reserve System, November 12, 2024, https://doi.org/10.17016/2380-7172.3649.
Disclaimer: FEDS Notes are articles in which Board staff offer their own views and present analysis on a range of topics in economics and finance. These articles are shorter and less technically oriented than FEDS Working Papers and IFDP papers.
The views presented here are those of the authors and do not necessarily reflect those of the Federal Reserve Board, the Bank of England (and its committees), or the respective staffs.