FEDS Notes
March 28, 2025
Crypto ETPs: An Examination of Liquidity and NAV Premium1
Nathan Swem and Francesca Carapella
In this note we examine the secondary market liquidity and net asset value (NAV) premium (the absolute percentage difference between price and NAV) of the largest spot-crypto electronically traded products (ETPs) that launched during 2024.2 We compare the crypto ETPs with other large ETPs and electronically traded funds (ETFs) that reference equities, bonds, and commodities.3 Our analysis suggests two things:
- crypto ETPs average bid/asked spreads are similar to those of other ETPs and ETFs of comparable size, and
- crypto ETPs track NAV less-closely than other ETPs and ETFs referencing assets of comparable liquidity.
We believe that the relatively high degree of NAV premium for crypto ETPs is due in part to the fact that crypto-asset markets (where the crypto ETP reference assets trade) and equities markets (where the ETPs trade) are difficult for market participants to arbitrage. We also believe that arbitrage difficulties are themselves indications that these markets are somewhat segmented, as we discuss in more detail below.
In addition, our results suggest that crypto ETP NAV premium warrants ongoing monitoring, as the degree of NAV premium may provide helpful information for assessing the extent to which crypto asset markets and equities markets are interconnected.
Crypto ETPs: Background
During 2024 the Securities and Exchange Commission (SEC) approved a series of rule changes to permit regulated equity exchanges to list ETPs that reference Bitcoin (BTC) and Ether (ETH), which are traded in spot-crypto asset markets. In January 2024 the SEC approved ten Bitcoin ETPs, and in March the SEC approved one additional Bitcoin ETP.4 In May, the SEC approved eight ETPs that reference ETH.5
In the interval between early 2024 and early 2025, the crypto ETPs as a group have received significant inflows, which suggests that the crypto ETPs provide value to holders as a convenient means to gain exposures to crypto markets.6 As of late December 2024 the crypto ETPs represent roughly $100 billion in aggregate market capitalization, and the 13-F filings data (end of September 2024) suggests that 13-F filers (typically institutional investors) hold roughly 20 percent of the shares, which implies that retail and other smaller investors own the remaining roughly 80 percent of the outstanding crypto ETP shares.7
ETF, ETP and Reference Assets Data
We assemble daily data for 21 ETFs and ETPs of various types, as well as their underlying reference assets, resulting in a dataset of almost 5,000 observations. We select six crypto ETPs: the three largest that reference BTC (by market capitalization as of year-end 2024) and the three largest that reference ETH. We also chose several of the largest ETFs and ETPs that track equities, bonds, and commodities to compare with the crypto ETPs. We show summary statistics for our ETF and ETP dataset in Table 1.
Our data includes the market-close bid/asked spread which we use as our proxy for secondary market trading liquidity in our analysis. We include the difference between close-of-market prices and net asset values (NAVs), which we call NAV premium for convenience. We also collect several additional variables which relate to trading liquidity such as market capitalization, turnover, returns, investment flows.8 We use the daily data for our regressions that we show in Appendix Tables 1 and 2, and we take the average of each ETPs daily data (during they days for which each ETF traded during 2024) for the plots that we show in Figures 1 and 2.
In addition to the ETFs and ETPs, we also assemble data to proxy for the secondary market trading liquidity of each ETF and ETP's reference asset (or assets).9 For the bond and equity ETFs that track large portfolios we assemble data for the ten largest reference portfolio positions and we use the weighted average of these ten positions as a proxy for the entire reference asset portfolio.
Table 1: ETF, ETP and Reference Assets Data Summary Statistics
| Mean | Median | Min | Max | Obs | |
|---|---|---|---|---|---|
| ETF/ ETP Market Cap ($bn) | $91.0 | $19.7 | $0.1 | $658.8 | 4977 |
| ETF/ ETP Bid Asked Spread (bp) | 4.6 | 1.4 | 0.0 | 159.5 | 4977 |
| Reference Bid Asked Spread (bp) | 58.1 | 4.0 | 0.0 | 1237.5 | 5405 |
| ETF Premium / Discount vs. NAV (ppts) | 0.6 percent | 0.1 percent | 0.0 percent | 19.0 percent | 4977 |
| ETF Flows ($mln) | $1.4 | $0.6 | $0.0 | $8.8 | 5405 |
| ETF Return (absolute value) | 1.3 percent | 0.7 percent | 0.0 percent | 20.1 percent | 4956 |
| ETF Turnover | 5.8 percent | 3.3 percent | 0.1 percent | 819.7 percent | 4977 |
Source: Bloomberg and the Center for Research in Security Prices (CRSP).
Crypto ETPs: Liquidity
Secondary market liquidity is an important measure of ETP and ETF functionality and a big part of why ETPs and ETFs are convenient for investors to hold in general.10 As we show in the regressions in Appendix Table 1, market capitalization appears to most strongly correlate with bid/asked spreads, i.e. larger ETPs and ETFs tend to be more liquid.11
In Figure 1, we plot a selection of ETPs and ETFs according to their market capitalization (as of December 2024: x-axis), and 2024 average daily bid/asked spread (y-axis). We show the crypto ETPs in red bubbles, ETFs that reference equities in grey bubbles, bond ETFs in green, and commodities referencing ETPs in blue. We label each ETP and ETF with its respective ticker symbol.
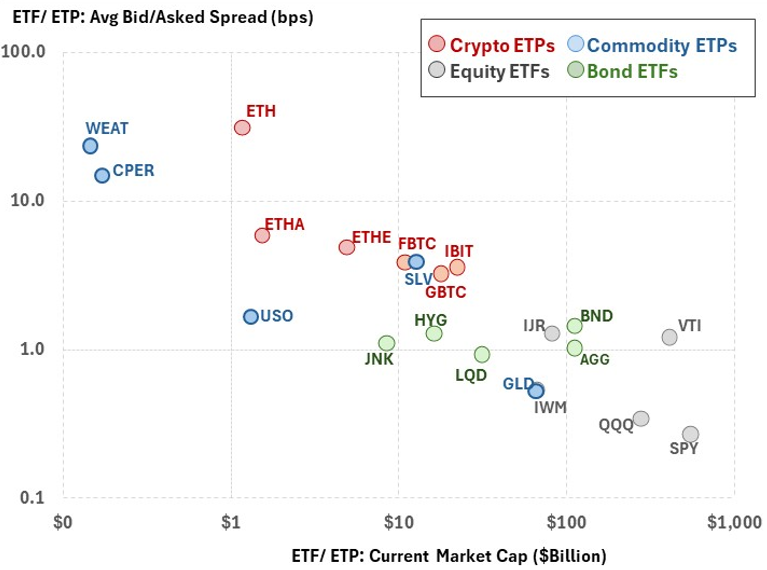
Note: Crypto ETPs include: FBTC, IBIT, GBTC, ETHE, ETH, ETHA; Commodity ETPs: USO, SLV, CPER, WEAT GLD; Equity ETFs: QQQ, SPY, VTI, IJR, IWM, and Bond ETFs: HYG, LQD, JNK, BND, and AGG.
Source: Bloomberg and CRSP.
Consistent with the regressions, the general downward-sloping pattern of the overall scatter plot in Figure 1 reflects the fact that the largest ETPs and ETFs tend to be the most liquid. The crypto ETPs are comparable with several commodity ETFs such as SLV (referencing silver futures) and bond ETFs such as HYG and JNK (referencing corporate bonds), while the very large equity ETFs are more liquid.
Crypto ETPs: NAV Premium
The degree to which the price of an ETF or ETP tracks the price of the underlying reference asset (or assets) relates to tracking error, which is another important measure of function for an ETF or ETP.12 As we show in the regressions in Columns 2 and 7 Appendix Table 2: ETFs and ETPs with more liquid reference assets tend to track NAV more closely.
In Figure 2 we plot a selection of ETPs and ETFs according to the average liquidity of the underlying reference asset (x-axis), and the average NAV premium (y-axis). The size of the respective bubbles reflects the ETF or ETP market capitalization. Consistent with the regressions, as we show on the plot in Figure 2, the general upward sloping pattern indicates that ETF and ETPs with more liquid reference assets tend to have lower NAV premium.
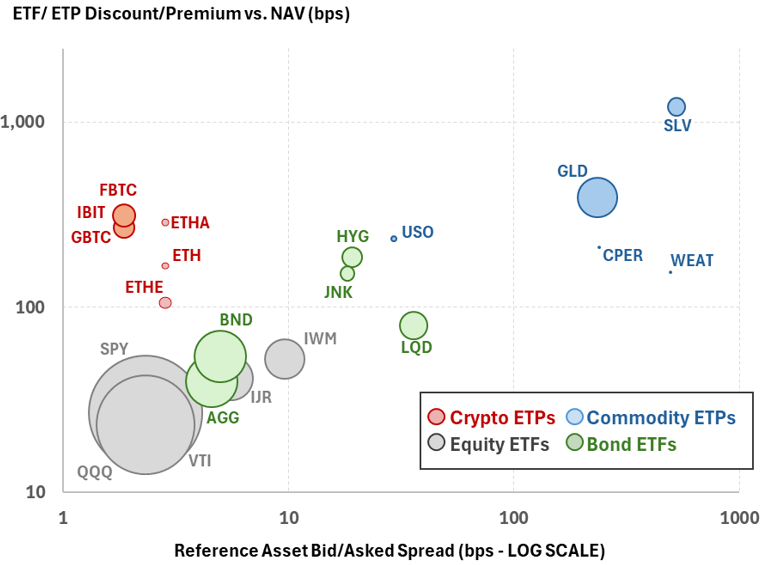
Note: Crypto ETPs include: FBTC, IBIT, GBTC, ETHE, ETH, ETHA; Commodity ETPs: USO, SLV, CPER, WEAT GLD; Equity ETFs: QQQ, SPY, VTI, IJR, IWM, and Bond ETFs: HYG, LQD, JNK, BND, and AGG.
Source: Bloomberg and CRSP.
However, Figure 2 suggests that the crypto ETPs (plotted in red) differ significantly from the others. Crypto ETPs have higher NAV premiums than ETFs that also reference highly liquid assets (such as large-cap equities), which suggests that arbitrage is difficult between crypto markets (where the reference assets trade) and equities markets (where the ETPs trade).
There are several reasons for why arbitrage between crypto ETPs and crypto assets might be difficult. First, the crypto ETPs must redeem in cash, which requires an additional step in any arbitrage transaction relative to other ETFs and ETPs that offer in-kind redemptions.13 In addition, institutional investors face regulatory hurdles that require a separate custodian for crypto assets, which may contribute to making arbitrage between crypto markets and equities markets difficult and/or costly.
While there are many reasons for why crypto ETPs and the underlying crypto assets might be hard to arbitrage, the fact that arbitrage appears to be difficult suggests that crypto asset markets (where the reference assets trade) and equities markets (where the crypto ETPs trade) remain somewhat segmented. Introducing in-kind redemptions might reduce crypto ETP NAV premiums, and also create greater interconnections between crypto assets markets and equities markets.14
More generally, greater interconnections between crypto markets and the traditional financial system may eventually have implications for financial stability if crypto ETPs continue to grow (in size and in number) and if crypto asset markets continue to be highly volatile. Given the possible financial stability implications, we believe crypto ETP NAV premiums warrant ongoing monitoring as they provide a rough measure for the degree to which crypto market and equities markets are interconnected.
Appendix
In this table we show the results from a series of regressions which reflect the following specification:
$$$$ \text{Bid Asked Spread}_{i,t} = \beta \times X_{i,t} + \delta_{t} + \epsilon_{i,t}, $$$$
Where $$ X_{i,t} $$ represents various characteristics including the absolute value of the premium or discount vs NAV, the absolute value of the daily return, the bid/asked spread of the reference asset, the log of the ETF/ ETP market capitalization, the absolute value of the days flows into/ out of the ETF (scaled by NAV) and turnover as defined by daily trading volumes scaled by shares outstanding. We summarize these variables in the Data section and in Table 1 above. In addition, we include date fixed-effects ($$ \delta_t $$), and we cluster standard errors by ETF/ETP. The data are daily for 21 ETFs and ETPs during 2024 from Bloomberg and CRSP. Robust standard errors are in parentheses: *** p<0.01, ** p<0.05, * p<0.1.
Appendix Table 1: ETPs and ETFs Bid/Asked Spread Regressions
| (1) Bid/Asked Spread: ETF/ ETP | (2) Bid/Asked Spread: ETF/ ETP | (3) Bid/Asked Spread: ETF/ ETP | (4) Bid/Asked Spread: ETF/ ETP | (5) Bid/Asked Spread: ETF/ ETP | (6) Bid/Asked Spread: ETF/ ETP | (7) Bid/Asked Spread: ETF/ ETP | |
|---|---|---|---|---|---|---|---|
| Premium/ Discount vs. NAV (abs value) | 203.44 | -228.70* | |||||
| (162.258) | (114.622) | ||||||
| ETF Return (abs value) | 99.85* | 35.58 | |||||
| (55.235) | (45.789) | ||||||
| Bid/Asked Spread: Reference Asset | 0.01 | 0 | |||||
| (0.004) | (0.002) | ||||||
| log of ETF/ETP Market Capitalization | -2.34*** | -2.59*** | |||||
| (0.703) | (0.625) | ||||||
| ETF/ ETP flows (scaled by size, abs value) | -0.00* | 0.00 | |||||
| (0.000) | (0.000) | ||||||
| ETF/ ETP turnover | -0.11 | -27.96*** | |||||
| (3.714) | (9.407) | ||||||
| Fixed-Effects | Date | Date | Date | Date | Date | Date | Date |
| Error Clustering | ETF/ETP | ETF/ETP | ETF/ETP | ETF/ETP | ETF/ETP | ETF/ETP | ETF/ETP |
| Observations | 4,840 | 4,819 | 4,840 | 4,840 | 4,840 | 4,840 | 4,819 |
| R-Squared | 0.034 | 0.069 | 0.052 | 0.377 | 0.076 | 0.028 | 0.449 |
| Adjusted R-Squared | -0.019 | 0.018 | 0 | 0.343 | 0.025 | -0.026 | 0.418 |
| F-statistic | 1.572 | 3.268 | 2.189 | 11.04 | 3.316 | 0.001 | 5.13 |
In this table we show the results from a series of regressions which reflect the following specification:
$$$$ \text{Premium/Discount vs. NAV}_{i,t} = \beta \times X_{i,t} + \delta_{t} + \epsilon_{i,t}, $$$$
Where $$X_{i,t}$$ represents various characteristics for ETF $$i$$ on day $$t$$, that might relate to NAV premium including: the absolute value of the daily return, the bid/asked spread of the reference asset, the log of the ETF/ ETP market capitalization, the absolute value of the days flows into/ out of the ETF (scaled by NAV) and turnover as defined by daily trading volumes scaled by shares outstanding. We summarize these variables, and explain why we choose them, in the Data section and in Table 1 above. In addition, we include date fixed-effects ($$\delta_{t}$$), and we cluster standard errors by ETF/ETP. The data are daily for 21 ETFs and ETPs during 2024 from Bloomberg and CRSP. Robust standard errors are in parentheses: *** p<0.01, ** p<0.05, * p<0.1.
Appendix Table 2: ETPs and ETFs Variation from NAV Regressions
| (1) Premium/ Disc. vs. NAV (abs value) | (2) Premium/ Disc. vs. NAV (abs value) | (3) Premium/ Disc. vs. NAV (abs value) | (4) Premium/ Disc. vs. NAV (abs value) | (5) Premium/ Disc. vs. NAV (abs value) | (6) Premium/ Disc. vs. NAV (abs value) | (7) Premium/ Disc. vs. NAV (abs value) | |
|---|---|---|---|---|---|---|---|
| ETF Return (abs value) | 4.38*** | 3.73** | |||||
| (1.494) | (1.427) | ||||||
| Bid/Asked Spread: Reference Asset | 0.04** | 0.03** | |||||
| (0.015) | (0.014) | ||||||
| Bid/Asked Spread: ETF / ETP | 0 | -0.01 | |||||
| (0.002) | (0.003) | ||||||
| log of ETF/ETP Market Capitalization | -0.04*** | -0.04** | |||||
| (0.013) | (0.013) | ||||||
| ETF/ ETP flows (scaled by size, abs value) | 0.00 | 0.00 | |||||
| (0.000) | (0.000) | ||||||
| ETF/ ETP turnover | 0.07 | 0 | |||||
| (0.084) | (0.245) | ||||||
| Fixed-Effects | Date | Date | Date | Date | Date | Date | Date |
| Error Clustering | ETF/ETP | ETF/ETP | ETF/ETP | ETF/ETP | ETF/ETP | ETF/ETP | ETF/ETP |
| Observations | 4,819 | 4,840 | 4,840 | 4,840 | 4,840 | 4,840 | 4,819 |
| R-Squared | 0.103 | 0.124 | 0.061 | 0.114 | 0.056 | 0.056 | 0.206 |
| Adjusted R-Squared | 0.054 | 0.076 | 0.009 | 0.065 | 0.004 | 0.004 | 0.162 |
| F-statistic | 8.598 | 5.549 | 1.8 | 8.919 | 0.413 | 0.725 | 7.906 |
1. Authors: Francesca Carapella and Nathan Swem. We thank Sean Wijesekera for his excellent research assistance. The views expressed here are strictly those of the authors and do not necessarily represent the views of the Federal Reserve Board or the Federal Reserve System. Return to text
2. Our analysis focuses on the spot-crypto ETPs that launched during 2024. Other pre-existing products, such as ETFs referencing Bitcoin futures and closed-end mutual funds holding crypto assets are not considered. For more information see for example: First Bitcoin Futures ETF Rises in Trading Debut - WSJ, https://www.wsj.com/articles/first-bitcoin-futures-etf-rises-in-trading-debut-11634656217. Return to text
3. For differences between ETFs and ETPs, see for example: Exchange-Traded Funds and Products | FINRA.org. Return to text
4. For more information, see: US SEC approves bitcoin ETFs in watershed for crypto market | Reuters, https://www.reuters.com/technology/bitcoin-etf-hopefuls-still-expect-sec-approval-despite-social-media-hack-2024-01-10/. Return to text
5. For more information, see: US SEC approves exchange applications to list spot ether ETFs | Reuters, https://www.reuters.com/technology/us-sec-approves-exchange-applications-list-spot-ether-etfs-2024-05-23/. Return to text
6. See Do Exchange-Traded Products Improve Bitcoin Trading? here for an assessment of crypto ETP liquidity. Return to text
7. For comparison, institutions hold roughly 30 percent of the shares of stock index ETFs such as QQQ and VTI, and over 50 percent of SPY shares. Return to text
8. We select these variables following related literature such as Saglam et. al. (2020) (https://papers.ssrn.com/sol3/papers.cfm?abstract_id=3142081). Return to text
9. We follow papers such as Calamia, et. al. (2016) (https://papers.ssrn.com/sol3/papers.cfm?abstract_id=2835907) which suggests that reference asset liquidity affects liquidity and tracking error of ETFs. Return to text
10. See for example Broman and Shum (2018) (https://onlinelibrary.wiley.com/doi/abs/10.1111/fire.12159) which shows ETFs secondary market liquidity predicts inflows. Return to text
11. The high r-squared in the regression in Column 4 suggests that market capitalization explains the greatest degree of variation in spreads of the variables we examine. The results in Appendix Table 1 are generally consistent with papers examining ETF liquidity such as Petajisto (2017) (https://www.tandfonline.com/doi/epdf/10.2469/faj.v73.n1.7?needAccess=true), Rappoport and Tuzun (2020) (https://papers.ssrn.com/sol3/papers.cfm?abstract_id=3281384), and Saglam et. al. (2021) (https://papers.ssrn.com/sol3/papers.cfm?abstract_id=3142081). Return to text
12. See for example Rappoport and Tuzun (2020) (https://papers.ssrn.com/sol3/papers.cfm?abstract_id=3281384) which shows liquidity is an important factor for ETF tracking error. For more details on the mechanics of ETFs and ETPs, and how these track the value of their respective reference assets, see for example: Exchange-Traded Fund (ETF) | Investor.gov. Return to text
13. See here for more information about cash redemptions for crypto ETPs: CRB Monitor Chart of the Month: Cash or In-Kind? Spot Cryptocurrency ETP Mechanics (https://www.crbmonitor.com/resources/chart-of-the-month-0-0-0-0-da-etf-sec-0-0-0-0-0-1-0). Return to text
14. See BlackRock's discussion of The NASDAQ Stock Market LLC's proposed rule change to list and trade shares of the iShares Bitcoin Trust under NASDAQ Rule 5711(d): srnasdaq2023016-303319-781202.pdf. Return to text
Carapella, Francesca, and Nathan Swem (2025). "Crypto ETPs: An Examination of Liquidity and NAV Premium," FEDS Notes. Washington: Board of Governors of the Federal Reserve System, March 28, 2025, https://doi.org/10.17016/2380-7172.3741.
Disclaimer: FEDS Notes are articles in which Board staff offer their own views and present analysis on a range of topics in economics and finance. These articles are shorter and less technically oriented than FEDS Working Papers and IFDP papers.