FEDS Notes
February 14, 2025
Do Landlords Respond to Wage Policy? Estimating the Minimum Wage Effect on Apartment Rent Prices
Spencer Bowdle1
Minimum wage policies in the United States have lifted real earnings for workers around the low end of the income distribution (Dube, 2019) and thus may alleviate some of the financial stress felt by low-wage renters (Mateyka and Yoo, 2023). However, landlords, potentially facing a boost to local housing demand, may be able to capture some portion of these earnings gains by raising rents, mitigating welfare benefits for affected workers. Indeed, past literature has found evidence that rents respond positively and significantly to minimum wage increases, and that these responses are persistent.2 In contrast, using a novel panel dataset of U.S. apartment buildings from RealPage, Inc. and uniquely granular geographic variation, this note presents evidence of only a small and temporary minimum wage effect on rent prices. This finding holds even when focusing on low-cost apartments specifically, which may be more sensitive to minimum wage policies due to the lower levels of income required to rent them. My results suggest that significant positive effects found in past literature may be overstated, highlighting the need for additional research.
This research contributes to an expansive literature on minimum wages (see Dube and Lindner, 2024, for a recent summary). That said, only a handful of papers have tried to pin down the effect of minimum wages on rent. The papers analyzing the U.S. rental market rely on geographically aggregated rent data (Borg, Passaro, and Hermo, 2023), state-level minimum wage variation (Agarwal, Ambrose, and Diop, 2022), or both (Tidemann, 2018).3 To my knowledge, this note is the first to combine disaggregated rent data with a setting that includes the recent growth in local minimum wage variation in the U.S. Specifically, I combine statutory minimum wage schedules between 2010 and 2019 with new data on individual apartment properties, focusing particularly on urban areas that often contain sub-state wage policies.
Data and Methodology
My primary data source is RealPage, Inc.—a company that surveys multifamily rental properties to provide rental market analytics and property management services to landlords—which collects data on thousands of apartment buildings throughout the U.S. This dataset allows me to track each individual property's best available asking rent, aggregated across floor plans, on a monthly basis beginning in 2010. For minimum wage policies, I use data from Vaghul and Zipperer (2022) that track monthly statutory minimum wage schedules in the United States. I merge these schedules onto the RealPage data at the census block level to obtain the effective local minimum wage schedule for every apartment. Therefore, each apartment is assigned the minimum wage policy that applies to the census block in which it is located. Census blocks are the smallest geographic unit used by the Census Bureau and represent a notably narrow geographic focus, with urban census blocks resembling city blocks.
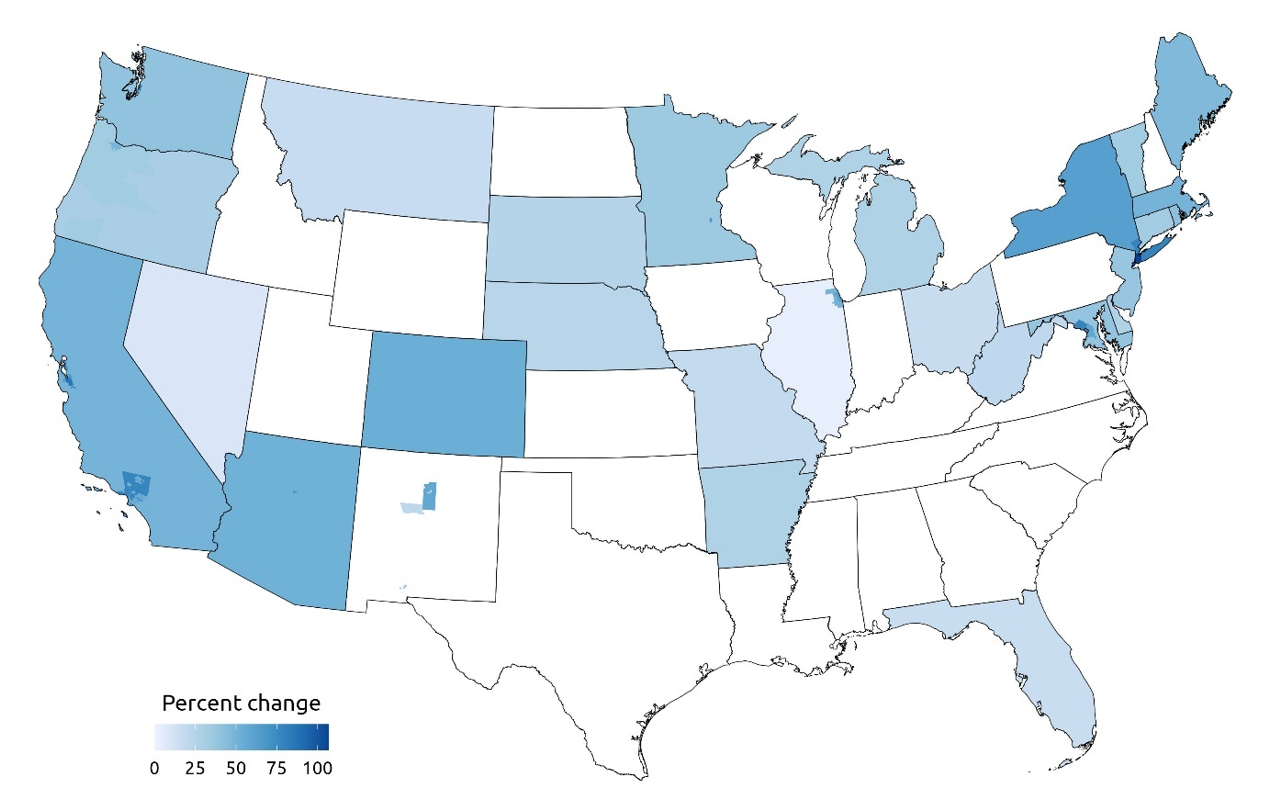
Notes: The Los Angeles County minimum wage applies to unincorporated areas within the county, meaning incorporated cities in the county use the California state minimum wage unless they pass their own city wage ordinance.
Source: Data from Vaghul and Zipperer (2022); author's own calculations.
Figure 1 shows state- and local-level changes in minimum wages between January 2010 and December 2019.4 At the beginning of 2010—shortly after the last increase in the federal minimum wage—minimum wages schedules already varied across the U.S., primarily due to state-level legislation. However, over the following decade, heterogeneity in minimum wage policies increased dramatically, driven in large part by the adoption of policies at the sub-state level. As of January 1, 2025, 67 localities have their own higher-than-state minimum wages, according to the Economic Policy Institute's Minimum Wage Tracker.
For my empirical strategy, I utilize an event study approach as described in Dube and Lindner (2024). To do so, I first identify all "minimum wage events" in the U.S. during my period of study. For a given location (state, county, or city), I define a minimum wage event as a month in which the following two conditions are met: (1) the minimum wage increased in that location by a notable amount (at least $0.25 and at least 5%), and (2) there has been no notable increase in the minimum wage in that location during the prior three years. In many cases, locations experience an initial minimum wage increase at some point followed by a series of subsequent increases, often on an annual basis. For example, Washington, D.C., legislated an increase in its minimum wage in July 2014 from the federal minimum to $9.50 and has further increased its minimum wage in incremental amounts every July since. In such cases, I am identifying only the initial increase as a minimum wage event so that my events are not contaminated by recent prior increases.5 Altogether, I identify 72 state and sub-state events between 2013 and 2019, though not all of them appear in my analysis depending on whether they contain any RealPage apartments.6
For each minimum wage event, I also identify potential "clean control" locations. For a given event, clean control locations are those that experience no minimum wage increases in the three years prior to the event or in the one year following the event. In each month, I then mark each apartment in my dataset as being treated by an event, a viable clean control for any concurrent events, or neither. Finally, I restrict my dataset to properties experiencing an event and their clean control properties and run a series of long-differenced outcome regressions with the following specification.
$$$$ln\left(Rent_{ic,t+k}\right)-ln\left(Rent_{ic,t-1}\right)=\beta_k\Delta ln\left(MW_{ict}\right)+\tau_{ct}+\epsilon_{ict}$$$$
Here, $$ln\left(Rent_{ic,t+k}\right)-ln\left(Rent_{ic,t-1}\right)$$ is the difference in the log asking rent price from month $$t-1$$ to month $$t+k$$ for apartment $$i$$ located in core-based statistical area (CBSA) $$c$$. Additionally, $$\Delta ln\left(MW_{ict}\right)$$ gives the difference in the log minimum wage for that apartment between time periods $$t$$ and $$t-1$$ and $$\tau_{ct}$$ is a CBSA-by-time effect, which forces comparisons to take place among apartments in the same CBSA. That is, this research design exploits simultaneous variation in minimum wages within metropolitan areas.
I use the change in log minimum wage as my main explanatory variable to more easily compare my results to those of existing papers, but my findings are robust to using a binary treatment variable instead.7 I estimate the effect on rent between 12 months before and 11 months after each minimum wage event, which is denoted by $$t=0$$. The estimates for months -12 through -2 give a sense of whether parallel trends hold prior to my events. On the other hand, the estimates for months 0 through +11 give the dynamic post-event response from landlords. Including 12 months of post-event estimates is important as residential leases are often 12 months long, so it may take a typical landlord anywhere up to that amount of time to respond to a minimum wage change in their new leases.8
My methodology has several important advantages.9 However, it is not without drawbacks. Principle among them is that by using CBSA-by-time effects, I can only consider apartments in CBSAs that have both a minimum wage event and clean controls for that event. This noticeably limits the number of events and apartment buildings in my regressions—table 1 describes the 22 events that do end up in my within-CBSA regressions.
Table 1: Minimum Wage Events Represented in Within-CBSA Specification
| Date | Location | New Minimum Wage | Dollar Change | Percent Change |
|---|---|---|---|---|
| January 2013 | Rhode Island | 7.75 | 0.35 | 4.73 |
| January 2013 | Albuquerque, New Mexico | 8.50 | 1.00 | 13.33 |
| March 2013 | San Jose, California | 10.00 | 2.00 | 25.00 |
| July 2013 | Bernalillo County, New Mexico | 8.00 | 0.50 | 6.67 |
| January 2014 | Connecticut | 8.70 | 0.45 | 5.45 |
| January 2014 | New Jersey | 8.25 | 1.00 | 13.79 |
| June 2014 | Delaware | 7.75 | 0.50 | 6.90 |
| July 2014 | Washington, District of Columbia | 9.50 | 1.25 | 15.15 |
| August 2014 | Minnesota | 8.00 | 0.75 | 10.34 |
| August 2014 | Minneapolis, Minnesota | 8.00 | 0.75 | 10.34 |
| October 2014 | Montgomery County, Maryland | 8.40 | 1.15 | 15.86 |
| October 2014 | Prince George's County, Maryland | 8.40 | 1.15 | 15.86 |
| January 2015 | Arkansas | 7.50 | 0.25 | 3.45 |
| January 2015 | Maryland | 8.00 | 0.75 | 10.34 |
| January 2015 | Massachusetts | 9.00 | 1.00 | 12.50 |
| January 2015 | Nebraska | 8.00 | 0.75 | 10.34 |
| July 2015 | Chicago, Illinois | 10.00 | 1.75 | 21.21 |
| July 2015 | Louisville, Kentucky | 7.75 | 0.50 | 6.90 |
| January 2016 | Portland, Maine | 10.10 | 2.60 | 34.67 |
| July 2016 | Lexington, Kentucky | 8.20 | 0.95 | 13.10 |
| July 2017 | Cook County, Illinois | 10.00 | 1.75 | 21.21 |
| January 2019 | Missouri | 8.60 | 0.75 | 9.55 |
Source: Data from Vaghul and Zipperer (2022); author's own calculations.
Results
Figure 2 displays the results from estimating my regression equation above. First, reassuringly, my pre-event estimates are all centered around zero and statistically insignificant, suggesting that the parallel trends assumption required for identification is satisfied. Second, I find a marginally statistically significant elasticity of 0.02 in the month of a minimum wage event ($$t=0$$) that grows to a cumulative elasticity of 0.031 the following month. This suggests that a 10 percent increase in the minimum wage leads rents to rise by 0.31 percent over the subsequent two months, which is in line with the lower end of positive estimates found in the literature.10 However, my results diverge from the literature in that my post-event estimates quickly attenuate and become statistically indistinguishable from zero, implying that minimum wage increases do not have a lasting effect on rent prices.
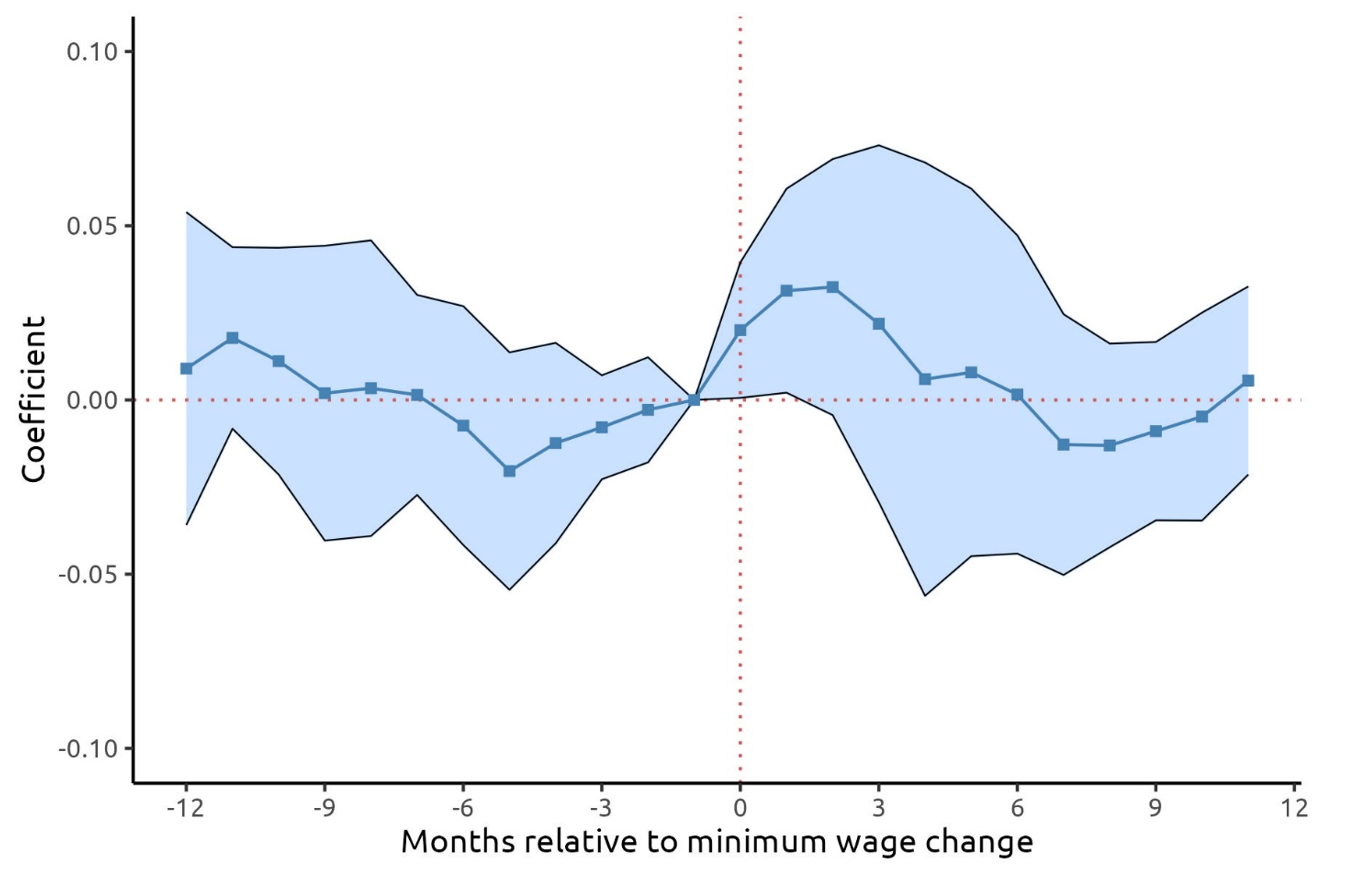
Notes: Estimates based on 4,666 apartment buildings. Shaded area represents 95% confidence intervals, with standard errors clustered at the state level.
Source: Data from RealPage, Inc. and Vaghul and Zipperer (2022); author's own calculations.
To validate my use of CBSA-by-time effects, I report in figure 3 the results of estimating the event study equations with simple time effects instead, which allow treated properties to be compared against clean control properties anywhere in the country. Because this specification does not require the same sample restriction as using CBSA-by-time effects, it can be estimated with a larger number of properties spanning 68 minimum wage events.11 In a subtle contrast to the results in figure 2, the nationwide comparisons suggest consistently negative and steadily increasing—though not quite statistically significant—pre-trends that evolve into positive and increasing post-event elasticities. While most of the estimates are statistically insignificant during this time frame, the general trend is suggestive of a potential violation of the parallel trends assumption stemming from unobserved cross-region heterogeneity.12
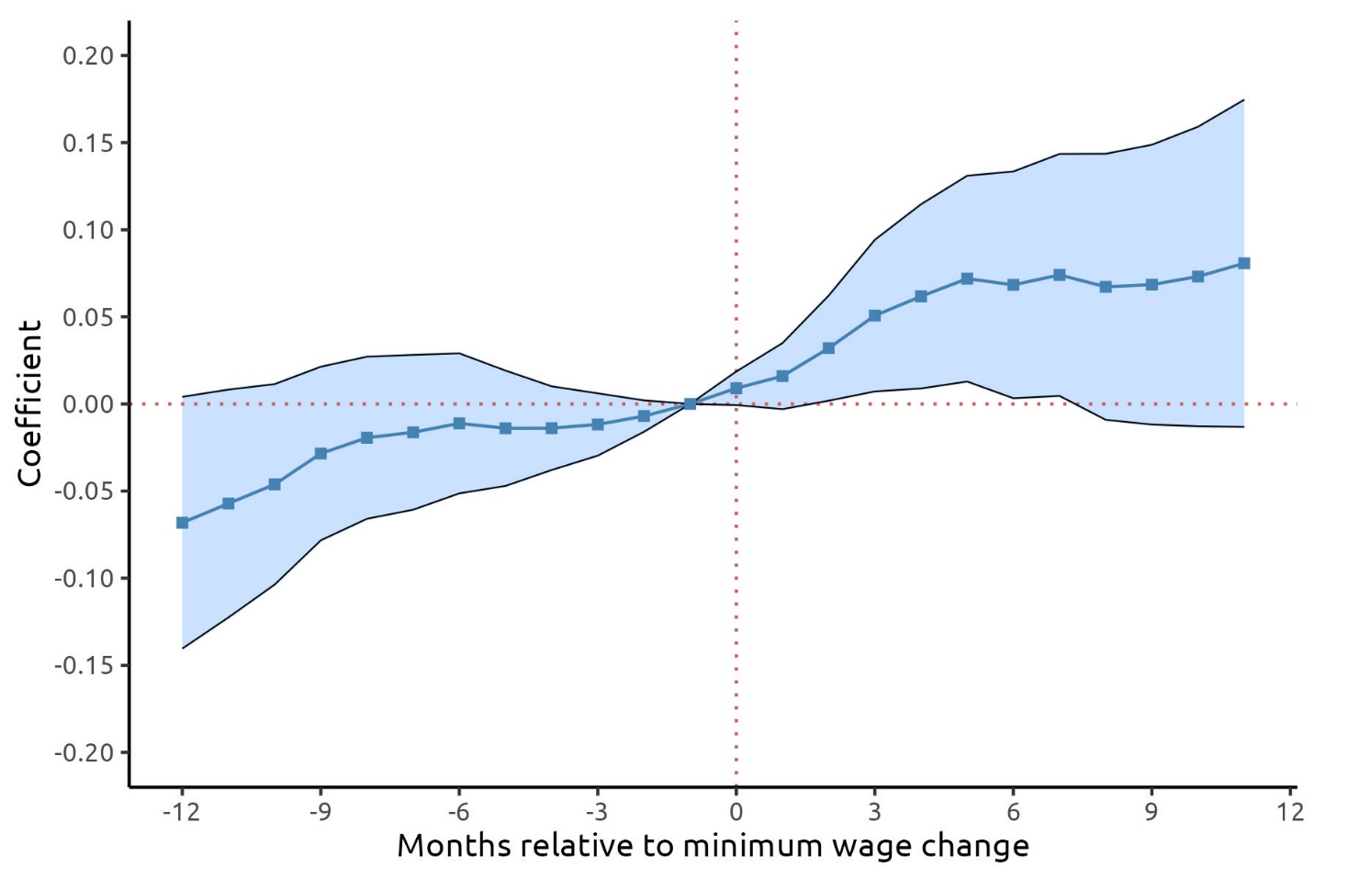
Notes: Estimates based on 32,643 apartment buildings. Shaded area represents 95% confidence intervals, with standard errors clustered at the state level.
Source: Data from RealPage, Inc. and Vaghul and Zipperer (2022); author's own calculations.
One of the benefits of using the granular, apartment-level data from RealPage is the ability to separately study the minimum wage responses across different types of apartments. I make use of this granularity and briefly discuss the effects on rents among low-cost buildings, which intuitively ought to be more responsive to minimum wage policies than apartments in general. To identify low-cost buildings, I rely on RealPage-assigned market ranks. These assigned ranks range from A+ to D and denote the apartment's position relative to the fair market expectation of performance within its rental market. Effectively, apartments with rank A perform better than fair market expectation (and therefore charge more in rent), apartments with rank B are in line with expectations, and those with rank C or D fall below expectations, and, as such, are likely to identify lower-rent buildings.
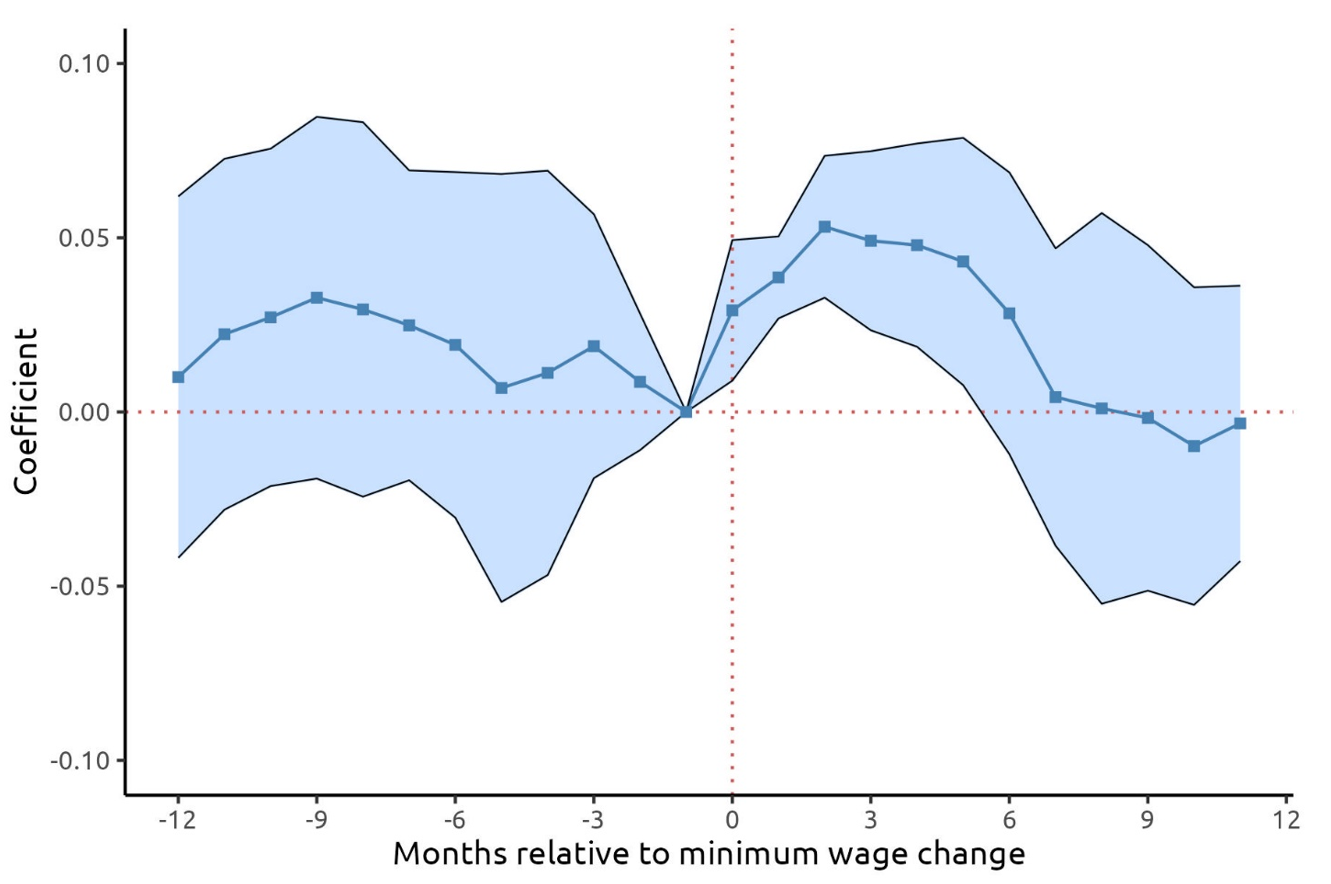
Notes: Estimates based on 1,844 apartment buildings. Shaded area represents 95% confidence intervals, with standard errors clustered at the state level.
Source: Data from RealPage, Inc. and Vaghul and Zipperer (2022); author's own calculations.
In figure 4, I plot the results of running my within-CBSA regressions on the subset of apartments with market rank C or D. As might be expected, these apartments appear more sensitive to minimum wage changes: I find a contemporaneous elasticity of 0.029 that grows to a cumulative elasticity of 0.053 two months following a minimum wage event. These estimates also fall in line with the existing literature and remain near the low end of the range of positive results. However, much like the results plotted in figure 2, the low-cost apartment coefficients eventually return to pre-event levels and become statistically insignificant. Additionally, while these estimates are higher than those in figure 2, they are generally not statistically different.13
In conclusion, using granular data on state and local minimum wages and individual apartment properties between 2010 and 2019, I find relatively small and temporary effects of minimum wage increases on rents when comparing apartments within CBSAs. The temporary nature of these effects is slightly puzzling and has several potential causes. First, landlords in treated areas may truly be only raising rents for a brief period of time around when minimum wage policies go into effect, perhaps reflecting the salience of the policies during that time. Second, there could be delayed spillover effects stemming from nearby untreated landlords deciding to raise rents a few months after treated ones. The use of local comparisons, including within-CBSA, can be prone to attenuated results from spillovers (Dube and Lindner, 2024), and the positive workplace minimum wage effects found in Borg et al. (2023) imply that spillovers from commuting are likely occurring here (although their finding is primarily contemporaneous, not delayed). Finally, minimum wage increases might simply be causing landlords to pull forward future rent hikes that would have happened anyway due to local market conditions, with untreated units catching up later. Further research is needed to fully understand these temporary effects. Additionally, while my within-CBSA specifications appear to ensure more valid estimates, the sample restrictions required to run them create concern that my results are not applicable to all settings. Future work should focus on methods of matching treated and control units in the rental market context that allow for all minimum wage events to be used under this event study framework.
References
Agarwal, Sumit, Brent W. Ambrose, and Moussa Diop (2022). "Minimum Wage Increases and Eviction Risk." Journal of Urban Economics, vol. 129, 103421, https://doi.org/10.1016/j.jue.2021.103421.
Borg, Gabriele, Diego Gentile Passaro, and Santiago Hermo (2023). "From Workplace to Residence: The Spillover Effects of Minimum Wage Policies on Local Housing Markets," working paper.
Cengiz, Doruk, Arindrajit Dube, Attila Lindner, and Ben Zipperer (2019). "The Effect of Minimum Wages on Low-Wage Jobs," The Quarterly Journal of Economics, vol. 134 (3), 1405-1454, https://doi.org/10.1093/qje/qjz014.
Dube, Arindrajit (2019). "Minimum Wages and the Distribution of Family Income." American Economic Journal: Applied Economics, vol. 11 (4), 268-304.
Dube, Arindrajit, and Attila Lindner (2024). "Minimum Wages in the 21st Century," NBER Working Paper Series 32878.
Dube, Arindrajit, T. William Lester, and Michael Reich (2010). "Minimum Wage Effects Across State Borders: Estimates Using Contiguous Counties," The Review of Economics and Statistics, vol. 92 (4), 945-964.
Economic Policy Institute (2024). "Minimum Wage Tracker," webpage, (accessed January 2, 2025).
Houck, Ben (2022). "Housing Leases in the U.S. Rental Market," U.S. Bureau of Labor Statistics.
Mateyka, Peter J., and Jayne Yoo (2023). "Low-Income Renters Spent Larger Share of Income on Rent in 2021," U.S. Census Bureau.
Roth, Jonathan, Pedro H. C. Sant'Anna, Alyssa Bilinski, and John Poe (2023). "What's Trending in Difference-in-Differences? A Synthesis of the Recent Econometrics Literature," Journal of Econometrics, vol 235 (2), 2218-2244, https://doi.org/10.1016/j.jeconom.2023.03.008.
Tidemann, Krieg (2018). "Minimum Wages, Spatial Equilibrium, and Housing Rents," job market paper, https://ktidemann.wordpress.com/wp-content/uploads/2018/11/combinedjmp.pdf.
Vaghul, Kavya, and Ben Zipperer (2022). "Historical State and Sub-state Minimum Wages." Version 1.4.0, https://github.com/benzipperer/historicalminwage/releases/tag/v1.4.0.
Yamagishi, Atsushi (2021). "Minimum Wages and Housing Rents: Theory and Evidence," Regional Science and Urban Economics, vol. 87, 103649, https://doi.org/10.1016/j.regsciurbeco.2021.103649.
1. The views expressed in this article are those of the author and do not necessarily reflect those of the Federal Reserve System. I would like to thank Ethan Kaplan, Arindrajit Dube, Molly Harnish, Raven Molloy, and various members of the Industrial Output section at the Federal Reserve Board for their excellent feedback and advising. All errors are my own. Return to text
2. Yamagishi (2021), Agarwal, Ambrose, and Diop (2022), Borg, Passaro, and Hermo (2023). Return to text
3. In contrast to the other papers on this subject, including the Japanese rental market analysis of Yamagishi (2021), Tidemann (2018) finds a negative effect on rents. Return to text
4. It is common for minimum wage policies to assign different wage schedules to different groups of employees, such as employees at firms with more than 10 employees, those at smaller firms, and tipped employees. Generally, the minimum wage literature focuses on the wage rates for large employers (when separate schedules are present), so I do the same in this article. Importantly, when state minimum wages are lower than federal wages (or in cases of states without a minimum wage), the federal minimum applies. Return to text
5. I make a handful of exceptions to the minimum wage event conditions I describe. For example, there are cases such as Rhode Island and Arkansas where the initial increase is too small to be marked as "notable," but it was legislated and led to a series of increases, so I would still consider it an event. Return to text
6. I do not identify any events prior to 2013 because I use 2010 through 2012 to analyze pre-trends. Return to text
7. While I do not include control variables in my preferred specification for simplicity, my results are also robust to including pre-event county-level sector employment shares, total employment, average weekly wages, Democratic vote shares, and number of multifamily building permits. Return to text
8. Houck (2022). Return to text
9. First, for minimum wage contexts where treatment is staggered and varies in magnitude, event studies are quickly becoming favored over two-way fixed-effects-style approaches due to the variety of issues that the latter introduces, (Roth, Sant'Anna, Bilinski, and Poe, 2023; Cengiz, Dube, Lindner, and Zipperer, 2019; Dube and Lindner, 2024). Second, comparing apartments only within CBSAs helps avoid the problem of unobserved heterogeneity across regions contaminating my results, which is common when studying minimum wages (Dube, Lester, and Reich, 2010). Return to text
10. Borg et al. (2023) obtain a contemporaneous elasticity of 0.0372 for the effect of statutory minimum wage increases on rents, but their preferred specification includes a measure of workplace minimum wages as well. The combined effect of these two measures of minimum wage on rents is estimated to be an elasticity of 0.0466. Yamagishi (2021) finds an elasticity of 0.25 to 0.45, the upper end of the range of existing estimates. Tidemann (2018) is the only paper to find a negative effect on rents. Return to text
11. While not displayed in this article, I also run these nationwide comparisons regressions using the within-CBSA sample of apartments and events. Doing so, I find similar-looking results, reinforcing my assertion that the methodological difference is driving the divergence of results between figures 2 and 3. Return to text
12. Also not reported in this note, I re-run all of the regressions (including the one mentioned in footnote 7) with three years of pre-trends instead of one. The pre-event estimates from using nationwide comparisons continue to steadily decrease the further back they go and, in the case of using the unrestricted sample, become statistically significant. On the other hand, the within-CBSA approach produces pre-event estimates that remain close to zero and statistically insignificant. Return to text
13. When estimating my within-CBSA regression on all apartment types but including an interaction term between the minimum wage change and a low-cost apartment indicator, the interaction term is generally positive but is only statistically significant for $$t=0$$. Return to text
Bowdle, Spencer (2025). "Do Landlords Respond to Wage Policy? Estimating the Minimum Wage Effect on Apartment Rent Prices," FEDS Notes. Washington: Board of Governors of the Federal Reserve System, February 14, 2025, https://doi.org/10.17016/2380-7172.3621.
Disclaimer: FEDS Notes are articles in which Board staff offer their own views and present analysis on a range of topics in economics and finance. These articles are shorter and less technically oriented than FEDS Working Papers and IFDP papers.