FEDS Notes
January 13, 2023
Drivers of Post-pandemic Inflation in Selected Advanced Economies and Implications for the Outlook
Danilo Cascaldi-Garcia, Musa Orak, and Zina Saijid1
Introduction
With the reopening of economies from strict COVID-19 lockdowns and the war-induced sharp increases in food, energy, and other commodity prices, headline inflation has surged globally, as shown for a few selected advanced economies by the black line in the left panel of figure 1 through October 2022. Core inflation (the dashed red line) has also risen sharply and has become increasingly persistent across these economies. The right panel plots persistence coefficients for annualized monthly core inflation from a purely statistical model in which inflation is modelled as a function of its own lags.2 The persistence coefficient in the euro area (the dashed black line) has increased from around 0.1 to near 0.4 in the past two years, and it has also increased in Canada and the United Kingdom (the red and dotted dark-blue lines) to around 0.4 and 0.5, respectively.
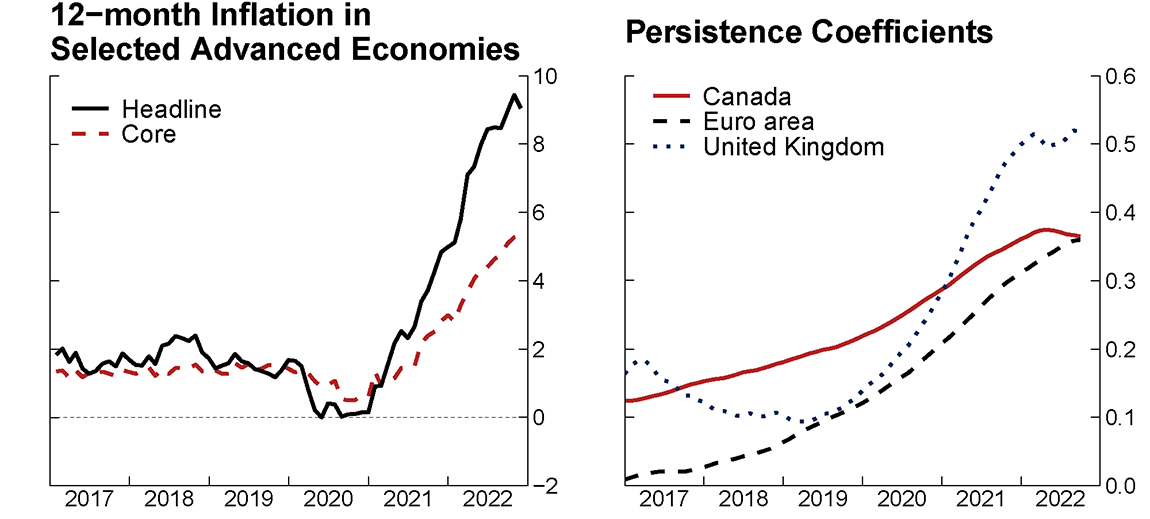
Note: Selected advanced economies are an import-weighted average of Canada, the euro area, and the United Kingdom. Persistence coefficients are computed from a statistical model in which monthly inflation depends on its own lags and are the sum of the estimated coefficients on the lagged variables. The estimated coefficients are allowed to vary over time.
Source: Statistics Canada, Eurostat, and Office for National Statistics, via Haver Analytics; staff calculations.
In addition to increased persistence, several alternative measures of underlying inflation suggest that price pressures have also broadened.3 One of such measures is the common component estimate of Nir, Haberkorn, and Cascaldi-Garcia (2021), which extracts a common factor across all subcomponents of inflation and tends to better represent structural inflationary movements than core inflation. As illustrated in figure 2, this measure shows that the rise in core inflation has been highly synchronized across categories, with increases in inflation dominated by the common component relative to idiosyncratic movements (figure 2). In particular, the common component now accounts for all the 12-month core inflation in the euro area and the United Kingdom. Inflation has also become more diffuse, as evidenced by an index based on the share of core inflation categories with price increases faster than 3 percent in a twelve-month period. As seen in figure 3, this share has more than doubled from a year ago in the major advanced economies shown. The situation is particularly striking in Canada and the United Kingdom, where nearly 90 percent of the categories among core goods and services have experienced more than 3 percent price increases over the past twelve months.
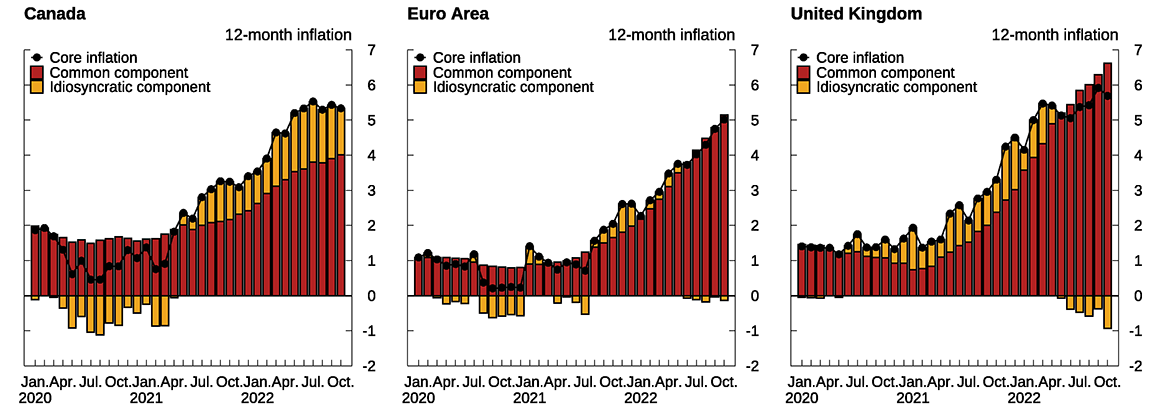
Note: Common inflation is a measure of underlying inflationary pressures constructed using the methodology in Nir, Eli, Flora Haberkorn, and Danilo Cascaldi-Garcia (2021). "International Measures of Common Inflation," FEDS Notes. Washington: Board of Governors of the Federal Reserve System, November 05, 2021, https://doi.org/10.17016/2380-7172.3012.
Source: Haver Analytics; staff calculations.
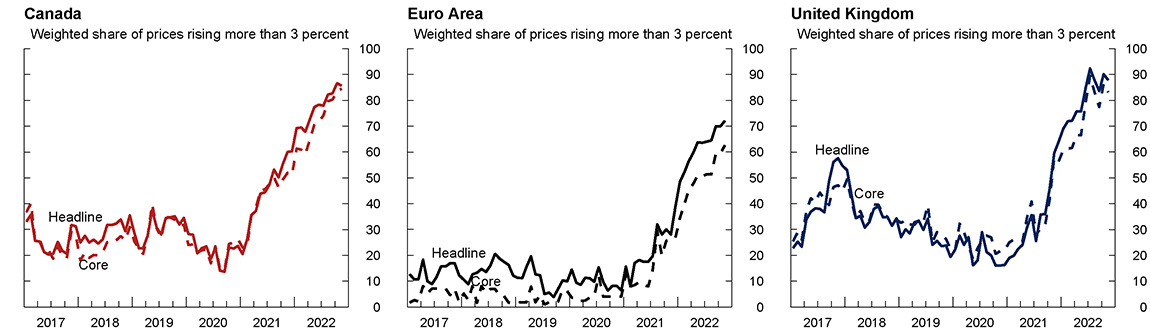
Figure 3A (Left Figure) - Canada
Note: Index constructed from 158 series for headline. 102 series for core.
Source: Haver Analytics; staff calculations.
Figure 3B (Middle Figure) - Euro Area
Note: Index constructed from 94 series for headline. 73 series for core.
Source: Haver Analytics; staff calculations.
Figure 3C (Right Figure) - United Kingdom
Note: Index constructed from 85 series for headline. 67 series for core.
Source: Haver Analytics; staff calculations.
A lot of attention from market participants and policy makers alike has focused on understanding the drivers behind the rise in core inflation, as it has important implications for the medium-term outlook and therefore for policy actions and investment and consumption decisions. In the remainder of this note, we review the empirical evidence on key factors driving core inflation in selected advanced economies through the third quarter of last year and the implications of this evidence for the medium-term core inflation outlook in these economies.
Key drivers of core inflation
The rise in core inflation and the broadening of price pressures can be attributed to a range of factors that are generally similar across advanced economies but vary in importance. First, as shown by the red bars in figure 4, after hovering near zero before 2021, the contribution of core goods to core inflation rose sharply following the initial stages of the pandemic and remains material today even as goods demand has begun to slow and supply-chain bottlenecks have started easing. In addition to rising labor and material costs, this may also reflect that higher energy and transportation costs are passing through to core prices, particularly in Europe, where energy inflation has been more elevated, and that sizable currency depreciations have pushed up goods prices in some economies, such as the United Kingdom.
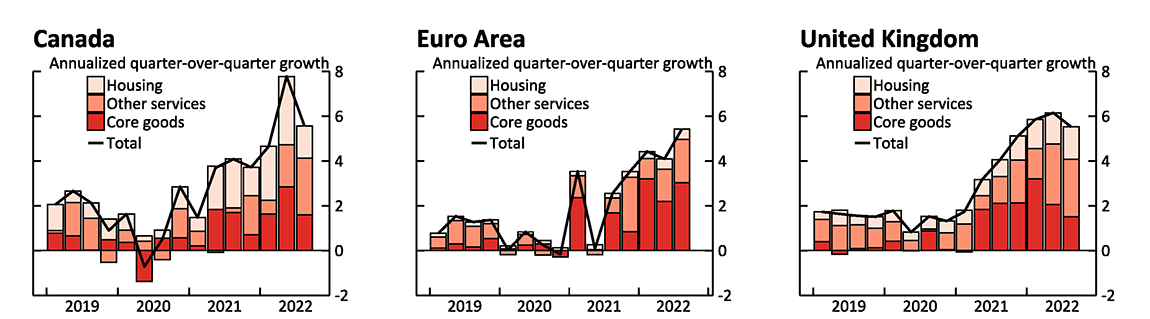
Figure 4A (Left Figure) - Canada
Source: Statistics Canada via Haver Analytics; staff calculations
Figure 4B (Middle Figure) - Euro Area
Source: Eurostat via Haver Analytics; staff calculations.
Figure 4C (Right Figure) - United Kingdom
Source: Office for National Statistics via Haver Analytics; staff calculations.
Second, services inflation—especially of consumer-facing services like restaurants, travel, and accommodation (which is included in the coral bars)—has picked up in 2022 as demand has shifted back toward services following the removal of public health restrictions.
Third, housing services (the pale-pink bars) have been an important driver of core inflation in some economies, most notably in Canada, where this component is broader than in other major advanced economies, but also in the United Kingdom, where rents have risen markedly since mid-2021.
Fourth, unusually tight labor markets are indirectly adding pressures on inflation through strong wage increases and resulting cost pressures. As research by Ball, Leigh, and Mishra (2022) focused on the United States has shown, labor market tightness, as measured by the ratio of job vacancies to unemployment, can explain some of the rise in core inflation in the past two years. In many other advanced economies, the number of job vacancies relative to unemployed workers has also reached historically high levels, shown in the left panel of figure 5. This high level, in part, reflects that many workers have been slow to return to the workforce after the most acute period of the pandemic, particularly in the high-contact services such as hospitality. As seen in the right panel, labor force participation rates have not returned to their pre-pandemic levels outside the euro area, reflecting a broad range of factors, including pandemic-induced early retirements, long-term sickness, and more restrictive immigration.4
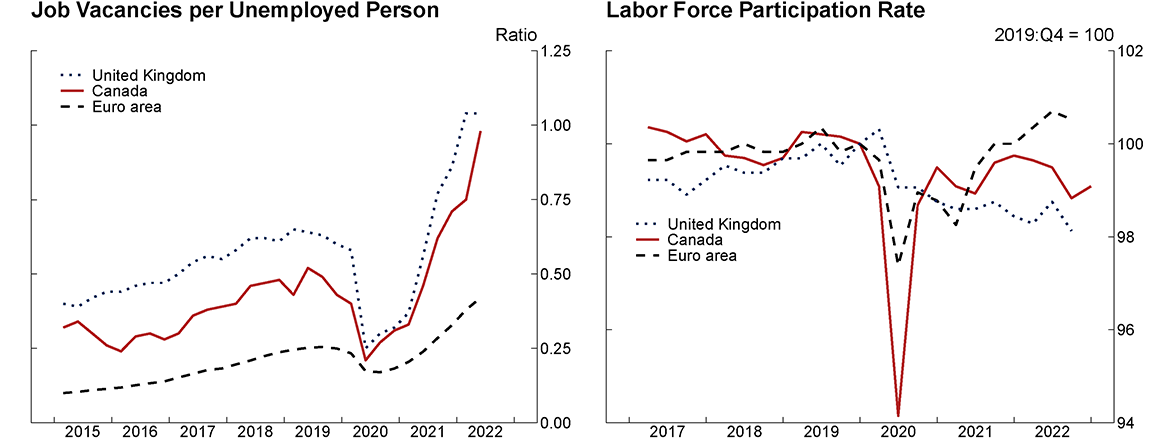
Figure 5A (Left Figure) - Job Vacancies per Unemployed Person
Note: Canadian vacancies are imputed for 2020:Q2 and 2020:Q3. Data for the euro area exclude Italy, Estonia, and Malta.
Source: Haver Analytics.
Figure 5B (Right Figure) - Labor Force Participation Rate
Note: Data extend through August for the United Kingdom and Canada and July for the euro area.
Source: Haver Analytics.
With labor demand outstripping supply, the wage growth, as measured by growth of compensation per employee, has moved up notably in advanced economies and is even higher than implied by the historical relationship between wage growth and unemployment rates (figure 6). The recent observations of the combination of wage growth and unemployment growth stand above the fitted lines, which represent the estimated relationship over the sample period.
Figure 6. Historical Relationship between Compensation and Unemployment Rates In Selected Advanced Economies
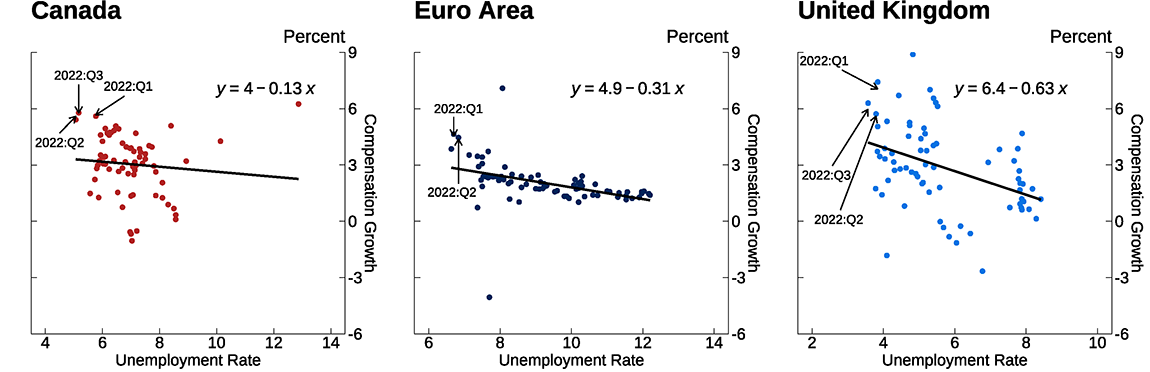
Note: Unemployment is averaged quarterly. Compensation is 4-quarter growth. Points represent a sample period from 2005:Q1 through 2022:Q2 for the euro area and through 2022:Q3 for Canada and the United Kingdom.
Source: Haver Analytics; staff calculations.
Implications for medium-term inflation outlook
The above analysis suggests that a number of factors could drive a moderation in core inflation in the medium term in the advanced economies studied here. First, weakening global demand and a resolution of supply-chain bottlenecks would help bring down core goods inflation, which has been running stronger than its historical average. Indeed, a broad range of global indicators—including supplier delivery times, transport costs, import prices, and producer prices for manufacturing goods—already show some signs of normalizing or cooling, though there is little evidence of pass through to consumer price inflation thus far.
Second, overheated housing markets are cooling amid higher mortgage rates, dampening the inflationary impulse from high house prices.5 Home sales are declining, and prices are rising more slowly or even falling in places that saw significant increases during the pandemic, such as Canada. Accordingly, the contribution of housing services to core inflation has already stepped down in Canada, as can be seen from the pale-pink bars in figure 4.
Finally, under a benign inflation scenario, long-term inflation expectations would remain well anchored and wage pressures would subside, limiting second-round effects. Even though the challenges to labor supply described may not resolve quickly, a slowdown in labor demand would help ease wage pressures as suggested by the historical relationship between unemployment and compensation growth, particularly for services, which are generally more labor-intensive than goods-producing sectors.
Risks to the medium-term inflation outlook
That said, the same analysis also suggests some substantial upside risks to the medium-term inflation outlook for these economies, depending on how exactly the situation plays out. High inflation could become more deeply embedded in economic decisions and shift price and wage expectations. While long-term inflation expectations in these economies have not risen substantially thus far, persistently high inflation can become entrenched and lead to some inertia in future wage and price adjustments, triggering a self-reinforcing wage-price spiral. Under these conditions, the higher inflation would be more persistent. For the moment, such risks appear to be limited, as long-term inflation expectations remain anchored, but this is an important watchpoint.6
A range of other factors related to the situation in supply constraints, currency markets, fiscal policy, and housing could also promote higher inflation for longer than anticipated. First, more persistent supply constraints or the materialization of new shocks from the escalation of geopolitical tensions or new COVID-19 outbreaks that lead to further lockdowns would keep upward pressure on goods inflation. Indeed, professional forecasters have been surprised by the persistence of supply-chain and transportation bottlenecks, which is one of the reasons that actual inflation consistently surpassed professional forecasts over 2021.7 Second, there could be sharper and more persistent depreciation of foreign currencies against the U.S. dollar, pushing the cost of imported goods higher than expected. Third, new fiscal support measures could support demand and boost core goods inflation; for example, de Soyres, Santacreu, and Young (2022) show that core inflation was positively associated with fiscal spending over the course of the pandemic. Finally, additional pressures over core inflation could arise if higher mortgage rates induce a shift in demand away from homeownership toward renting, in particular in Europe where core inflation measures incorporate rents but not house prices. Dias and Duarte (2019) have found that, in the United States, housing rents in the CPI and PCE price indexes increase in response to a contractionary monetary policy shock, suggesting that monetary policy affects the decision to rent versus own.
Conclusion
Broadening price pressures in advanced economies can be attributed to several factors, and the uncertainty is large around how quickly these drivers will recede. Strong demand for goods that was amplified by lockdown-induced supply bottlenecks for inputs and industrial goods resulted in large contributions to core inflation. As consumption has shifted towards services, an increasingly large share of categories of core CPI is showing high rates of increase, and core goods inflation has not yet fallen according to expectations. Price increases have further been exacerbated by reduced supply capacity, prompted by high job vacancies related in part to declines in labor force participation. How these demand-supply imbalances will evolve going forward is difficult to predict but has important implications for the medium-term inflation outlook.
References:
- Aladangady, Aditya, Elliot Anenberg, and Daniel Garcia (2022). "House Price Growth and Inflation During COVID-19," FEDS Notes. Washington: Board of Governors of the Federal Reserve System, November 17, 2022, https://doi.org/10.17016/2380-7172.3228.
- Ball, Laurence, Daniel Leigh, and Prachi Mishra (2022). "Understanding U.S. Inflation During the COVID Era," IMF Working Paper. (Washington: IMF, October), https://www.imf.org/en/Publications/WP/Issues/2022/10/28/Understanding-U-S-525200.
- Bank of Canada (2022), "Scenario with a Wage-Price Spiral," in Monetary Policy Report (Ottawa: BOC, July), p. 25, https://www.bankofcanada.ca/wp-content/uploads/2022/07/mpr-2022-07-13.pdf
- Boissay, Frederic, Fiorella De Fiore, Deniz Igan, Albert Pierres-Tejada, and Daniel Rees (2022), "Are Major Advanced Economies on the Verge of a Wage-Price Spiral?" BIS Bulletin No. 53 (Basel: Bank for International Settlements, May 4), https://www.bis.org/publ/bisbull53.pdf.
- Botelho, Vasco and Marco Weißler (2022). "COVID-19 and retirement decisions of older workers in the euro area," ECB Economic Bulletin, Issue 6/2022, https://www.ecb.europa.eu/pub/economic-bulletin/focus/2022/html/ecb.ebbox202206_02~67d6677c0e.en.html.
- Cogley, Timothy, and Thomas J. Sargent (2005). "Drifts and volatilities: monetary policies and outcomes in the post WWII US." Review of Economic dynamics 8.2: 262-302.
- Dias, Daniel A. and João B. Duarte (2019). "Monetary Policy, Housing Rents and Inflation Dynamics." International Finance Discussion Papers 1248. (Washington: Board of Governors of the Federal Reserve System, May), https://doi.org/10.17016/IFDP.2019.1248.
- International Monetary Fund (2022), "Wage Dynamics Post–COVID-19 and Wage-Price Spiral Risks," in World Economic Outlook: Countering the Cost-of-Living Crisis (Washington: IMF, October), pp. 51–69, https://www.imf.org/-/media/Files/Publications/WEO/2022/October/English/text.ashx.
- International Monetary Fund (2022) "Dissecting Recent WEO Inflation Forecast Errors," in World Economic Outlook: Countering the Cost-of-Living Crisis (Washington: IMF, October), pp. 26–29, https://www.imf.org/-/media/Files/Publications/WEO/2022/October/English/text.ashx.
- Lagarde, Christine (2022), "Monetary Policy Statement Press Conference," Frankfurt, September 8, https://www.ecb.europa.eu/press/pressconf/2022/html/ec b.is220908~cd8363c58e.en.html.
- Mann, Catherine L. (2022), "Inflation Expectations, Inflation Persistence, and Monetary Policy Strategy," speech delivered at the 53rd Annual Conference of the Money Macro and Finance Society, University of Kent, September 5, https://www.bankofengland.co.uk/speech/2022/september/catherine-l-mann-53rd-annual-conference-of-the-money-macro-and-finance-society.
- Macklem, Tiff (2022), "What's Happening to Inflation and Why It Matters," speech delivered at the Halifax Chamber of Commerce, Halifax, Nova Scotia, October 6, https://www.bankofcanada.ca/wp-content/uploads/2022/10/remarks-2022-10-06.pdf.
- Nir, Eli, Flora Haberkorn, and Danilo Cascaldi-Garcia (2021). "International Measures of Common Inflation," FEDS Notes. Washington: Board of Governors of the Federal Reserve System, November 05, 2021, https://doi.org/10.17016/2380-7172.3012.
- Organization for Economic Co-operation and Development (2022), "Employment Outlook 2022: Tackling the Cost-of-Living Crisis," September, https://www.oecd.org/employment-outlook/2022/#labour-markets.
- Primiceri, Giorgio E. (2005). "Time varying structural vector autoregressions and monetary policy." The Review of Economic Studies 72.3: 821-852.
- Ramsden, Dave (2022), "Shocks, Inflation, and the Policy Response," speech delivered at the Securities Industry Conference, London, October 7, https://www.bankofengland.co.uk/speech/2022/october/dave-ramsden-speech-at-the-securities-industry-conference.
- Schnabel, Isabel (2022), "Monetary Policy in a Cost-of-Living Crisis," speech delivered at a panel on the "Fight against Inflation" at the IV Edition Foro La Toja, September 30, https://www.ecb.europa.eu/press/key/date/2022/html/ecb.sp220930~9dac17b1fe.en.html.
- de Soyres, Francois, Ana Maria Santacreu, and Henry Young (2022). "Demand–Supply Imbalance during the COVID-19 Pandemic: The Role of Fiscal Policy," International Finance Discussion Papers 1353 (Washington: Board of Governors of the Federal Reserve System, August), https://doi.org/10.17016/IFDP.2022.1353.
Appendix
We calculate the persistence coefficients by estimating monthly Bayesian time-varying parameters autoregressive models (TVP-AR), with (annualized) month-over-month core inflation, six lags, for the euro area, Canada, and the United Kingdom. The right panel of figure 1 shows the sum of the posterior mean of the six autoregressive coefficients over 100,000 draws. Sample range from January 1970 to October 2022 for Canada and the United Kingdom, and from January 1990 to October 2022 for the euro area.
The model follows the Cogley and Sargent (2005) specification and estimated as in Primiceri (2005). Consider that inflation $$ \pi_t $$ follows an autoregressive process of order $$ p $$ with time-varying parameters and volatility, as in $$$$ \pi_t = \alpha_t + \beta_{1,t} \pi_{t-1} + \cdots + \beta_{p,t} \pi_{t-p} + \sigma_{\varepsilon,t} \varepsilon_t $$$$ $$$$ \Delta log \sigma_{\varepsilon,t}^2 = \gamma_\varepsilon \mu_{\varepsilon,t}, $$$$
Where $$ \alpha_t $$ and $$ \beta_{1,t},\dots,\beta_{p,t} $$ are modeled over time as random walks, $$ \varepsilon_t\sim N(0,1) $$, $$ \mu_t~N(0,1) $$, and $$\sigma_{\varepsilon,t}^2 $$ is the stochastic volatility. The persistence coefficient is calculated over time as $$ \sum_{i=1}^p \beta_{i,t} $$, while a time-varying trend inflation can be calculated by assuming $$ \pi_t=\pi_{t-1}=\cdots=\pi_{t-p}= \bar{\pi}_t $$, as $$$$ \bar{\pi}_t = \frac{\alpha_t}{1-\sum_{i=1}^p\beta_{i,t}}.$$$$
1. All errors and omissions are responsibility of the authors. The views expressed in this note are solely the responsibility of the authors and should not be interpreted as reflecting the views of the Board of Governors of the Federal Reserve System or of anyone else associated with the Federal Reserve System. We thank Grace Lofstrom and Joshua Feldman for excellent research assistance. We are also thankful to Shaghil Ahmed, Deepa Datta, and Jasper Hoek for valuable feedback. The analyses in this note cover the period through October 2022. Return to text
2. See the appendix for a description of this analysis and the methodology used. Return to text
3. Recent communications from foreign central banks share the assessment that price pressures have become increasingly broad-based. See, for example, Lagarde (2022), Macklem (2022), Mann (2022), and Ramsden (2022). Return to text
4. Botelho and Weißler (2022) show that the euro-area participation rate of older population was trending up since 2005. After a short-lived decline early in the pandemic, participation of this group quickly returned to pre-COVID trend, largely offsetting the effects from COVID disturbances, and helping the euro area labor force participation to reach its pre-pandemic level. Return to text
5. Aladangady, Anenberg, and Garcia (2022) show that high house prices are related to high housing services CPI in the United States. They also find a strong positive association between non-housing inflation and house price growth in major U.S. metropolitan areas for the first two years of the COVID-19 pandemic. Return to text
6. See for example Isabel Schnabel (2022), and Bank of Canada (2022), as well as International Monetary Fund World Economic Outlook (October 2022), Boissay et. al (2022), and Organization for Economic Co-operation and Development (2022). Return to text
7. See for example International Monetary Fund World Economic Outlook (October 2022). Return to text
Cascaldi-Garcia, Danilo, Musa Orak, and Zina Saijid (2022). "Drivers of Post-pandemic Inflation in Selected Advanced Economies and Implications for the Outlook," FEDS Notes. Washington: Board of Governors of the Federal Reserve System, January 13, 2023, https://doi.org/10.17016/2380-7172.3232.
Disclaimer: FEDS Notes are articles in which Board staff offer their own views and present analysis on a range of topics in economics and finance. These articles are shorter and less technically oriented than FEDS Working Papers and IFDP papers.