FEDS Notes
February 26, 2025
Educational Exposure to Generative Artificial Intelligence
The release of ChatGPT by OpenAI in November 2022 unleashed a wave of interest in how generative artificial intelligence (AI) may reshape workplaces and affect occupations. Some studies have shown that generative AI may improve work productivity (see, e.g., Noy and Zhang 2023; Dell'Acqua et al. 2023; Brynjolfsson et al. 2023) and that high-skill and white-collar occupations may be the most exposed, though it is uncertain whether higher exposure means that work tasks will be automated away or augmented (Felten et al. 2023; Eloundou et al. 2023; but see Gmyrek et al. 2023).
Given the fast and pervasive adoption of generative AI, it is important to explore how generative AI's effect on labor markets may influence postsecondary institutions and their students, considering the technology's potential to reshape workplace dynamics and the types of skills that are valued. Postsecondary institutions play a significant role in preparing students for the labor market, and their ability to respond to these changes will influence both individual students' career trajectories and broader economic outcomes.
The economics literature suggests that postsecondary institutions and their students will respond to labor market changes precipitated by generative AI. Conzelmann et al. (2023) demonstrated that an increase in field-specific labor market demand elevates the number of bachelor's degrees granted by postsecondary programs; such an increase also grows the number of non-tenure-track faculty and the number of credits taught. They also found that the effects are higher for non-doctoral institutions, for female students, and for social sciences, health, communications, and engineering fields. Weinstein (2022) showed that sector-specific shocks in labor market demand affect the share of sector-relevant majors within universities, with greater effects on universities in areas more exposed to the shocks. Studies have also provided evidence that local and state-level occupation-specific changes in labor market conditions have impacted associated two-year college programs or fields of study (Acton 2021; Gilpin et al. 2015; Grosz 2022).
In this note, I conduct analysis to determine which college majors, demographic groups, and educational institutions – as provided in the biannual National Survey of College Graduates 2013-2021 – may be most or significantly affected by generative AI's predicted impact on the labor market, as measured by Felten et al. (2023)'s occupational exposure scores of two applications of generative AI (i.e., language modeling and image generation). Postsecondary institutions and students should monitor these areas of predicted impact closely as to best adapt to the changing landscape.
The key findings of this note are:
- College Majors. Mathematics and Computer Science-related fields, Political Science and Government, and Accounting may be most affected by generative AI. The available data does not specify the potential of the occupations associated with these fields to be automated away or augmented. If the associated occupations are automated away, the labor demand for graduates with majors in Mathematics and Computer Science-related fields, Political Science and Government, and Accounting may decrease and cause declines in staffing and student engagement in affiliated departments at educational institutions. Conversely, if the associated occupations are augmented, the labor demand for these graduates may rise, expanding affiliated programs and personnel.
- Demographic Groups. Demographic groups may be affected differently by generative AI's potential effect on college majors. College majors with higher percentages of Hispanic and Asian graduates may be more exposed to certain aspects of generative AI, while college majors with higher percentages of females, whites, and blacks may be less exposed. Given that higher exposure to generative AI may mean automation or augmentation of the jobs of these demographic groups, it is ambiguous whether higher exposure will improve or worsen the welfare of Hispanic and Asian graduates.
- Educational Institutions. Finally, the impact of generative AI may be more pronounced at Liberal Arts I institutions, which award a relatively high percentage of Social Sciences degrees, and Research University I institutions, which award a relatively high percentage of STEM degrees.
The note proceeds as follows: Section 1 begins with an overview of the data sources used for analysis. Specifically, it explains how the generative AI occupational exposure measures are linked together with the educational information. Section 2 examines the relative measures of language modeling and image generation exposure for college majors, demographic groups, and types of educational institutions to understand where generative AI's impact on the labor market may strike. Section 3 provides an in-depth discussion of the findings.
1. Data
1.1 Generative AI Occupational Exposure (AIOE) Measures
Generative AI is distinct from prior forms of AI because of its ability to produce new content, and language modeling and image generation capture two key aspects of this. In this note, I use measures of generative AI occupational exposure (AIOE) to image generation and language modeling from Felten et al. (2023). Felten et al. (2021) define language modeling as the "ability to model, predict, or mimic human language" and image generation as the "the creation of complex images." Felten et al. (2021, 2023) constructed the AIOE measures using survey responses of freelance workers from Amazon's Mechanical Turk (mTurk) web service on the relatedness of those applications to 52 occupational abilities from the Department of Labor's Occupational Information Network (O*NET) database. Occupational exposure is then calculated as an average, weighted by the O*NET prevalence and importance scores for each occupation. These AIOE measures are then collapsed from the eight-digit Standard Occupational Classification (SOC) codes to the six-digit SOC codes.
1.2 National Survey of College Graduates (NSCG)
The analysis uses data from the National Survey of College Graduates (NSCG), a nationally representative survey of college graduates that is collected every two years and provides detailed demographic and labor market information. I use data from the 2013-2021 waves of the NSCG. The survey oversamples individuals in science and engineering fields, given the survey is sponsored by the National Science Foundation (NSF) and National Center for Science and Engineering Statistics (NCSES). I use the NSCG sampling weights to account for the survey's sample design, so that my calculations are representative of the entire college-educated population.
The survey respondents report the field of study for their first bachelor's degree ("first listed major"),2 as well as their second college major (if any),3 and the field of study for their top five highest degrees. There are 136 unique fields of study, including an "other" option for non-science and engineering fields that are not listed in the survey. I group these majors into nine categories to conduct additional higher-level analysis.4 NSCG provides the 1994 Carnegie classification of the type of academic institution awarding the degrees. Respondents also report the occupation code and annual salary of their principal job. Additionally, respondents report information on graduate education, including type of degree (master's, doctorate, or professional).
1.3 Linking AIOE Measures to NSCG
To conduct the analysis in Section 2, I introduce new relative measures of generative AI exposure for majors and educational institutions by matching the NSCG occupation codes to the six-digit SOC codes.5 Certain unique NSCG occupation codes correspond with multiple six-digit SOC codes. Thus, I collapse the AIOE measures to the NSCG occupation code level.
Using the NSCG's sampling weights, I compute AIOE averages for the college field of study and educational institution's Carnegie classification, based on how many graduates' principal jobs are classified within the NSCG's occupation codes (see Figure 1). Given that the Felten et al. (2023) measures are standardized, I then standardize the AIOE average measures by calculating their z-scores. The z-scores are relative measures of the distance between the exposure score for that college field of study or educational institution's Carnegie classification and the mean exposure score for all the college fields of study or all the educational institutions' Carnegie classifications, respectively.6 As in Felten et al. (2023), higher exposure measures do not automatically imply automation or augmentation potential of the occupation.
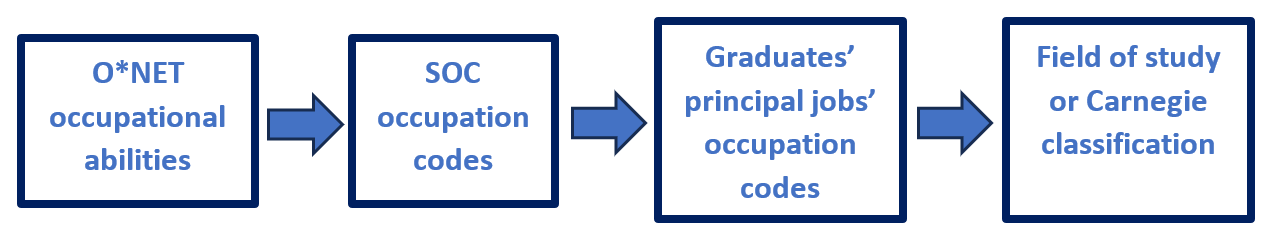
Table 1 provides summary statistics of the weighted sample. A little over half of the college graduates (51 percent) are female. A large majority (80 percent) is white, with about 8 percent black and 9 percent Asian; about 9 percent are Hispanic. A minority (16 percent) have two majors. The mean real annual salary is about $88,000. About a third have graduate degrees. In terms of the highest degree, about 3 percent have a PhD, about 26 percent have a master's (including MBA), and about 5 percent have professional degrees. These demographic and education summary statistics are comparable to those found in other papers that have used the NSCG (see, e.g., Del Rossi and Hersch 2016, Hersch and Xiao 2016). Finally, on average, college graduates' occupational exposure to language modeling of 0.76, with a standard deviation of 0.55, is higher than their exposure to image generation of 0.56, with a standard deviation of 0.65.
Table 1. Summary Statistics
| Demographics and Salary | |
|---|---|
| Percent female (weighted) | 51.17 |
| Percent white (weighted) | 79.51 |
| Percent black (weighted) | 8.03 |
| Percent Asian (weighted) | 9.11 |
| Percent Hispanic (weighted) | 8.8 |
| Mean real annual salary ($) (weighted) | 88,037 |
| Unweighted N | 375,991 |
| Weighted N | 228,764,172 |
| Education | |
| Highest degree - PhD (weighted) | 3.46 |
| Highest degree - MA not in business (weighted) | 20.11 |
| Highest degree - MBA (weighted) | 6.44 |
| Highest degree - MD (weighted) | 2.17 |
| Highest degree - JD (weighted) | 3.01 |
| Highest degree - Other professional degree (weighted) | 0.33 |
| Highest degree - Bachelor's (weighted) | 64.48 |
| Percent with double major (weighted) | 15.56 |
| Exposure Measure | |
| Mean language modeling AIOE (weighted) | 0.76 |
| Mean image generation AIOE (weighted) | 0.56 |
Source: Felten et al. (2023) generative artificial intelligence (AI) occupational exposure scores and the biannual National Survey of College Graduates 2013-2021.
2. Findings
2.1 College Majors: Fields of Study
In this section, I conduct analysis to determine which college majors may be most affected by generative AI's predicted impact on the labor market. Mathematics and Computer Science-related fields and Engineering and Technology-related fields may be the most affected by generative AI. Additionally, Political Science and Government and Accounting are two of the most popular majors that may be the most affected. Postsecondary institutions and their students should monitor these fields of predicted impact closely as to best respond to the evolving landscape.
First, I examine the z-scores for the AIOE measures of both language modeling and image generation for the nine constructed college major categories based on the first listed major. In Table 2, Mathematics and Computer Science-related fields generally score high for both language modeling and image generation exposure, more than any non-STEM field. Engineering and Technology-related fields score the highest for image generation exposure, followed closely by the score for Mathematics and Computer Science-related fields.
Table 2. College Major Categories and Their Exposure to Generative AI
| College Major Categories | Percent | Z-Score for Language Modeling | Z-Score for Image Generation |
|---|---|---|---|
| STEM - Mathematics and Computer Science Fields | 5.81 | 1.1 | 1.49 |
| STEM - Biological and Health Science Fields | 14.2 | -2.02 | -1.09 |
| STEM - Physical Science Fields | 2.92 | -0.6 | 0.41 |
| STEM - Engineering and Technology Fields | 9.93 | -0.15 | 1.67 |
| Education Fields | 8.92 | 0.68 | -0.69 |
| Economics and Business Fields | 22.7 | 0.89 | 0.02 |
| Liberal Arts - Arts and Humanities Fields | 14.3 | -0.03 | -0.53 |
| Liberal Arts - Social Science Fields | 11.7 | 0.79 | -0.46 |
| Liberal Arts - Other Non-Science and Engineering Fields | 9.52 | -0.66 | -0.82 |
Note: The percent is the portion of weighted population of survey respondents with that major category. The z-scores are measures of the distance between the exposure score for that major category and the mean exposure score for all the major categories.
Source: Felten et al. (2023) generative artificial intelligence (AI) occupational exposure scores and the biannual National Survey of College Graduates 2013-2021.
Second, I examine the top ten college majors based on the AIOE measures of both language modeling and image generation for the first listed major.7 The results in Table 3 align with the results in Table 2. Both Computer-related and Engineering-related fields have the highest exposure to image generation in Table 3, which comports with Engineering and Technology-related fields and Mathematics and Computer Science-related fields scoring the highest for image generation exposure in Table 2.
Table 3. College Majors Most Exposed to Generative AI
| Language Modeling | Image Generation | |||||
|---|---|---|---|---|---|---|
| College Major | Percent | Z-Score | College Major | Percent | Z-Score | |
| 1 | Astronomy and astrophysics | 0.02 | 1.93 | Computer and systems engineering | 0.68 | 2.34 |
| 2 | Actuarial science | 0.08 | 1.72 | Civil engineering | 1.11 | 2.25 |
| 3 | Computer teacher education | 0.01 | 1.71 | Environmental engineering | 0.08 | 2.23 |
| 4 | Mathematics teacher education | 0.26 | 1.68 | Computer science | 2.21 | 2.07 |
| 5 | Counselor education and guidance services | 0.05 | 1.65 | Chemical engineering | 0.64 | 2.02 |
| 6 | Accounting | 4.31 | 1.58 | Computer systems analysis | 0.07 | 1.93 |
| 7 | Philosophy of science | 0.06 | 1.57 | Nuclear engineering | 0.04 | 1.87 |
| 8 | Applied mathematics | 0.15 | 1.46 | Mechanical engineering | 1.84 | 1.84 |
| 9 | Political science and government | 2.73 | 1.37 | Architecture/ Environmental Design | 0.85 | 1.77 |
| 10 | Financial management | 2.04 | 1.35 | Electrical, electronics and communications engineering | 2.15 | 1.75 |
Note: The percent is the portion of the weighted population of survey respondents with that major. The z-scores are measures of the distance between the exposure score for that major and the mean exposure score for all majors.
Source: Felten et al. (2023) generative artificial intelligence (AI) occupational exposure scores and the biannual National Survey of College Graduates 2013-2021.
When the exposure scores are broken out by major in Table 3, there is some heterogeneity in the majors that have the highest language modeling scores. There are some Mathematics and Computer Science-related fields that make the top ten list. However, Accounting and Political Science and Government – two of the top ten most popular college majors (by percentage) – are also in the list of top ten majors most exposed to language modeling.8
2.2 College Majors: Demographic Representation
In this section, I conduct analysis to determine which demographic groups may be significantly affected by generative AI's potential effect on certain college majors. Unequal effects on different demographic groups may be concerning if gaps in pay and work opportunities are exacerbated. Papers looking at ex ante occupational and patent exposure have shown that AI – encompassing generative AI – could increase inequality in certain scenarios (Webb 2020; Pizzinelli et al. 2024; see also Cornelli et al. 2023).9
Figure 2 plots the relationships between each college major's language modeling and image generation AIOE z-scores and its percentage of whites, blacks, Asians, Hispanics, and females – all based on the first listed major. I find that college majors with higher percentages of Hispanic graduates are significantly more exposed to language modeling (correlation coefficient of 0.21). College majors with higher percentages of Asian graduates are significantly more exposed to image generation (correlation coefficient of 0.47). Given that high exposure to generative AI may mean automation or augmentation of the jobs of these demographic groups, it is ambiguous whether the significant positive correlations suggest that the welfare of Hispanic and Asian graduates will be improved or worsened.
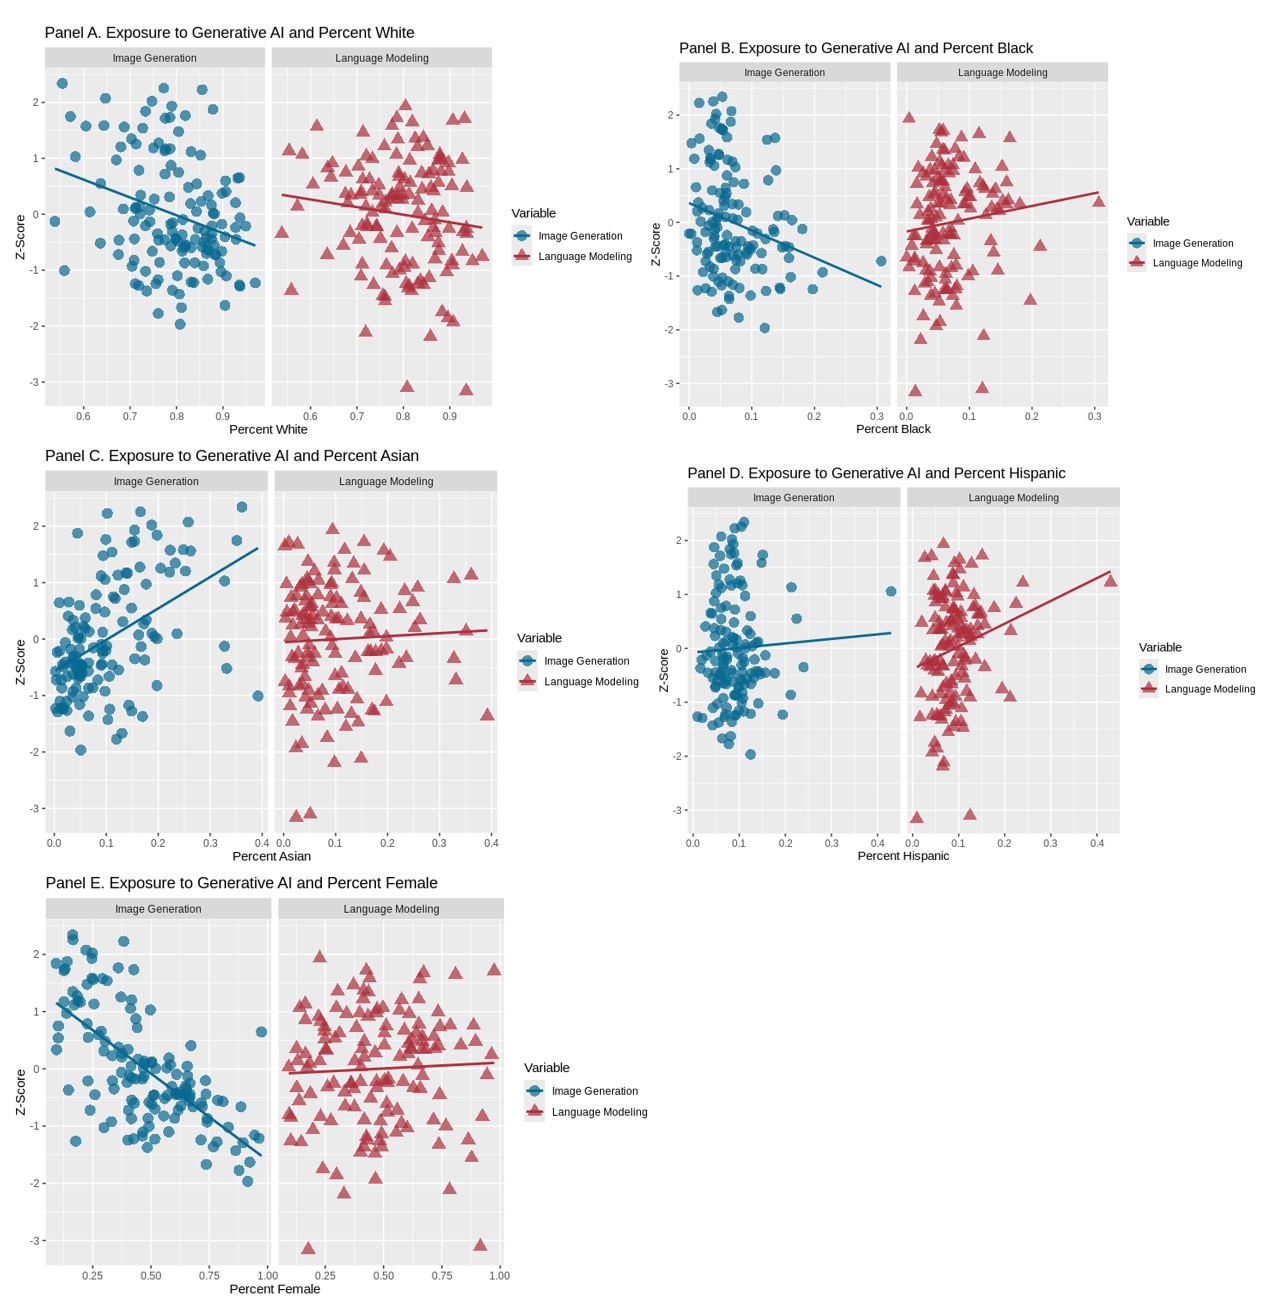
Note: The percent white, black, Asian, Hispanic, and female are the portion of the weighted population of that demographic group within a college major. The z-scores are measures of the distance between the exposure score for that major and the mean exposure score for all majors.
Source: Felten et al. (2023) generative artificial intelligence (AI) occupational exposure scores and the biannual National Survey of College Graduates 2013-2021.
College majors with higher percentages of female, white, and black graduates are significantly less exposed to image generation (correlation coefficients of -0.67, -0.29, and -0.25, respectively). This suggests that females, whites, and blacks may be less affected by this application of generative AI than other demographic groups. No other relationships between demographic groups and generative AI exposure, depicted in Figure 2, are significant.
2.3 Educational Institutions
Finally, I conduct analysis to determine which types of educational institutions may be most affected by generative AI's predicted impact on the labor market, as Conzelmann et al. (2023) demonstrated that the effects of labor market changes can vary by institution type. I examine exposure to generative AI by 1994 Carnegie classification, which is determined by the type and number of academic degrees awarded by the institution. I conduct this analysis for (1) all respondents, based on the educational institution for their first bachelor's degree, and (2) only respondents with a graduate degree, based on the educational institution for their highest degree.10
In Table 4, at both the bachelor's and graduate levels, Liberal Arts I institutions have the highest z-score for language modeling exposure; Research University I institutions have the highest z-score for image generation exposure.11 This suggests that any effect generative AI may have on labor demand would translate into a larger effect in student engagement and staffing at these educational institutions.
Table 4. Exposure to Generative AI by Type of Educational Institution
| Bachelor's Graduates | Graduate Programs Graduates | |||||
|---|---|---|---|---|---|---|
| Percent | Z-Score for Language Modeling | Z-Score for Image Generation | Percent | Z-Score for Language Modeling | Z-Score for Image Generation | |
| Research University I | 26.3 | 0.84 | 1.53 | 33.5 | 0.24 | 1.42 |
| Research University II | 8.18 | 0.11 | 0.91 | 8 | 0.46 | 1.23 |
| Doctorate Granting I | 6.8 | 0.5 | 0.12 | 8.85 | 0.27 | 0.23 |
| Doctorate Granting II | 6.72 | 0.25 | 0.99 | 7.02 | -0.07 | 0.94 |
| Comprehensive I | 30.3 | -0.3 | -0.93 | 26.4 | -0.25 | -0.6 |
| Comprehensive II | 2.82 | -0.31 | -0.53 | 1.74 | -0.87 | -0.92 |
| Liberal Arts I | 5.12 | 1.47 | 0.16 | 0.95 | 2.1 | -0.15 |
| Liberal Arts II | 8.75 | -0.47 | -1.34 | 3.84 | -0.33 | -1.12 |
| Specialized and Tribal Institutions | 4.97 | -2.1 | -0.92 | 9.71 | -1.53 | -1.02 |
Note: The percent is the portion of the weighted population of survey respondents who attended that type of educational institution. The z-scores are measures of the distance between the exposure score for that type of educational institution and the mean exposure score for all educational institutions.
Source: Felten et al. (2023) generative artificial intelligence (AI) occupational exposure scores and the biannual National Survey of College Graduates 2013-2021.
3. Discussion
3.1 College Majors
First, the results show Mathematics and Computer Science-related fields have relatively high exposure to both applications of generative AI, while Engineering and Technology-related fields have relatively high exposure to image generation. The results also show that Accounting and Political Science and Government are two of the most popular majors that are most exposed to language modeling. At least a supermajority (67 percent) of those with Mathematics and Computer Science-related, Engineering and Technology-related, and Accounting majors are in mathematics and computer science, engineering, and management occupations, which have relatively high occupational exposure scores in Felten et al. (2023).12 Thirty (30) percent of those who majored in Political Science and Government are in management occupations, while 35 percent are in legal or office/administration occupations.
The result that STEM-related fields have higher exposure than non-STEM fields (including Business/Economics fields and Liberal Arts/Humanities fields) align with Bick et al. (2024)'s early study on generative AI adoption. They found that 46 percent of workers who majored in STEM use generative AI at work, compared with 40 percent for workers who majored in business, economics, or communication and 22 percent for all other majors, including liberal arts and humanities. Generative AI adoption at work is highest for computer/mathematical occupations (49.6 percent) and management occupations (49.0 percent). Although generative AI adoption at work is only about 20 percent for legal and office/administrative occupations, qualitative articles suggest there may be higher use rates in the future, especially for lawyers (Davenport 2024; Kauffman 2024; Laus 2023).
The findings also comport with Mohnen and Lee (2024), who demonstrated that the demand for AI skills in computer and mathematical occupations has grown significantly since 2010, especially for computer scientists, data scientists, and statisticians. The authors noted that those in computer and mathematical occupations are largely responsible for the development and implementation of AI technologies.
A college major's high exposure to generative AI means that graduates of that major are going into occupations that may be automated away or augmented by the technology. If the associated occupations are automated away, the labor demand for graduates with majors in STEM fields, Accounting, and Political Science and Government may decrease and cause declines in staffing and student engagement in these departments at educational institutions. On the other hand, if the associated occupations are augmented, the labor demand for these graduates may rise and cause growth in affiliated departments.
3.2 Demographic Groups
Second, the analysis suggests demographic groups may be affected unequally by generative AI's potential effect on certain college majors. College majors with higher percentages of Hispanic graduates are significantly more exposed to language modeling, whereas those with higher percentages of Asian graduates are significantly more exposed to image generation. Further, college majors with higher percentages of females, whites, and blacks may be less exposed to image generation than other demographic groups. Given that higher exposure to generative AI may mean automation or augmentation of the jobs of these demographic groups, it is ambiguous whether the significant positive correlations will translate into an increase or decrease in the welfare of Hispanic and Asian graduates. The results align with early empirical studies showing that generative AI use is unequal across varying demographics (Aldasoro et al. 2024a; Aldasoro et al. 2024b; Bick et al. 2024; Emanuel and Harrington 2024; Humlum and Vestergaard 2024).
3.3 Educational Institutions
Finally, the analysis suggests that Liberal Arts I and Research University I institutions may be most affected by generative AI's predicted impact on the labor market. Adjustments to staffing and student engagement caused by language modeling's effect on labor demand may be most pronounced at Liberal Arts I institutions. This is likely driven by the high percentage of Social Science majors relative to other types of institutions. Changes caused by image generation's effect on labor demand may be highest at Research University I institutions. This is likely driven by the high percentage of STEM majors relative to other types of institutions.
References
Acton, Riley K. (2021). Community college program choices in the wake of local job losses. Journal of Labor Economics 39(4), 1129-1154.
Aldasoro, Iñaki, Olivier Armantier, Sebastian Doerr, Leonardo Gambacorta, and Tommaso Oliviero (2024a). Survey evidence on gen AI and households: job prospects amid trust concerns (PDF). BIS Bulletin No. 86.
Aldasoro, Iñaki, Olivier Armantier, Sebastian Doerr, Leonardo Gambacorta, and Tommaso Oliviero (2024b). The gen AI gender gap (PDF). BIS Working Papers No. 1197.
Bick, Alexander, Adam Blandin, and David J. Deming (2024). The rapid adoption of generative AI. NBER Working Paper No. 32966.
Brynjolfsson, Erik, Danielle Li, and Lindsey R. Raymond (2023). Generative AI at work. NBER Working Paper No. 31161.
Conzelmann, Johnathan G., Steven W. Hemelt, Brad Hershbein, Shawn M. Martin, Andrew Simon, and Kevin M. Stange (2023). Skills, majors, and jobs: does higher education respond? NBER Working Paper No. 31572.
Cornelli, Giulio, Jon Frost, and Saurabh Mishra (2023). Artificial intelligence, services globalisation and income inequality (PDF). BIS Working Papers No. 1135.
Dell'Acqua, Fabrizio, Saran Rajendran, Edward McFowland III, Lisa Krayer, Ethan Mollick, François Candelon, Hila Lifshitz-Assaf, Karim R. Lakhani, and Katherine C. Kellogg (2023). Navigating the jagged technological frontier: field experimental evidence of the effects of AI on knowledge worker productivity and quality (PDF). Harvard Business School Technology & Operations Mgt. Unit Working Paper No. 24-013.
Davenport, Tom (2024). Early adopters of gen AI in law. Forbes, https://www.forbes.com/sites/tomdavenport/2024/06/01/early-adopters-of-gen-ai-in-law/.
Del Rossi, Alison F., and Joni Hersch (2016). The private and social benefits of double majors. Journal of Benefit-Cost Analysis 7(2), 292-325.
Eloundou, Tyna, Sam Manning, Pamela Mishkin, and Daniel Rock (2024). GPTs are GPTs: Labor market impact potential of LLMs. Science 384(6702), 1306-1308.
Emanuel, Natalia, and Emma Harrington (2024). Exposure to generative AI and expectations about inequality. Liberty Street Economics.
Felten, Edward, Manav Raj, and Robert Seamans (2021). Occupational, industry, and geographic exposure to artificial intelligence: a novel dataset and its potential uses. Strategic Management Journal 42(12), 2195-2217.
Felten, Edward, Manav Raj, and Robert Seamans (2023). Occupational heterogeneity in exposure to generative AI. Working Paper.
Gilpin, Gregory A., Joseph Saunders, and Christiana Stoddard (2015). Why has for-profit colleges' share of higher education expanded so rapidly? Estimating the responsiveness to labor market changes. Economics of Education Review 45(C), 53-63.
Gmyrek, Paweł, Janine Berg, and David Bescond (2023). Generative AI and jobs: A global analysis of potential effects on job quantity and quality (PDF). ILO Working Paper 96.
Grosz, Michael (2022). Do postsecondary training programs respond to changes in the labor market? Journal of Human Capital 16(4), 461-487.
Hersch, Joni, and Jean Xiao (2016). Sex, race, and job satisfaction among highly educated workers. Southern Economic Journal 83(1), 1-24.
Humlum, Anders, and Emilie Vestergaard (2024). The adoption of ChatGPT (PDF). IZA DP No. 16992.
Kauffman, Brittany (2024). The implications of generative AI: from the delivery of legal services to the delivery of justice. University of Denver Institute for the Advancement of the American Legal System Blog.
Laus, Maria L. (2023). Big law embracing generative AI: firms seek top talent to harness the power of AI. JD Journal, https://www.jdjournal.com/2023/11/07/big-law-embracing-generative-ai-firms-seek-top-talent-to-harness-the-power-of-ai/.
Mohnen, Paul, and David Lee (2024). Recent trends in the demand for AI skills. Federal Reserve Bank of Atlanta, Macroblog.
National Center for Science and Engineering Statistics (NCSES) 2025. National Survey of College Graduates: 2013-2021. Alexandria, VA: U.S. National Science Foundation.
Noy, Shakked, and Whitney Zhang (2023). Experimental evidence on the productivity effects of generative artificial intelligence. Science 381(6654), 187-192.
Pizzinelli, Carlo, Augustus Panton, Marina M. Tavares, Mauro Cazzaniga, and Longji Li (2024). Gen-AI: Artificial intelligence and the future of work. IMF Staff Discussion Note 2024/001.
Webb, Michael (2020). The impact of artificial intelligence on the labor market. Working Paper, https://www.michaelwebb.co/webb_ai.pdf.
Weinstein, Russell (2022). Local labor markets and human capital investments. Journal of Human Resources 57(5), 1498-1525.
1. The views expressed in this paper are solely those of the author and should not be interpreted as reflecting the views of the Board of Governors or the Federal Reserve System. The author would like to thank Jeff Allen, Nick Carollo, Jake Clark, Julia Gouny, Flora Haberkorn, Anni Isojaervi, Nathan Palmer, Paul Soto, and Uzma Wahhab of the Federal Reserve Board for their feedback on earlier drafts. Return to text
2. There are 478,087 respondents total from the five waves of the NSCG (2013, 2015, 2017, 2019, and 2021). I drop all 25,335 observations for which the field of study is not reported (i.e., left blank on the survey). Return to text
3. The variable definitions document says second major or minor, but the survey instrument only asks for second major. The wording in the variable definitions document is a vestige from prior waves of the survey, which had asked for a second major or minor (see Del Rossi and Hersch 2016). Unlike the other waves, the 2019 wave does not have a variable specifying the second major of the respondent in the public use file, but I can discern whether the graduate had a second major. Return to text
4. The nine major categories are (1) Mathematics and Computer Science-related fields; (2) Biological and Health Science-related fields; (3) Physical Science-related fields; (4) Engineering and Technology-related fields; (5) Education-related fields; (6) Economics and Business-related fields; (7) Arts and Humanities-related fields; (8) Social Science-related fields; and (9) Other Non-Science and Engineering-related fields. The first four major categories are generally considered Science, Technology, Engineering, and Mathematics (STEM) studies and the last three major categories are generally considered Liberal Arts (see Del Rossi and Hersch 2016). Return to text
5. I match the six-digit SOC codes to the NSCG occupation codes. The SOC and NSCG occupation categories are quite similar. There are some instances where the NSCG occupation categories are not as granular as the SOC occupation categories, given that the percentages of college graduates working in those occupation categories were very low (e.g., transportation and material moving). For these categories, the NSCG occupation category score is the average of the scores of the related SOC occupation categories. Observations with the generic Other Occupations and Logical Skip (e.g., not working right now) responses are dropped from all five waves; 76,761 are dropped. Due to their infrequency, some occupation codes in the 2013, 2015, and 2017 waves were merged with others or relabeled in the 2019 and 2021 waves. These are Oceanographers, Astronomers, Sociologists, Agricultural Engineers, Mining and Geological Engineers, and Nuclear Engineers. Similarly, some fields of study in the 2013, 2015, and 2017 waves were merged with others, including Oceanography, History of Science, Geophysical and Geological Engineering, Mining and Minerals Engineering, Naval Architecture and Marine Engineering, and Petroleum Engineering. I assign the merged or relabeled occupation and field of study codes in the 2013, 2015, and 2017 waves the updated codes from the 2019 and 2021 waves. Return to text
6. For example, for Table 2, the z-score is calculated as the difference between the exposure measure for i college field of study category and the mean of the exposure measures for all the college field of study categories, divided by the standard deviation of how dispersed the college field of study category exposure measures are in relation to the mean. Return to text
7. Given that some respondents have a double major or a graduate degree, I conduct further analysis where (1) I only examine respondents who solo-majored, (2) I choose the most exposed major for respondents who double-majored, and (3) I only examine respondents whose highest degree is a bachelor's. The results are quite similar. I additionally examine the college majors that may be least affected by generative AI's predicted impact on the labor market. Consistent with Table 2 where Biological and Health Science-related fields scored the lowest for both language modeling and image generation exposure, additional analysis demonstrates that Nursing is one of the top ten most popular majors with bottom ten exposure scores for both language modeling and image generation. Return to text
8. From information about type of degree and field of study for the respondent's highest degree, I create mutually exclusive categories for graduate degree types. I examine exposure to generative AI by graduate degree type. Generally, those with graduate degrees have higher exposure than those with only a bachelor's. MDs and Other Professional Degrees (many of which are health-related) have the lowest z-scores for both language modeling and image generation exposure, which comports with Biological and Health Science-related fields scoring the lowest for both measures of exposure in Table 2. PhDs in STEM have the highest z-score for image generation, which aligns with STEM fields scoring the highest for image generation exposure in Tables 2 and 3. JDs have the highest z-score for language modeling, which comports with the Political Science and Government result in Table 3. Return to text
9. Webb (2020) has argued that AI will increase inequality for the top 10 percent of the income distribution, but reduce inequality measured as the ratio of the 90th to the 10th percentile of wages because exposure to displacement is higher for certain high-wage occupations. Pizzinelli et al. (2024) provided three scenarios about AI's impact on income equality, where capital income inequality and wealth inequality increase in all three scenarios, but labor income inequality decreases in the high displacement scenario, not taking into consideration productivity. Return to text
10. 59,520 respondents for the bachelor's analysis and 19,018 respondents for the graduate programs analysis are dropped because they attend institutions that do not have 1994 Carnegie classification codes. Return to text
11. An institution is designated a Research University I if it offers a full range of baccalaureate programs, award 50 or more doctoral degrees each year, and give high priority to research. Liberal Arts I and II institutions are primarily undergraduate colleges. The difference between Liberal Arts I and II institutions is that Liberal Arts I institutions award 40 percent or more of their bachelor's degrees in Liberal Arts-related fields and are more restrictive in admissions. Specialized and Tribal Institutions include a wide variety of institutions, including health profession schools, engineering schools, teaching schools, business schools, arts schools, and schools that are Tribally controlled and located on reservations. Return to text
12. 46 percent of those who majored in Mathematics and Computer Science-related fields are in mathematics and computer science-related occupations. 20 percent are in management-related occupations. 30 percent of those who majored in Engineering and Technology-related fields are engineers. 15 percent are in mathematics and computer science-related occupations, and another 25 percent are in management-related occupations. 75 percent of those who majored in Accounting are in management-related occupations. Return to text
Timmerman, Jean Xiao (2025). "Educational Exposure to Generative Artificial Intelligence," FEDS Notes. Washington: Board of Governors of the Federal Reserve System, February 26, 2025, https://doi.org/10.17016/2380-7172.3703.
Disclaimer: FEDS Notes are articles in which Board staff offer their own views and present analysis on a range of topics in economics and finance. These articles are shorter and less technically oriented than FEDS Working Papers and IFDP papers.