FEDS Notes
April 16, 2025
European Energy Import Dependency
Julianna Sterling, Missaka Warusawitharana and Xiangyu Zhang1, 2
Introduction
This note examines the energy import dependency of the European Union over time. This issue has risen in salience following recent developments and the ongoing economic challenges faced by many European countries.
Using comprehensive data from Eurostat, this note documents a steady increase in energy import dependency of European Union nations over the past 30 years. This trend arises even though energy usage itself has followed a hump shape over this period – an initial increase was followed by a subsequent reversal. Indeed, the energy efficiency of the European economy has risen notably over the period. The rising energy import dependency is driven by a decline in domestic energy production, which has accelerated over the past decade. Furthermore, the overall decline in energy production occurs despite an increase in renewable energy production, as this is not sufficient to offset decreases in the production of energy from hydrocarbons and nuclear power.
We next carry out a scenario analysis that aims to project the energy dependency of Europe ten years from now. For simplicity, this scenario analysis assumes that both overall energy consumption and the production of non-renewable energy remains unchanged from 2023 and considers different growth rates for renewable energy. Our findings indicate that Europe would likely remain reliant on imports to meet a significant portion of domestic energy needs over the coming decade, thus posing a continuing economic and security vulnerability (see Carfora et al., 2022 and Demertzis, 2024).
Data
This note uses Eurostat's "Simplified Energy Balances" and "GDP and Main Components" databases for energy and economic data. It calculates the energy import dependency ratio, energy intensity, and primary energy production across 27 EU countries (excluding the UK) from 1990 – 2023. The note uses the terajoule (TJ) as the unit of measurement for energy.3
We first define gross available energy (GAE), which indicates the total amount of energy consumed within a year. This measure comprises of primary production, recovered & recycled products, net imports, and changes in energy stocks, as per the Eurostat Glossary. The formula is as following:
$$$$ GAE\ =\ Primary\ production\ + Recovered\ \text{&}\ Recycled\ products\ +\ Import\ -\ Export\ +\ Stock\ changes $$$$
We next derive the energy import dependency ratio, a key indicator of the European Union's reliance on imported energy. Specifically, the dependency ratio indicates the amount of energy an economy must import to meet domestic energy needs. As per Eurostat (2022) and Eurostat (2024), the energy import dependency ratio is defined as the ratio of net energy imports over gross available energy, expressed as a percentage:
$$$$ Energy\ Import\ Dependency\ Ratio \text{(%)}\ = \frac{Import - Export}{GAE} \ast 100 $$$$
Subsequently, we assess energy intensity, which measures the units of energy consumed per unit of gross domestic product (GDP), thus serving as a proxy for energy efficiency. It is computed as follows:
$$$$ Energy\ Intensity=\frac{GAE}{GDP} $$$$
Due to the unavailability of GDP data from Eurostat for the years 1990 to 1995, our energy intensity data series begins in 1995.4
Last, we analyze the primary energy production from various fuel sources, including total fuels, natural gas, nuclear heat, oil and petroleum products, renewables and biofuels, and solid fossil fuels. As per Eurostat (2022), primary energy production includes the extraction of coal (including lignite), drilling for oil, and generating heat and electricity through hydroelectric, wind, nuclear, and solar technologies.
Historical Trends
Figure 1 illustrates energy import dependency of the European Union, expressed as a percentage, from 1990 to 2023. This ratio is higher than it was in 1990, when imports constituted 50 percent of its total fuel consumption. While there has been some fluctuation, including in 2020 when energy demand dropped during the pandemic, the overall trend has been of increased energy import dependency. In 2022, the dependency ratio reached its highest point over the sample period of 62.5 percent, consistent with Eurostat (2024). The rising import energy dependency has sparked concern among European policy makers and motivated policies to boost domestic energy production. For example, the REPowerEU plan (European Commission, 2022) aims to sharply decrease European fossil fuel import dependence and replace this reduction in energy supply with renewables production. The implementation of this plan, combined with reductions in Russian gas imports due to ongoing sanctions, likely led to the drop in energy import dependency over this period, with the most recently updated data estimating an import dependency ratio of 58.3 percent.
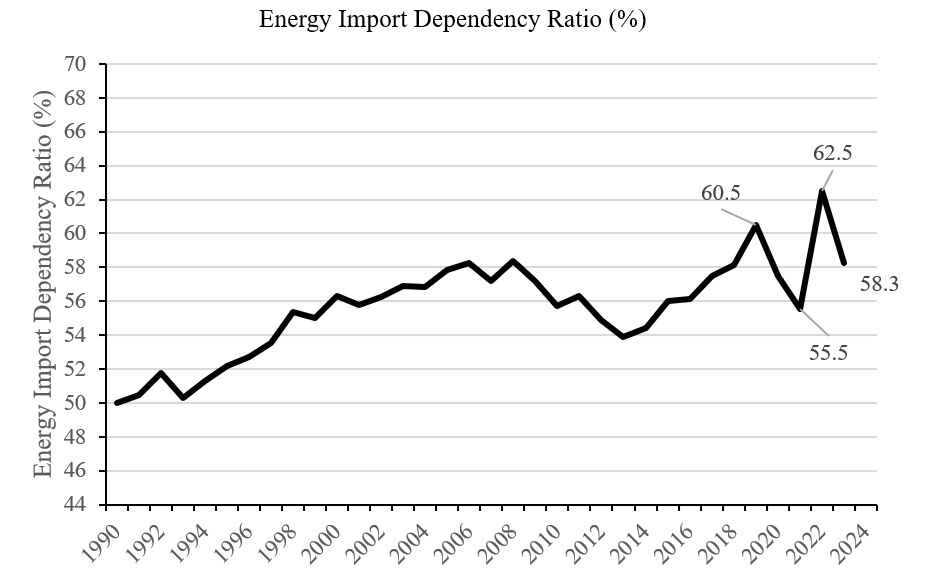
Note: A time series chart of European energy import dependency from 1990-2023, demonstrated as the energy import dependence ratio in percentages.
Source: Eurostat NRG_QUANTA
Figure 2 depicts gross available energy in the European Union from 1990 to 2023. Energy consumption in the European Union has steadily increased from 1990 to 2007. Energy consumption then fell during the financial crisis of 2007-09. Notably, even as Europe recovered from the financial crisis, energy consumption continued to decline. By 2023, gross available energy fell to 56.1 million TJ, well below the level observed in 1990.
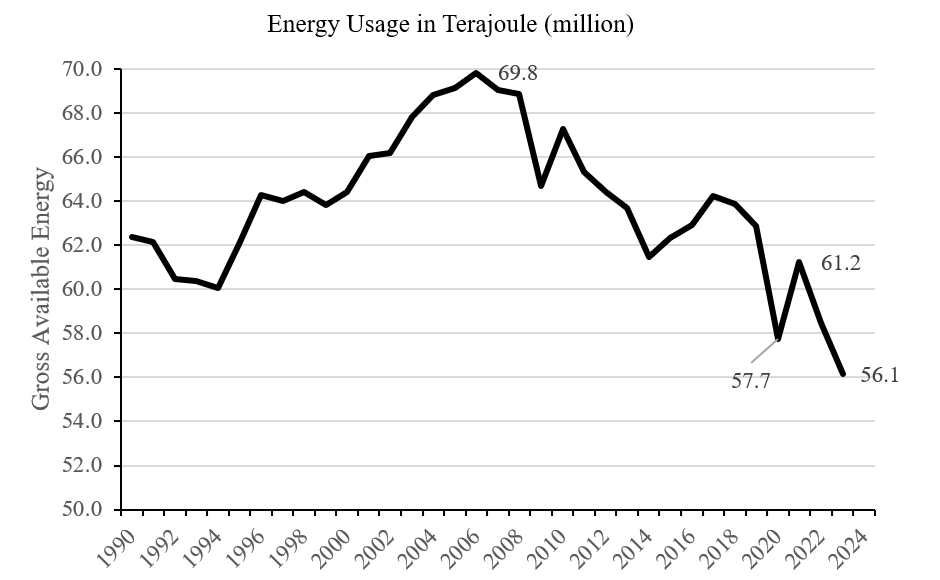
Note: A time series plot of EU energy usage from 1990-2023, demonstrated as gross available energy in terajoules (million).
Source: Eurostat NRG_QUANTA
The above time series behavior indicates that the energy efficiency of the European economy has risen over time. This can be seen clearly in Figure 3. Energy intensity, which measures the TJ consumed in producing one million euro of GDP, has declined steadily over the sample period. By 2023, energy intensity had fallen to 4.3 TJ per million euro, about a 40 percent reduction from the level observed in 1995.
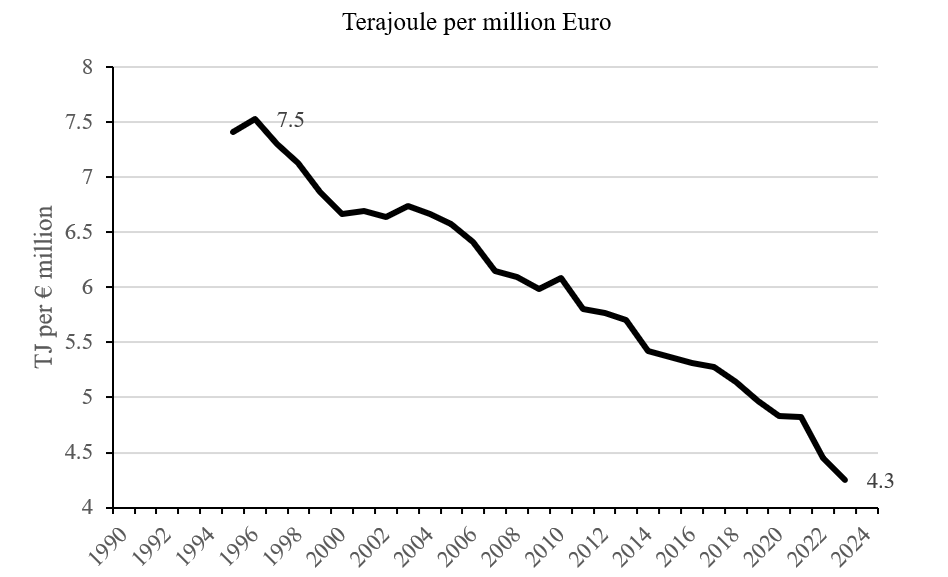
Note: A time series plot of energy intensity in the EU from 1995-2023 demonstrated in TJ per € million.
Source: Eurostat NAMA_10, Eurostat NRG_QUANTA
The rise in energy import dependency shown in Figure 1 and the decline in energy intensity depicted in Figure 3 seems, at first glance, to be contradictory. These two trends can be reconciled by examining overall domestic energy production. As shown in Figure 4, energy production in the European Union has declined over the sample period. While domestic energy production remained mostly stable from 1990 to 2010, there has been a steeper decline over the past decade. This decline in energy production has resulted in the European Union becoming more dependent on energy imports, even as the economy has become more energy efficient.
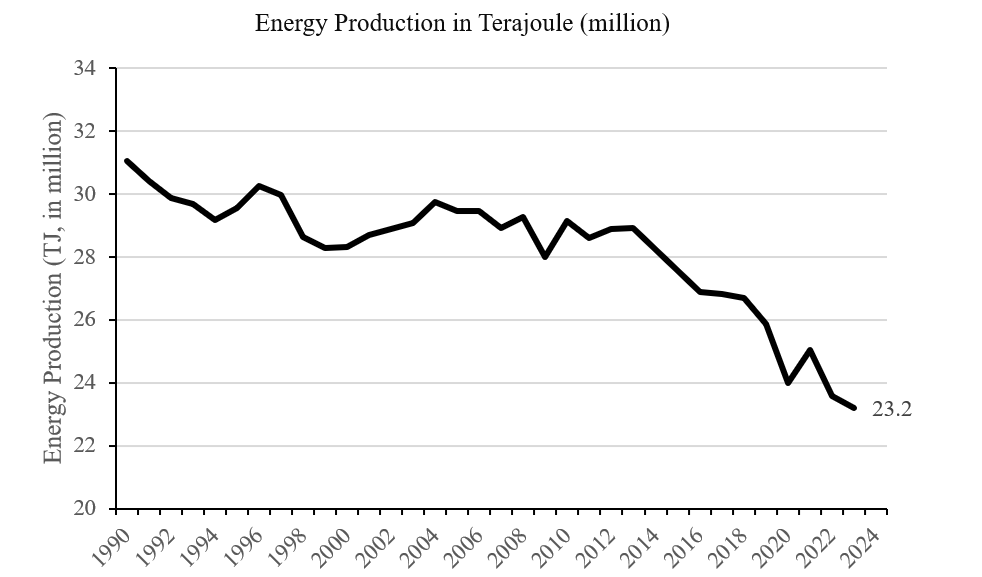
Note: Trends in overall energy production in the EU from 1990-2023, demonstrated in million terajoules.
Source: Eurostat NRG_QUANTA
We next examine domestic energy production to further understand the observed time series pattern for overall energy production. Figure 5 breaks down energy production by source in the European Union from 1990 to 2023. One immediately observes a striking divergence. While the production of renewable energy and biofuels has risen over this period, the production of solid fossil fuels, natural gas, oil and petroleum products and nuclear energy have all declined. Energy production from renewables and biofuels has more than tripled over the sample period and constitutes more than 40 percent of overall energy production in 2023. However, contemporaneously there was an equally steep decline in energy production from solid fossil fuels (coal) as well as clear declines in energy production from oil and natural gas. Focusing on the past decade, the steeper decline in overall energy production observed in Figure 4 stems from a combination of slower growth in renewable energy production and a steeper decline in the production of oil and petroleum products, relative to the prior decade.
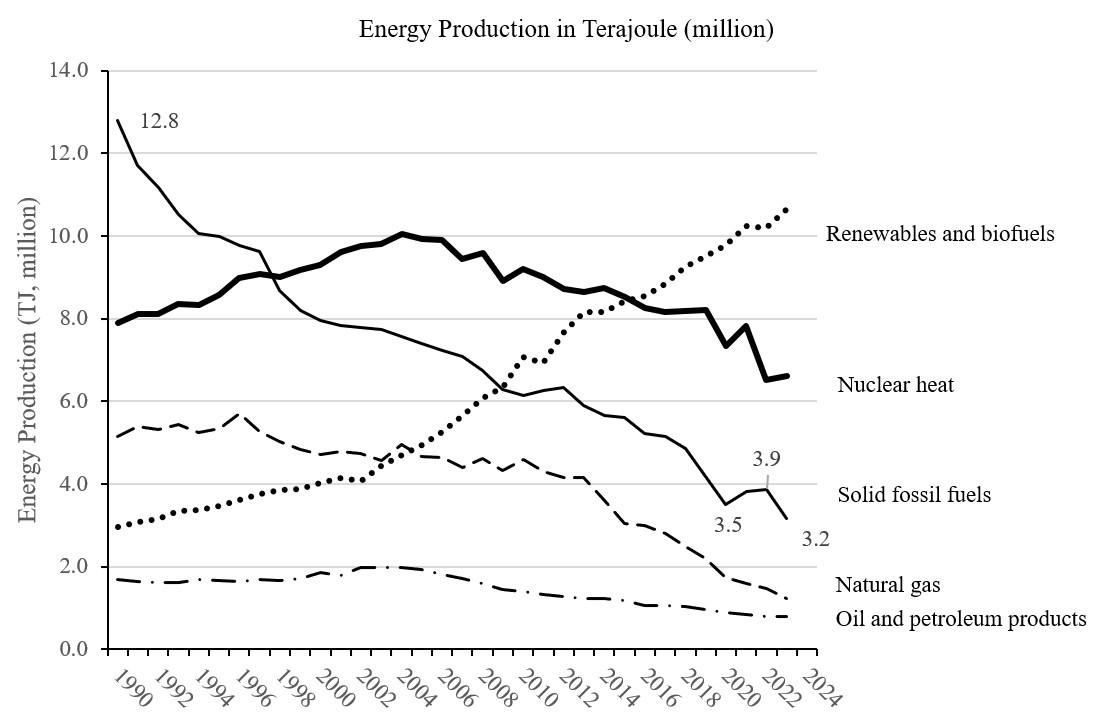
Note: A time-series breakdown of energy production by source in the EU from 1990-2023, demonstrated in million terajoules.
Source: Eurostat NRG_QUANTA
Changes in energy production are driven by a myriad of factors, including resource availability and discovery, technology change, production cost and policy choices. The observed time series pattern in energy production is likely driven in part by deliberate policy choices made by European authorities. For example, as the European Union has moved to reduce emissions, it has prioritized renewable energy production and provided incentives and regulations to encourage such a shift (European Commission 2024). In parallel, certain European authorities have de-emphasized exploration and extraction of the North Sea oil fields, with Denmark, for example, opening up their coastline for wind power development as an alternative (Washington Post, 2020). Over the past decade, there has also been a push to reduce nuclear energy production due to safety concerns, even though such production does not increase emission (Reuters, 2024). Moreover, the hydraulic fracturing technology that has enabled a sharp increase in natural gas production in the United States has not been widely adopted in the European Union (Bomberg, 2017).
Scenario Analysis
We next use Eurostat data to project the extent of the European Union's dependence on imported energy in 2033. Such projections help inform the degree to which one may wish to be concerned about such import dependency, especially as the geopolitical environment increases in complexity. We derive these projections through data-driven scenario analysis that rely on several simplifying assumptions. As such, these projections should not be viewed as representing a forecast.
Our scenario analysis takes energy import dependency in 2023 as a starting point. We then project forward key components of energy production. For simplicity, we assume that both gross available energy and production of non-renewable energy will remain unchanged over the next decade. I.e., we fix gross available energy at 56.1 million TJ and non-renewable production at 12.5 million TJ. While the historical trends suggest that both series may decline, such declines could have offsetting impacts on energy import dependency. We layer on to these assumptions different growth rates for renewable energy. In the first scenario, we assume that renewable energy will grow at the same rate as observed over the past decade. In the second scenario, we consider the possibility of stronger growth in renewable energy production, which we calibrate by using renewable energy growth from the prior decade.5 We acknowledge the possibility of a third scenario that incorporates a further slowdown in renewable energy production – this scenario may lead to an increase in the energy import dependency.
One additional wrinkle is that the measure of energy import dependency reported in Figure 1 also accounts for changes in energy stocks. We simplify our analysis by dropping this element from the definition of energy import dependency. This changes the import dependency measure in 2023 from 58.35 to 58.8 percent.
Findings
Our first scenario considers an annual growth rate of renewable energy of 2.7 percent.6 Applied to a base renewable energy production in 2023 of 10.6 million TJ, projected renewable energy production in 2033 is 13.9 million TJ. Based on these figures, projected energy import dependency is calculated with the following formula:
$$$$ 1-\frac{\left(Projected\ renewable\ energy\ production+Nonrenewable\ energy\ production\right)}{Gross\ Available\ Energy}.$$$$
This yields a projected value of 52.9 percent, indicating that under this scenario, the European Union will continue to be reliant on imports for the majority of its energy needs.
Our second scenario considers a more robust annual growth rate of renewable energy production of 6.3 percent.7 Applied to a base renewable energy production in 2023 of 10.6 million TJ, one obtains a projected renewable energy production in 2033 of 19.6 million TJ. Applying the same formula as above, projected energy import dependency is 42.7 percent. The higher projected growth rate of renewable energy production in this scenario leads to a lower import dependency. Nonetheless, even in this scenario the European Union would depend on imports for more than two-fifths of their overall energy needs, signifying a continuing economic and security vulnerability.
In the more positive scenario of continued declines in energy consumption combined with a reversal of the decrease in non-renewable energy production, one would observe a steeper drop in energy import dependency. This would help abate the vulnerability observed in the two scenarios delineated above. Recent comments made by European policymakers may be reflective of such a viewpoint (see Financial Times, 2024).
Conclusion
Over the past 30 years, the European Union's energy import dependency has increased. Over this period, overall domestic energy production has fallen, even as energy efficiency has increased, stabilizing consumption. The decline in overall energy production owes to sharp increases in renewable energy production failing to offset falling energy production from hydrocarbons and nuclear fission. Scenario analysis indicates that the European Union could remain dependent on energy imports in the medium term, posing ongoing economic and security risks.8 This dependence on imported energy supplies could make the continent more vulnerable to external energy supply shocks, including geopolitical conflicts.
References
Bomberg, Elizabeth. "Fracking and framing in transatlantic perspective: a comparison of shale politics in the US and European Union." Journal of Transatlantic Studies, Vol. 15, pp. 101-120, June 2017, https://doi.org/10.1080/14794012.2016.1268789.
Brodny, Jaroslaw and Magdalena Tutak. "Assessing the energy security of European Union countries from two perspectives – a new integrated approach based on MCDM methods", Applied Energy, Vol. 347, pp. 1214-43, Oct. 2023, https://doi.org/10.1016/j.apenergy.2023.121443.
Carfora, Alfonso, Rosaria Vega Pansini and Giuseppe Scandurra. "Energy dependence, renewable energy generation and import demand: Are EU countries resilient?" Renewable Energy, Vol. 195, 2022, pp.1262-1274, https://doi.org/10.1016/j.renene.2022.06.098.
Demertzis, Maria. "Trade at the heart of the EU's Economic Security." Intereconomics Review of European Economic Policy, Vol. 59 No. 6 pp. 313-318, 2024.
European Commission. REPowerEU at a glance. 2022.
Eurostat. Annual National Accounts (NAMA 10). Eurostat, 14 Mar. 2024. [Data set]. Accessed 3 February 2025.
Eurostat. Energy Intensity (NRG_QUANTA) (NRG_IND) (NRG_BAL_S). Eurostat, 15 May 2024. [Data set]. Accessed 3 February 2025.
Eurostat. Energy Statistics – an overview. May 2024.
Eurostat. Glossary. 2022.
The Financial Times. "Lagarde and Von der Leyen: Europe has got the message on change." 31, January 2025.
Mišík, Matúš. "The EU needs to improve its external energy security." Energy Policy, Vol. 165, pp. 1129-30, 2022, https://doi.org/10.1016/j.enpol.2022.112930.
Reuters. "New EU renewable energy target faces nuclear roadblock." 16 December 2024.
Washington Post. "Denmark becomes first major oil-producing nation to set deadline to end extraction." 04 December 2020.
1. The views in this note are those of the authors and should not be interpreted as reflecting the views of the Board of Governors of the Federal Reserve System or their staff. Return to text
2. Julianna Sterling and Missaka Warusawitharana are affiliated with the Board of Governors of the Federal Reserve System; and Xiangyu Zhang is affiliated with Johns Hopkins University, School of Advanced International Studies. Return to text
3. One terajoule is equivalent to 1012 (or one trillion) joules. Return to text
4. We use the Eurostat series NAMA 10 to obtain GDP. Return to text
5. There is a noticeable slowdown in the growth rate of renewable energy and biofuels production in the European Union. While renewable energy grew at an annual rate of 6.3 percent from 2003 to 2013, this growth rate slowed to 2.7 percent from 2013 to 2023. This slowdown may reflect geophysical limitations on the production of hydroelectricity, wind and solar power. Return to text
6. This corresponds to the observed growth rate from 2013 to 2023. Return to text
7. This corresponds to the observed growth rate from 2003 to 2013. Return to text
8. Mišík (2022) and Brodny and Tutak (2023) assesses the energy security of European Union countries. Return to text
Sterling, Julianna, Missaka Warusawitharana, and Xiangyu Zhang (2025). "European Energy Import Dependency," FEDS Notes. Washington: Board of Governors of the Federal Reserve System, April 16, 2025, https://doi.org/10.17016/2380-7172.3768.
Disclaimer: FEDS Notes are articles in which Board staff offer their own views and present analysis on a range of topics in economics and finance. These articles are shorter and less technically oriented than FEDS Working Papers and IFDP papers.