FEDS Notes
July 19, 2024
Evaluating Forecast Performance of Market-based Measures of Inflation Expectations in Europe
Shaily Acharya, Nira Harikrishnan, Thomas M. Mertens, and Tony Zhang1
Introduction
Predictions of future inflation rates shed light on the path of the economy and inform central banks' policy rate decisions. Two commonly used sources of inflation forecasts are surveys and market-based inflation expectations. Survey-based inflation expectations, such as those from the Survey of Professional Forecasters, are derived by eliciting responses from a group of respondents about their beliefs. Survey-based expectations could suffer from small sample sizes, low frequency of observations, or behavioral biases of survey participants (Dierks et. al, 2023, Grothe and Meyler, 2015). Market-based expectations are inferred from the prices of financial assets, such as inflation swaps, whose payouts depend on realized inflation. The prices of these financial assets are readily available at high frequencies, but they may provide a biased estimate of inflation expectations because they include other factors such as risk premia (Ang, Bekaert and Wei, 2008).
How well do market-based inflation expectations forecast inflation? Recent research from the United States finds that inflation swaps can provide a useful source of information about future inflation whose accuracy is at least on par with leading survey-based alternatives (Dierks et. al, 2023, Mertens and Zhang, 2023). In this note, we explore the performance of market- and survey-based expectations for the euro area and United Kingdom. We compare forecasts derived from inflation swap prices with forecasts from the Survey of Professional Forecasters for the euro area, Bank of England forecasts for the United Kingdom, and Blue Chip survey and Consensus Economic survey for both.
We show that forecasts based on inflation swaps provide relatively accurate inflation forecasts when compared against leading survey based expectations or a random walk. Inflation swaps perform better than survey-based forecasts in predicting inflation at short horizons and are on-par with surveys at medium horizons. These results using European data suggest that inflation swaps can be a useful part of the inflation forecasting toolkit, consistent with the results for the U.S. We also show that adjustments for risk premiums do not lead to notable improvements in forecast performance.
Data and Methods
We compare market-based and survey-based forecasts for the euro area and the United Kingdom in terms of their accuracy in forecasting realized Consumer Price Index (CPI) inflation. We evaluate forecast performance by computing the root mean squared forecast error (RMSE) of the various forecasts compared to realized changes in the CPI at the quarterly frequency.
For market-based expectations in the euro area, we use inflation swap rates written on CPI. Swap rates are taken from Bloomberg and are adjusted for a 3-month indexation lag following the methodology in Dierks et al. (2023).2 In addition to using the swap rate itself as a forecast, we also compute forecasts that adjust for inflation risk premiums. One adjustment is calculated using the financial New Keynesian model from Mertens and Zhang (2023). Another adjustment is based on the Federal Reserve Board staff computations using a term structure model.
For survey-based expectations in the euro area, we use the Survey of Professional Forecasters (SPF), the Blue Chip survey, and the Consensus Economics survey. The SPF is published quarterly and contains forecasts for the 1-year and 5-year ahead horizons. Thus, for the euro area analysis, we compute a short-run forecast at 1 year and a medium-run forecast at 5 years. Both the Blue Chip and the Consensus Economics surveys ask market professionals for their inflation forecasts for various calendar years starting with the current. We derive 1-year ahead and 5-year ahead forecasts from the calendar year forecasts. 3
For the U.K., inflation swaps are indexed to the retail price index (RPI). Therefore, we subtract 85 basis points from the raw swap measure to account for the average RPI-CPI spread, in addition to adjusting U.K. inflation swap rates for a 2-month indexation lag.4 In addition to the raw swap rate, we compute risk premium adjustments based on Mertens and Zhang (2023) and the Federal Reserve Board (FRB) staff's term structure model. We compare the RMSEs between swap-based forecasts and forecasts from the Bank of England, the Consensus Economics survey, and the Blue Chip survey. For the U.K., we compute a 1-year forecast for the short-run horizon and a 2-year forecast for the medium-run horizon. We use a 2-year medium-term forecast for the U.K., because it maximizes the number of forecasts we can use in our medium-horizon forecast comparison.
We align our swap-based, Blue Chip, and Consensus forecast measures with the survey dates of the SPF and with the press release dates of the Bank of England forecast to align the information sets on which the various forecasts are based as much as possible. Our sample starts in the second quarter of 2014 and ends in the last quarter of 2023. This means that the last forecast for a 1-year horizon was made in the last quarter of 2022, and the last forecast for a 5-year horizon was made in the last quarter of 2018.
Results
Our main finding is that at both the short and medium horizons, forecasts based on inflation swaps are at least as informative or slightly outperform the alternatives. Figure 1 presents the RMSE for 1-year inflation forecasts for the euro area.
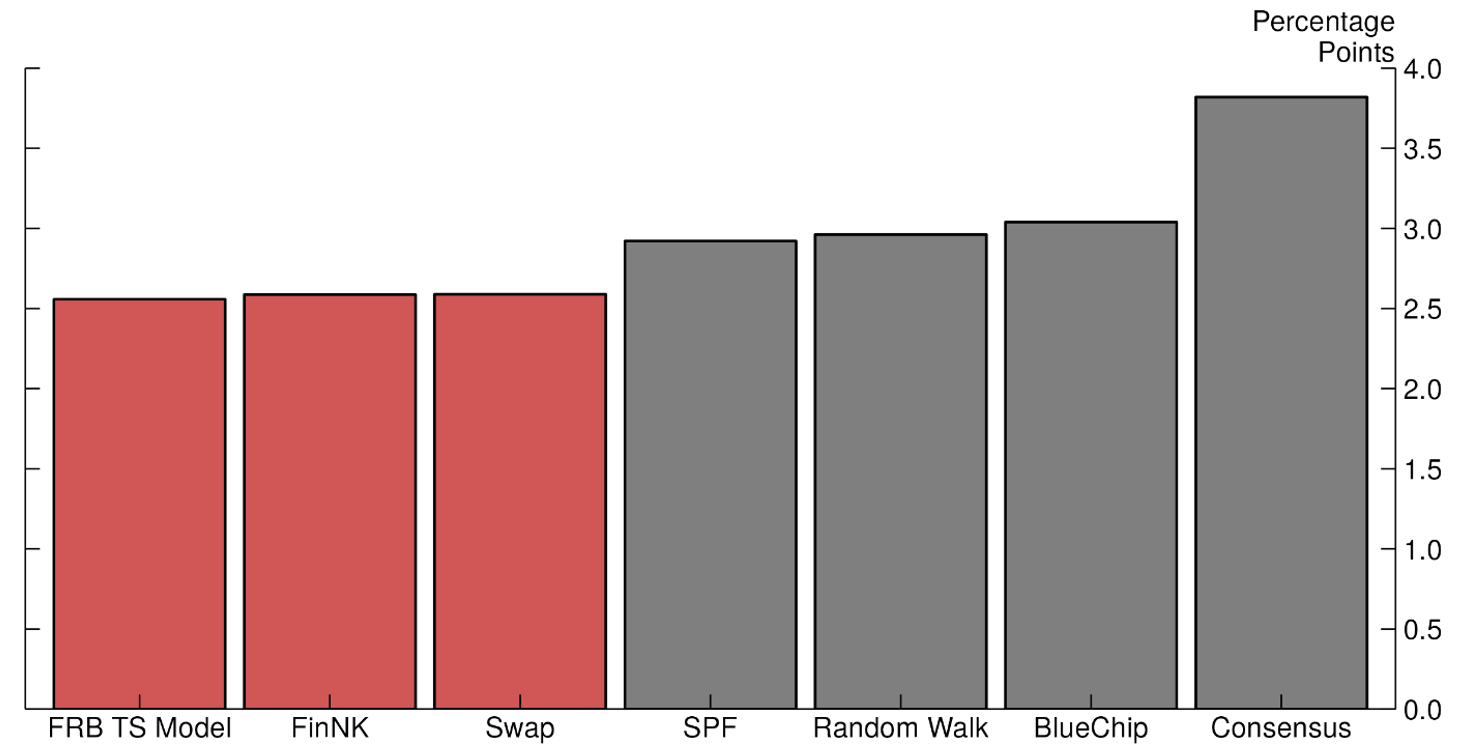
Note: This figure presents the root-mean-squared forecast error from various inflation forecasts. The "Swap" bar presents the forecast error derived from inflation swaps after adjusting for indexation lag. The "FRB TS Model" and "FinNK" bars present forecast errors after adjusting the swap-based forecast for inflation risk premiums derived from the FRB staff term structure model and from the methodology in Mertens and Zhang (2023), respectively. The "SPF" bar, "Blue Chip" bar and the "Consensus" bar present the forecast performance of inflation forecast from the Survey of Professional Forecasters, the Blue Chip survey and the Consensus Economics survey, respectively. The "Random Walk" bar presents the forecast performance of a random walk forecast that equals the last observed one-year inflation rate on each date.
Source: Bloomberg, Blue Chip Financial Forecasts, Consensus Economics, Survey of Professional Forecasters, FRB staff calculations
Forecast errors derived from inflation swap forecasts are presented in red, while those derived from all other forecasts are presented in grey. Overall, forecast errors over the past decade tend to be large and the minimum RMSE across forecasts was 2.5 percentage points. The inflation swap forecast (labelled "Swap") performed slightly better than the Blue Chip forecast, the Consensus forecast, the SPF, and the random walk. The "FRB TS Model" bar represents the RMSE of the inflation swap based forecast after subtracting off the inflation risk premium computed by the FRB staff's term structure model. This correction for inflation risk premium improved upon the inflation swap forecast, but only slightly. Similarly, adjusting for inflation risk premiums based on Mertens and Zhang (2023) only provided a marginal improvement to the inflation swap forecast.
Figure 2 presents the RMSE for 1-year inflation forecasts for the United Kingdom. Like our results for the euro area, the inflation swap forecasts performed better than leading alternatives. Adjustments for inflation risk premiums based on Mertens and Zhang (2023) only marginally improved forecast performance. Notably, the range in forecast performance is larger in the U.K. than in the euro area. This larger range in forecast performance likely reflects the fact that inflation has been more volatile in the U.K. than in the euro area.
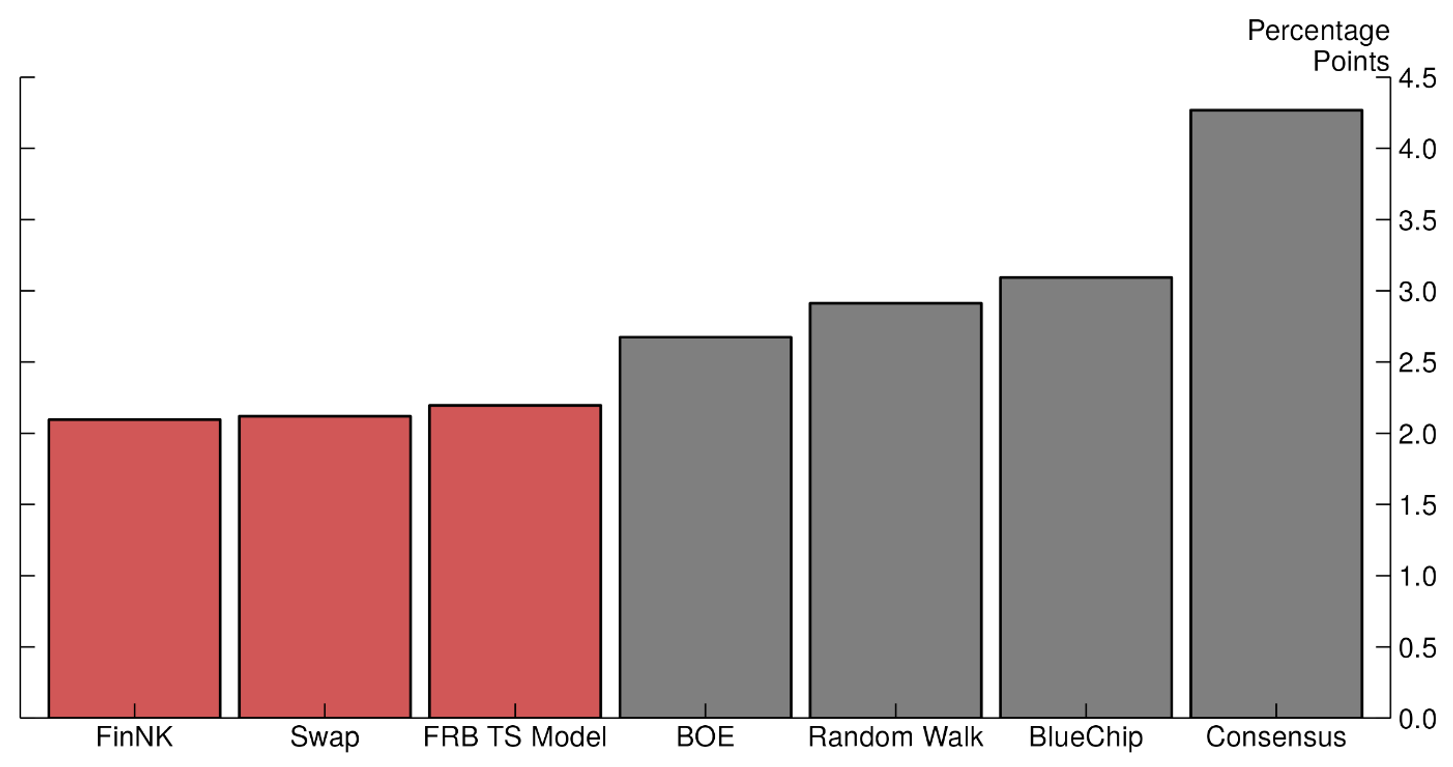
Note: This figure presents the root-mean-squared forecast error from various inflation forecasts. The "Swap" bar presents the forecast error derived from inflation swaps after adjusting for indexation lag. The "FRB TS Model" and "FinNK" bars present forecast errors after adjusting the swap-based forecast for inflation risk premiums derived from the staff term structure model and from the methodology in Mertens and Zhang (2023), respectively. The "Blue Chip" bar and the "Consensus" bar present the forecast performance of inflation forecast from the Blue Chip survey and the Consensus Economics survey, respectively. The "BOE" bar presents the forecast performance of the inflation forecast from the Bank of England based on market expectations of their policy rate. The "Random Walk" bar presents the forecast performance of a random walk forecast that equals the last observed one-year inflation rate on each date.
Source: Bloomberg, Blue Chip Financial Forecasts, Consensus Economics, Bank of England, FRB staff calculations
In order to understand when inflation forecasts deviated from realized inflation, Figure 3 presents the time series of the 1-year inflation swap forecast, the Blue Chip forecast, and the realized inflation rates for the euro area and the United Kingdom. For each date, we plot the 1-year inflation forecasts made on that date against the realized 1-year inflation starting from that date. The figure shows all forecasts were similar prior to the COVID pandemic and all forecasts missed the surge in inflation post-Covid by a substantial margin. However, the U.K. inflation swap forecast responded more quickly to the spike in inflation during the post-pandemic period, which resulted in the superior performance of the inflation swap forecast for the United Kingdom. Similarly, euro area inflation swaps outperformed other forecasts because swaps forecasted slightly higher inflation than the survey-based forecasts during the post-pandemic period of high inflation.
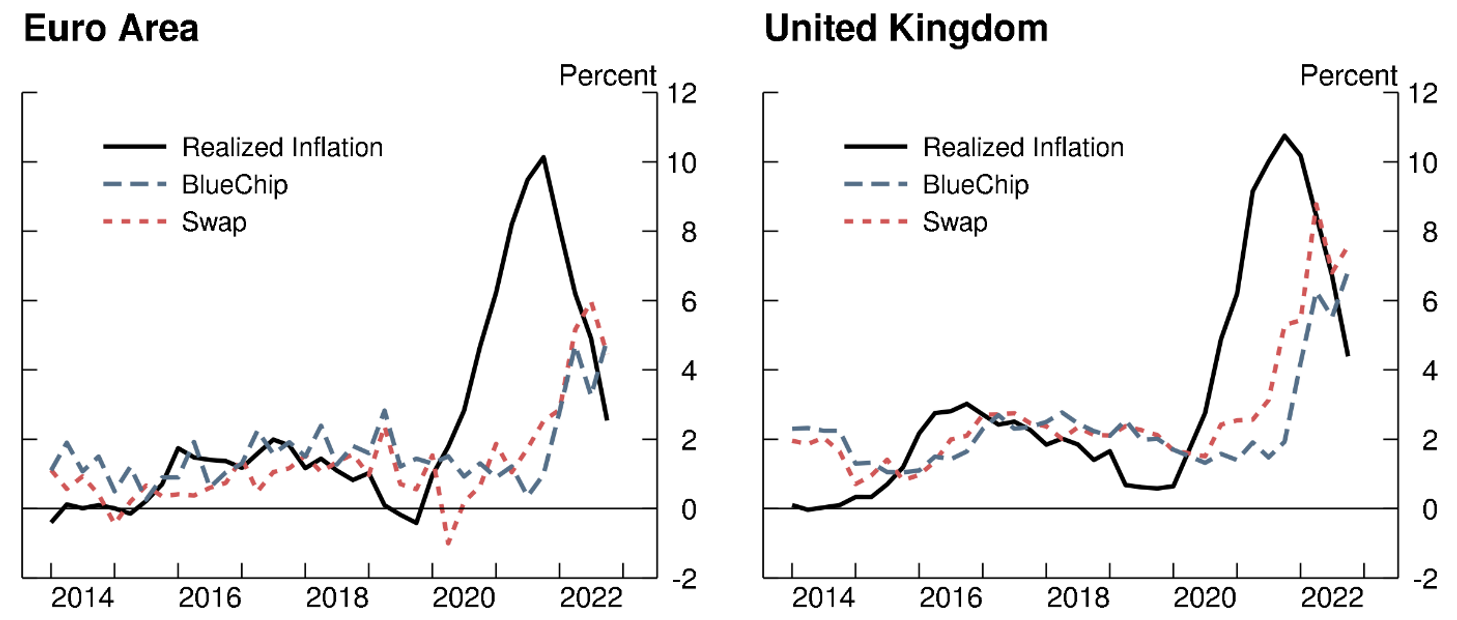
Note: These figures present the time series of the swap-based inflation forecast, the Blue Chip inflation forecast, and the realized CPI inflation. The realized inflation line is shifted by 1 year to line up with the date the forecasts were made. The inflation swap-based forecast is corrected for indexation lag and plotted with a 1-quarter lag to reflect the appropriate reference horizon. The left panel presents time series for the euro area, and the right panel presents time series for the United Kingdom.
Source: Haver Analytics, Bloomberg, Blue Chip Financial Forecasts, FRB staff calculations
At longer horizons, differences in forecast performance are much less noticeable. Figure 4 shows that, in general, the RMSE is much lower in the longer time horizon across all measures of inflation expectations—the maximum error for the 5-year euro-area estimate is almost three times less than the maximum error for the 1-year euro-area estimate. The market-based inflation forecasts are comparable to the SPF, Consensus Economics survey, and BOE forecasts. Forecasts based on risk-premium-adjusted swap rates did not yield much forecast improvement.
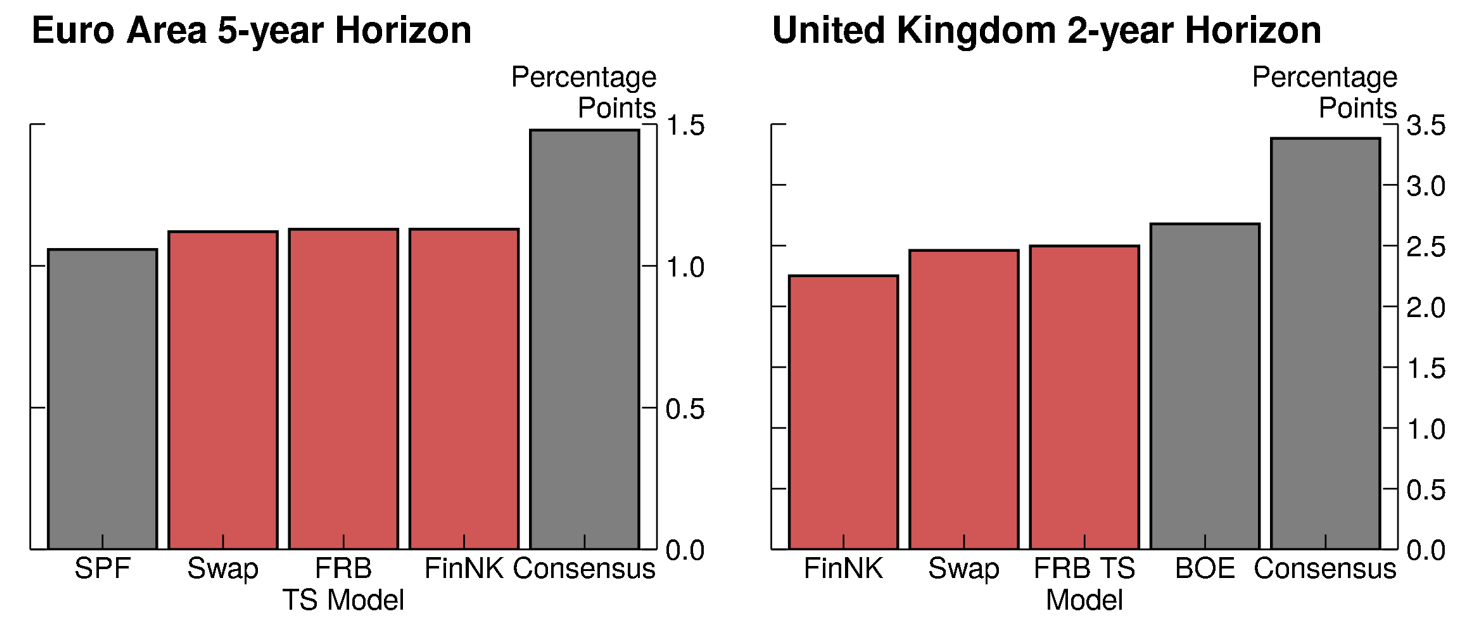
Note: This figure presents the root-mean-squared forecast error from various inflation forecasts. The "Swap" bar presents the forecast error derived from inflation swaps after adjusting for indexation lag. The "FRB TS Model" and "FinNK" bars present forecast errors after adjusting the swap-based forecast for inflation risk premiums derived from the staff term structure model and from the methodology in Mertens and Zhang (2023), respectively. The "SPF" bar and the "Consensus" bar present the forecast performance of inflation forecast from the Survey of Professional Forecasters and the Consensus Economics survey, respectively. The "BOE" bar presents the forecast performance of the inflation forecast from the Bank of England based on market expectations of their policy rate. The "Random Walk" bar presents the forecast performance of a random walk forecast that equals the last observed one-year inflation rate on each date.
Source: Bloomberg, Survey of Professional Forecasters, Consensus Economics, Bank of England, FRB staff calculations
Part of this compression in performance differences across forecasts stems from the fact that all longer horizon forecasts are affected roughly equally by the post-pandemic inflationary period. For example, the last medium-term forecast that could be evaluated for accuracy for the euro area was made in the last quarter of 2018 (i.e., 5 years before the end of our sample). These forecasts were made without knowledge of the COVID-19 pandemic. Therefore, differences in forecasters' interpretations of the effect of the pandemic on inflation are not going to affect our analysis of the medium-term forecasts. As we saw in Figure 3 above, differences in how forecasts changed in response to the COVID-19 pandemic were important for differentiating forecasts.
Conclusion
In this note, we evaluated the forecast performance of inflation swaps relative to survey-based forecasts or a random walk forecast in the euro area and the United Kingdom. We found that market-based inflation forecasts performed well when compared to these alternatives. Our results expand upon previous work in the inflation forecasting literature by incorporating a longer time series which includes the inflationary spike following the COVID-19 pandemic. This longer sample allows the various forecasts to be tested in a variety of macroeconomic conditions.
There are some caveats to our analysis. First, we do not test whether differences in forecast performance are statistically significant. While we have been able to incorporate more data than earlier analysis, our sample size remains small due to infrequent timing of survey-based inflation forecasts and this limits formal statistical analysis. Second, we evaluate forecast performance based on overlapping data, which is especially an issue for the longer-horizon forecasts.
Despite these challenges, it is evident that market-based inflation forecasts have, at a minimum, not fared any worse than survey-based inflation forecasts. Moreover, the differences in forecast performance do appear to be economically meaningful for the 1-year forecasts. For example, in Figure 1, the difference between the average gray bar and the average red bar is of a non-trivial order of about 1 percentage point. In this sense, we believe forecasters should consider the value of using both survey-based and market-based inflation forecasts when forming inflation expectations.
References
Ang, Andrew, Geert Bekaert, and Min Wei (2008). "The Term Structure of Real Rates and Expected Inflation," The Journal of Finance 63, 797-849.
Monetary Policy Committee. 2022. "Monetary Policy Report," Bank of England.
Berge, Travis J. (2017). "Understanding survey based inflation expectations," Finance and Economics Discussion Series 2017-046. Washington: Board of Governors of the Federal Reserve System.
Diercks, Anthony M., Colin Campbell, Steve Sharpe, and Daniel Soques (2023). "The Swaps Strike Back: Evaluating Expectations of One-Year Inflation," Finance and Economics Discussion Series 2023-061. Washington: Board of Governors of the Federal Reserve System.
Fleming, Michael J., John Sporn. 2013. "How Liquid is the Inflation Swap Market?," Liberty Street Economics. New York: Federal Reserve Bank of New York.
Grothe, Magdalena, Aidan Meyler. 2015 "Inflation forecasts: Are market-based and survey-based measures informative? (PDF)," European Central Bank Working Paper 1865.
Mertens, Thomas M., Tony Zhang. 2023 "A Financial New Keynesian Model," Federal Reserve Bank of San Francisco Working Paper 2023-35.
Monetary Policy Reports, 2024, obtained via Bank of England website.
Survey of Professional Forecasters, 2024, obtained via European Central Bank website.
1. Shaily Acharya ([email protected]), Nira Harikrishnan ([email protected]), and Tony Zhang ([email protected]) are with the Federal Reserve Board of Governors. Thomas M. Mertens ([email protected]) is with the Federal Reserve Bank of San Francisco. We thank Bastian von Beschwitz, Emre Yoldas, and Shaghil Ahmed for useful comments and suggestions. The views in this note are those of the authors and do not necessarily reflect those of the Board of Governors of the Federal Reserve System or its staff. Return to text
2. Indexation lag means that the horizon that the inflation swap is linked to is shifted into the past by a few months. Euro-area inflation swaps have an indexation lag of 3 months, while the U.K. inflation swaps have an indexation lag of 2 months. We correct for indexation lag by subtracting out any realized inflation relevant for the swap contract and annualizing the inflation forecast after subtracting realized inflation. When we evaluate forecast performance, we compare swap-based forecasts to the appropriate horizon that is dictated by the indexation lag following Dierks et. al (2023). Return to text
3. To change calendar-year forecasts into a 1-year ahead forecast, we subtract realized inflation from the current calendar year's forecast and take a weighted average of the result with the next calendar year's inflation forecast. Return to text
4. We prefer to work with CPI forecasts to remain consistent across geographic areas. See, for example, Bank of England (2022) for a description of the RPI-CPI spread. Return to text
Acharya, Shaily, Nira Harikrishnan, Thomas M. Mertens, and Tony Zhang (2024). "Evaluating Forecast Performance of Market-based Measures of Inflation Expectations in Europe," FEDS Notes. Washington: Board of Governors of the Federal Reserve System, July 19, 2024, https://doi.org/10.17016/2380-7172.3550.
Disclaimer: FEDS Notes are articles in which Board staff offer their own views and present analysis on a range of topics in economics and finance. These articles are shorter and less technically oriented than FEDS Working Papers and IFDP papers.