FEDS Notes
February 27, 2025
Global Remittances Cycle
Oscar Monterroso and Diego Vilán
Workers' remittances, the earnings sent home by migrant workers abroad, play a crucial role in supporting the economies of developing countries.1 Remittances enable lower-income households in developing nations to secure access to essential needs such as food, housing, education and healthcare services. For relatively wealthier households, remittances serve as an additional financial resource, which can be invested in small businesses and entrepreneurial ventures. This, in turn, promotes job creation and economic diversification, particularly in areas where employment opportunities are otherwise scarce. In short, these transfers represent a vital source of income for millions of families, contributing significantly to the well-being of households and communities, alleviating poverty and fostering economic growth.
According to the World Bank, worldwide remittances are estimated to have reached a record $818 billion in 2023,2 approximately four times the total amount of official development assistance provided by OECD countries.3 While remittances are typically recorded in a country's balance of payments, many transfers occur through informal channels, making it challenging to accurately measure the total volume of remittances flowing to developing countries.4 Nonetheless, global remittances have shown a steady increase since the late 1990s. Figure 1 illustrates the upward trend of these flows both in nominal terms and relative to global GDP.
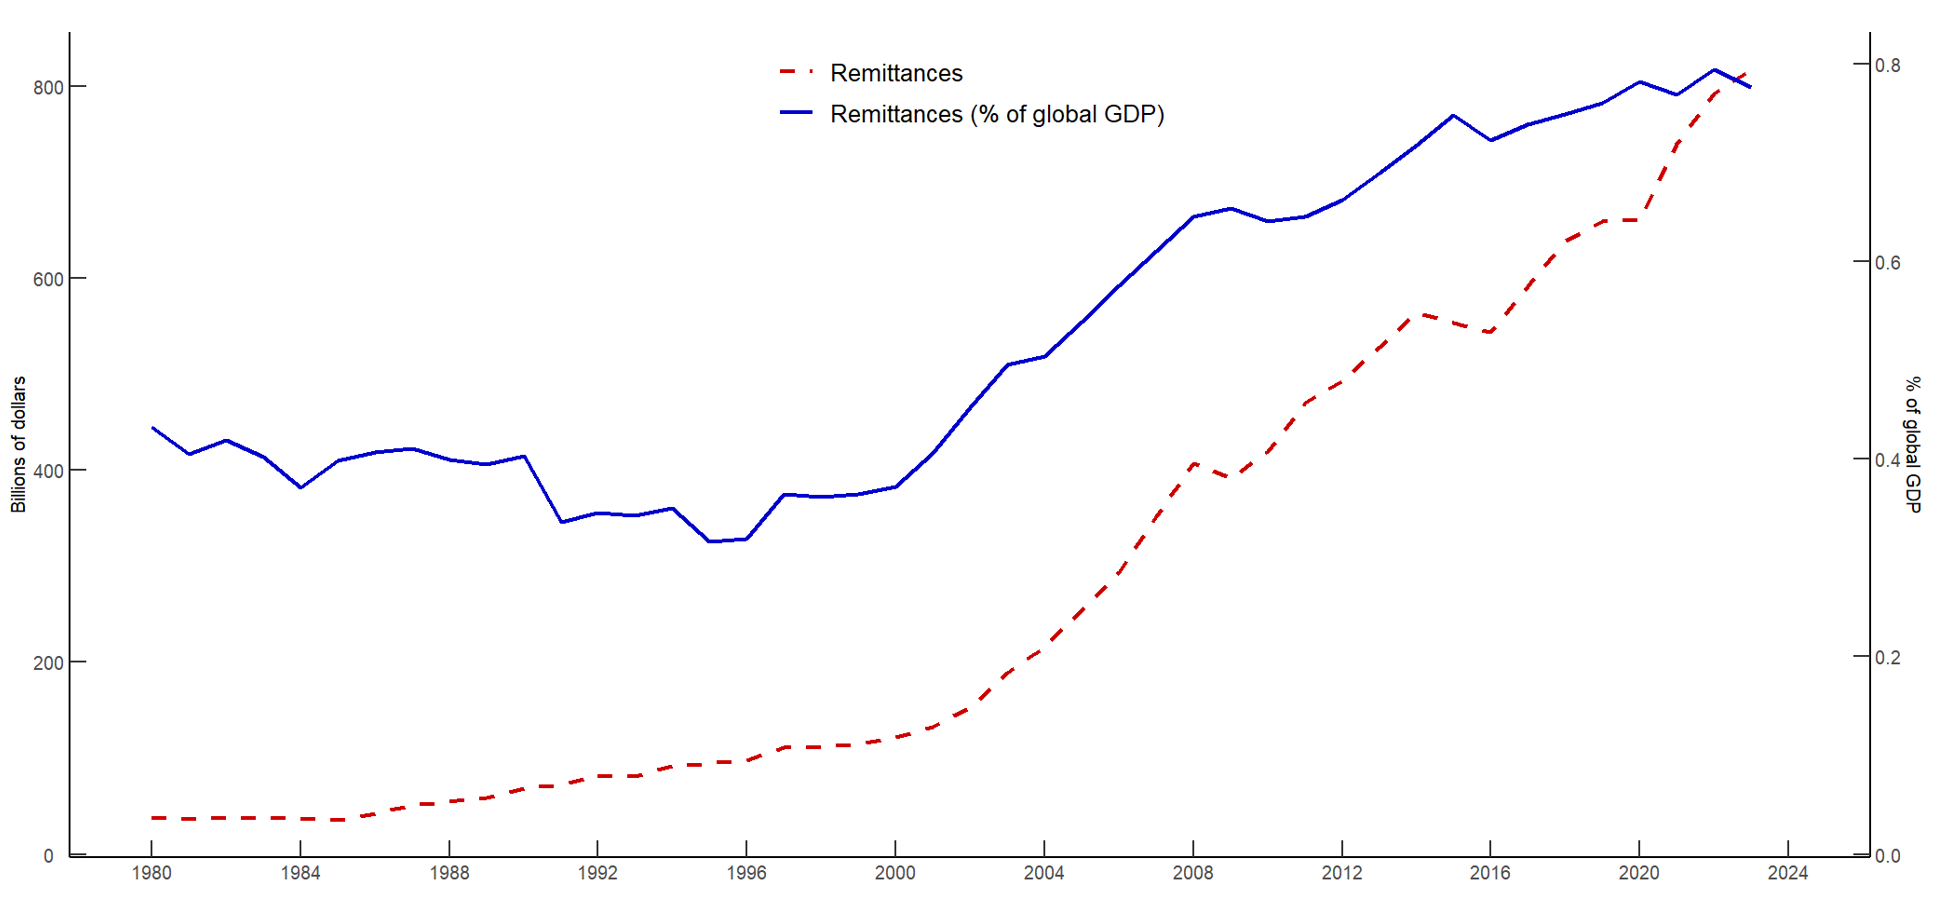
Note: Personal remittances received, current U.S.$ (red line) corresponds to the main y-axis and personal remittances received, as a percentage of global GDP (blue line) corresponds to the secondary y-axis.
Source: World Bank estimates based on IMF Balance of Payments data.
Based on the World Bank, remittances to low- and middle-income countries (LMICs) are estimated to have grown 0.7% in 2023, reaching a record $656 billion.5 Remittances continue to be a key source of external financing for LMICs, surpassing foreign direct investment (FDI) and official development assistance. Unlike capital flows such as FDI, which are often concentrated in a few large emerging economies, remittances are more evenly distributed across developing nations. In 2023, for example, just five nations accounted for approximately 40% of the total FDI flows to developing economies, a trend consistent with previous years. Furthermore, remittances constitute a significantly larger share of GDP in many developing nations, highlighting their critical role in financing the current account and promoting macroeconomic stability. In 2023, remittances accounted for over 20% of GDP in countries like El Salvador, Honduras, Nepal, and Lebanon, compared to FDI which accounted for less than 4% of GDP in these nations.6
Remittance growth is projected to remain strong in the coming years. The World Bank forecasts that remittance flows to LMICs will grow by 2.3% in 2024 and 2.8% in 2025, reaching $690 billion in 2025.7 Widening income disparities between developed and developing nations, demographic pressures driven by regional conflicts, and the impacts of shifting global weather patterns are expected to drive an increase in the number of individuals migrating in search of economic opportunities. This trend is likely to sustain the growth of remittance flows for decades to come.
Global Remittance Flows
As with many other financial flows, workers' remittances exhibit fluctuations and co-movement across time. Figure 2 illustrates the fluctuations of remittances for several countries, highlighting the tendency of these flows to move in a similar direction over time. This pattern can be attributed to several factors. First, because migrants from remittance-recipient countries often move to the same high-income destinations, the external shocks affecting recipient countries tend to be common. Second, while remittance flows are shaped by factors specific to both sending and recipient countries, global trends in economic activity, prices, and financial conditions influence all countries through interconnected channels. In this note we seek to build a statistical model that could shed some light into the potential drivers of global remittance flows.
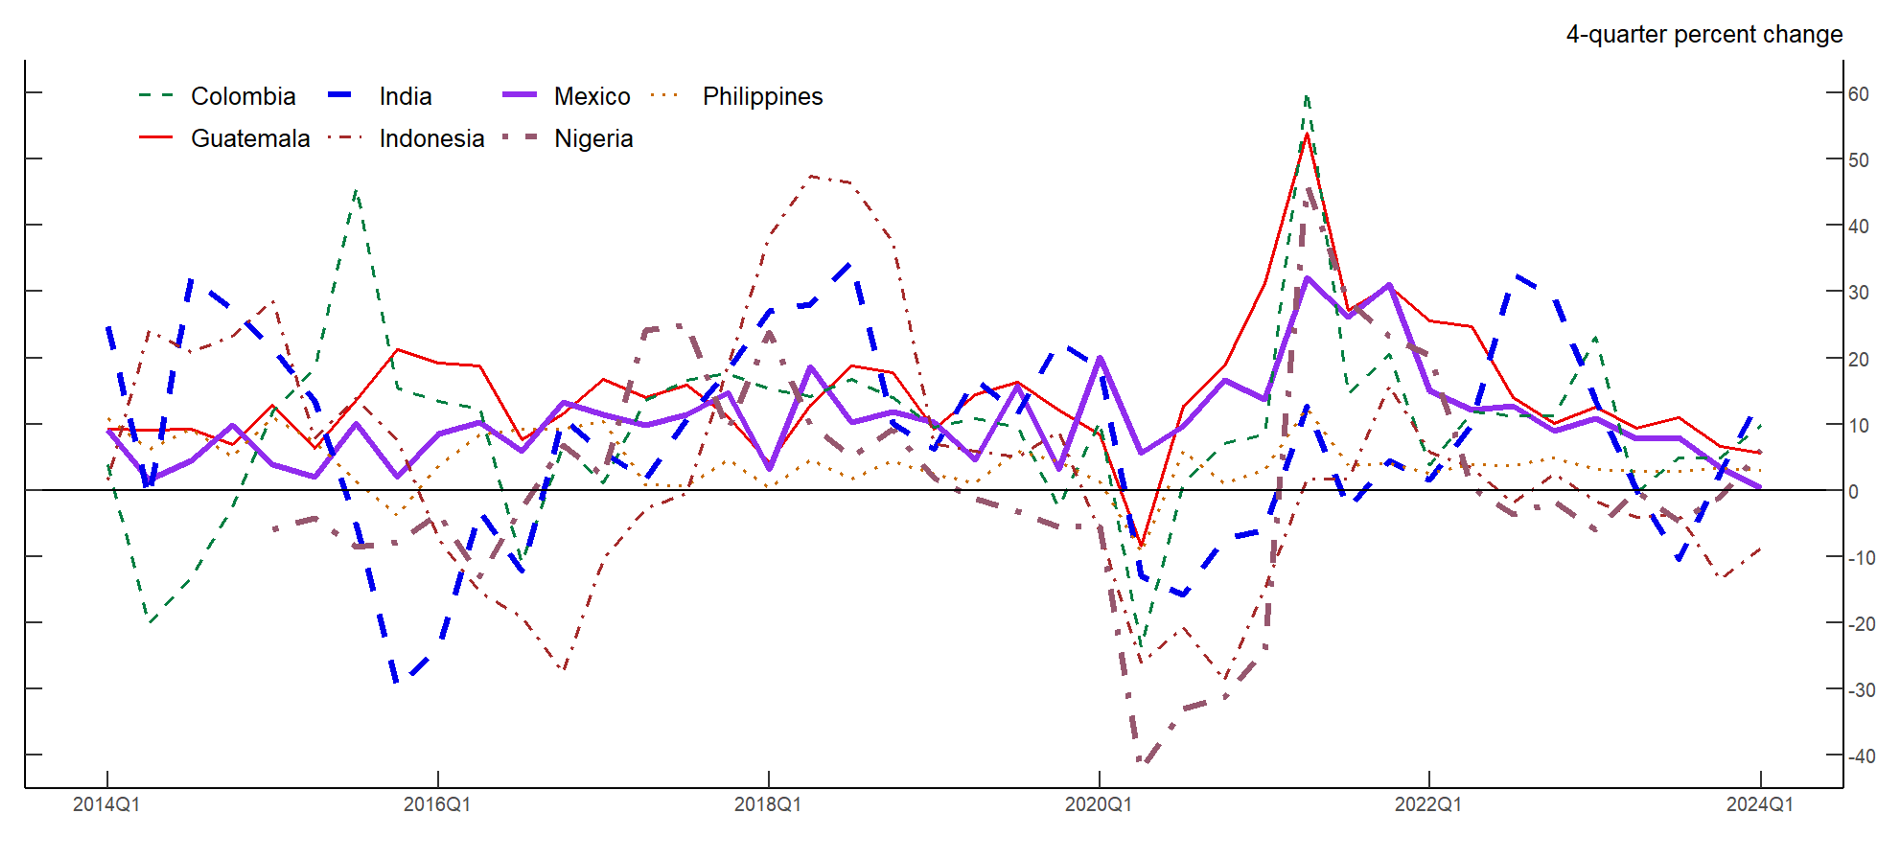
Note: Series are 4-quarter percent changes of remittances.
Source: Authors' calculations.
The proposed statistical model quantifies the degree of synchronicity in remittance flows across developing economies. Using data from the late 1990s onward, the model decomposes global remittances growth into a global component, which captures cyclical co-movements in remittance flows across countries, and country-specific components. Our main finding is that the global component of remittances accounts for almost two thirds of the variation in world remittances flows. Moreover, by introducing our global component in a structural vector autoregressive (SVAR) model, we find that worsening financial conditions played a significant role in the decline of global remittance growth during the Global Financial Crisis (GFC), and the recovery of global economic activity was key to the rebound of global remittance growth in the aftermath of the COVID-19 pandemic.
The Model
We use a dynamic factor model (DFM) to extract the common components of remittances growth across countries. Given the high variability of remittance growth rates across countries, we standardize the growth rates for each country, which results in the data being expressed in terms of standard deviations from the mean growth rate for each country.
In state-space form, the observation equation of the DFM is:
$$$$Remit_{it}=\chi_{it}+\xi_{it}$$$$
where $$Remit_{it}$$, the standardized growth rate of remittances for country $$i$$ at time $$t$$, is the sum of the common component, $$\chi_{it}$$, and the idiosyncratic component, $$\xi_{it}$$. The idiosyncratic component follows a white-noise process. The common component is defined as
$$$$\chi_{it}=\lambda_if_t$$$$
where $$f_t$$ is the common factor, invariant across countries, and $$\lambda_i$$ is the factor loading specific to each country. The evolution of the unobserved common factor follows the transition equation:
$$$$f_t=b_1f_{t-1}+b_2f_{t-2}+u_{t,\ }\text{where}\ u_t\ \sim N\left(0,Q\ \right)$$$$
Thus, the unobserved factor follows an autoregressive process of order 2 and $$u_t$$ is a white-noise process. For estimation purposes, the growth rate of remittances, $$Remit_{it}$$, is calculated as the standardized 4-quarter percent change in remittances. We use data on 20 countries, accounting for approximately 50% of all remittances received in 2023,8 and the estimation sample goes from 1998Q1 to 2024Q1. The parameters are estimated by maximum likelihood using an Expectation Maximization (EM) algorithm.
Finally, the global component of remittances growth is defined as the remittances-weighted sum of the common components for each country
$$$$\chi_t=\sum_{i}{\omega_{it}\chi_{it}}$$$$
where the weights for each economy, $$\omega_{it}$$, are shares of the level of world remittances for each period.
Estimation Results
Figure 3 presents the standardized growth of global remittances alongside our estimate of its global component. Over the sample period, the growth rate of global remittances has exhibited substantial volatility, with the global component accounting for much of this variation.9 Notably, the global component appears to play a significant role during two major episodes of fluctuation in remittance growth: the GFC and the COVID-19 pandemic, as well as their subsequent recoveries. In both instances, global remittances experienced large fluctuations, accompanied by a high degree of co-movement across economies, as evidenced by the sizeable variations in the global component. For the remainder of the sample period, global remittance growth exhibits moderate procyclicality—that is, it tends to slow during global economic downturns and strengthen during recovery periods—with the global component playing a less prominent role in these movements.
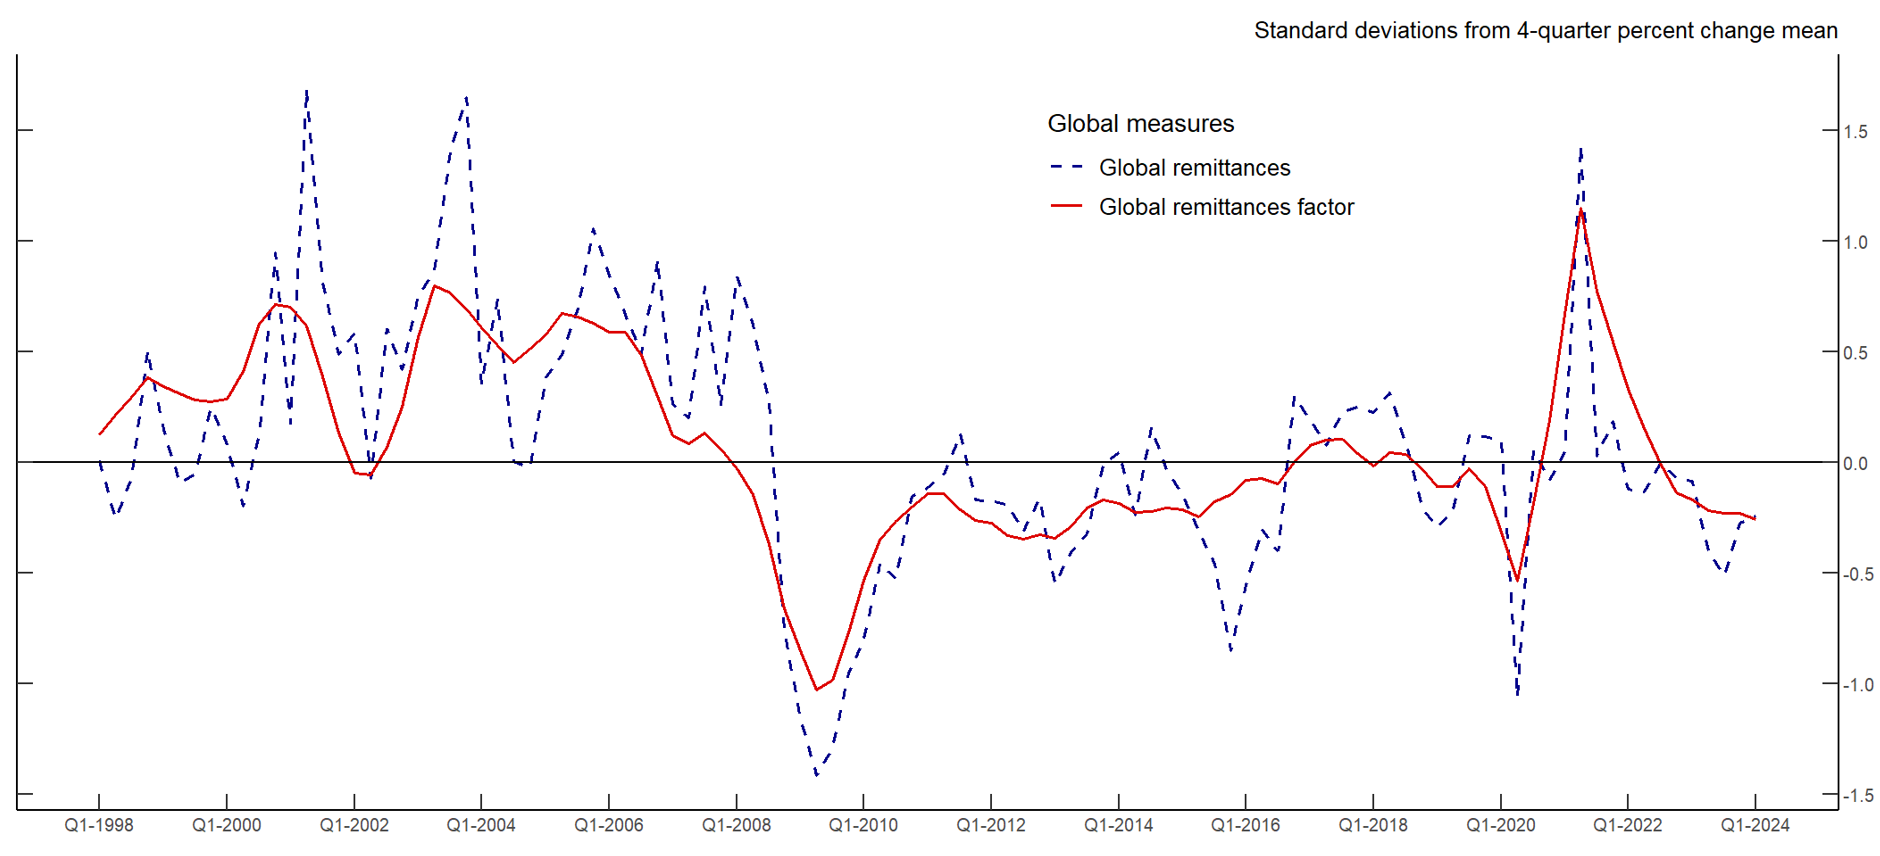
Note: Global components are remittances-weighted aggregates of each country's common component. Worldwide remittance flows are the standardized 4-quarter percent change of remittances.
Source: Authors' calculations.
The global component of remittances also exhibits some forecasting power for the near-term trajectory of remittance growth. This predictive ability is particularly evident during periods of heightened co-movement across economies. For example, during both the 2008–2009 period and much of 2020, the global component appears to anticipate the decline (and subsequent recovery) in remittance growth ahead of the observed data. This highlights the utility of the global remittances factor as a summary measure of underlying trends, making it potentially valuable for predicting changes in the direction of remittances growth worldwide.
Drivers of Global Remittances
In addition to calculating a global remittances factor, we seek to identify the economic drivers of global remittance growth. To this end, we estimate a vector autoregressive (VAR) model using data on global economic activity, global financial conditions, global commodity prices, and the global remittances factor derived from the dynamic factor model. Global economic activity is proxied by the global industrial production index from Baumeister and Hamilton (2019), global financial conditions are measured using the OFR Financial Stress Index (FSI),10 and global commodity prices are represented by the International Monetary Fund's (IMF) global price index for all commodities.
Given the availability of data, we estimate the VAR model with two lags, spanning from 2004Q1 to 2024Q1, using frequentist methods. To identify the drivers of global remittance growth, we employ a Cholesky decomposition with the following variable order: global industrial production growth, global commodity price growth, the financial stress index, and the standardized global remittances factor. Under this identification scheme, the combined innovations to the first two variables are classified as global activity shocks, innovations to the financial stress index are categorized as global financial stress shocks, and innovations to the global remittance factor are labeled as global remittance shocks. By construction, the combined shocks in the VAR capture the global drivers of remittance growth, while any discrepancies between world remittances and these global drivers can be attributed to idiosyncratic, country-specific shocks that are not included in the VAR model.
We use the structural vector autoregressive (SVAR) model to provide some insights into the drivers of world remittance growth around the GFC and the COVID-19 pandemic. Figure 4 presents the historical decomposition of standardized world remittance growth, showing the differences in the relative importance of the shocks during the last two major global economic downturns.
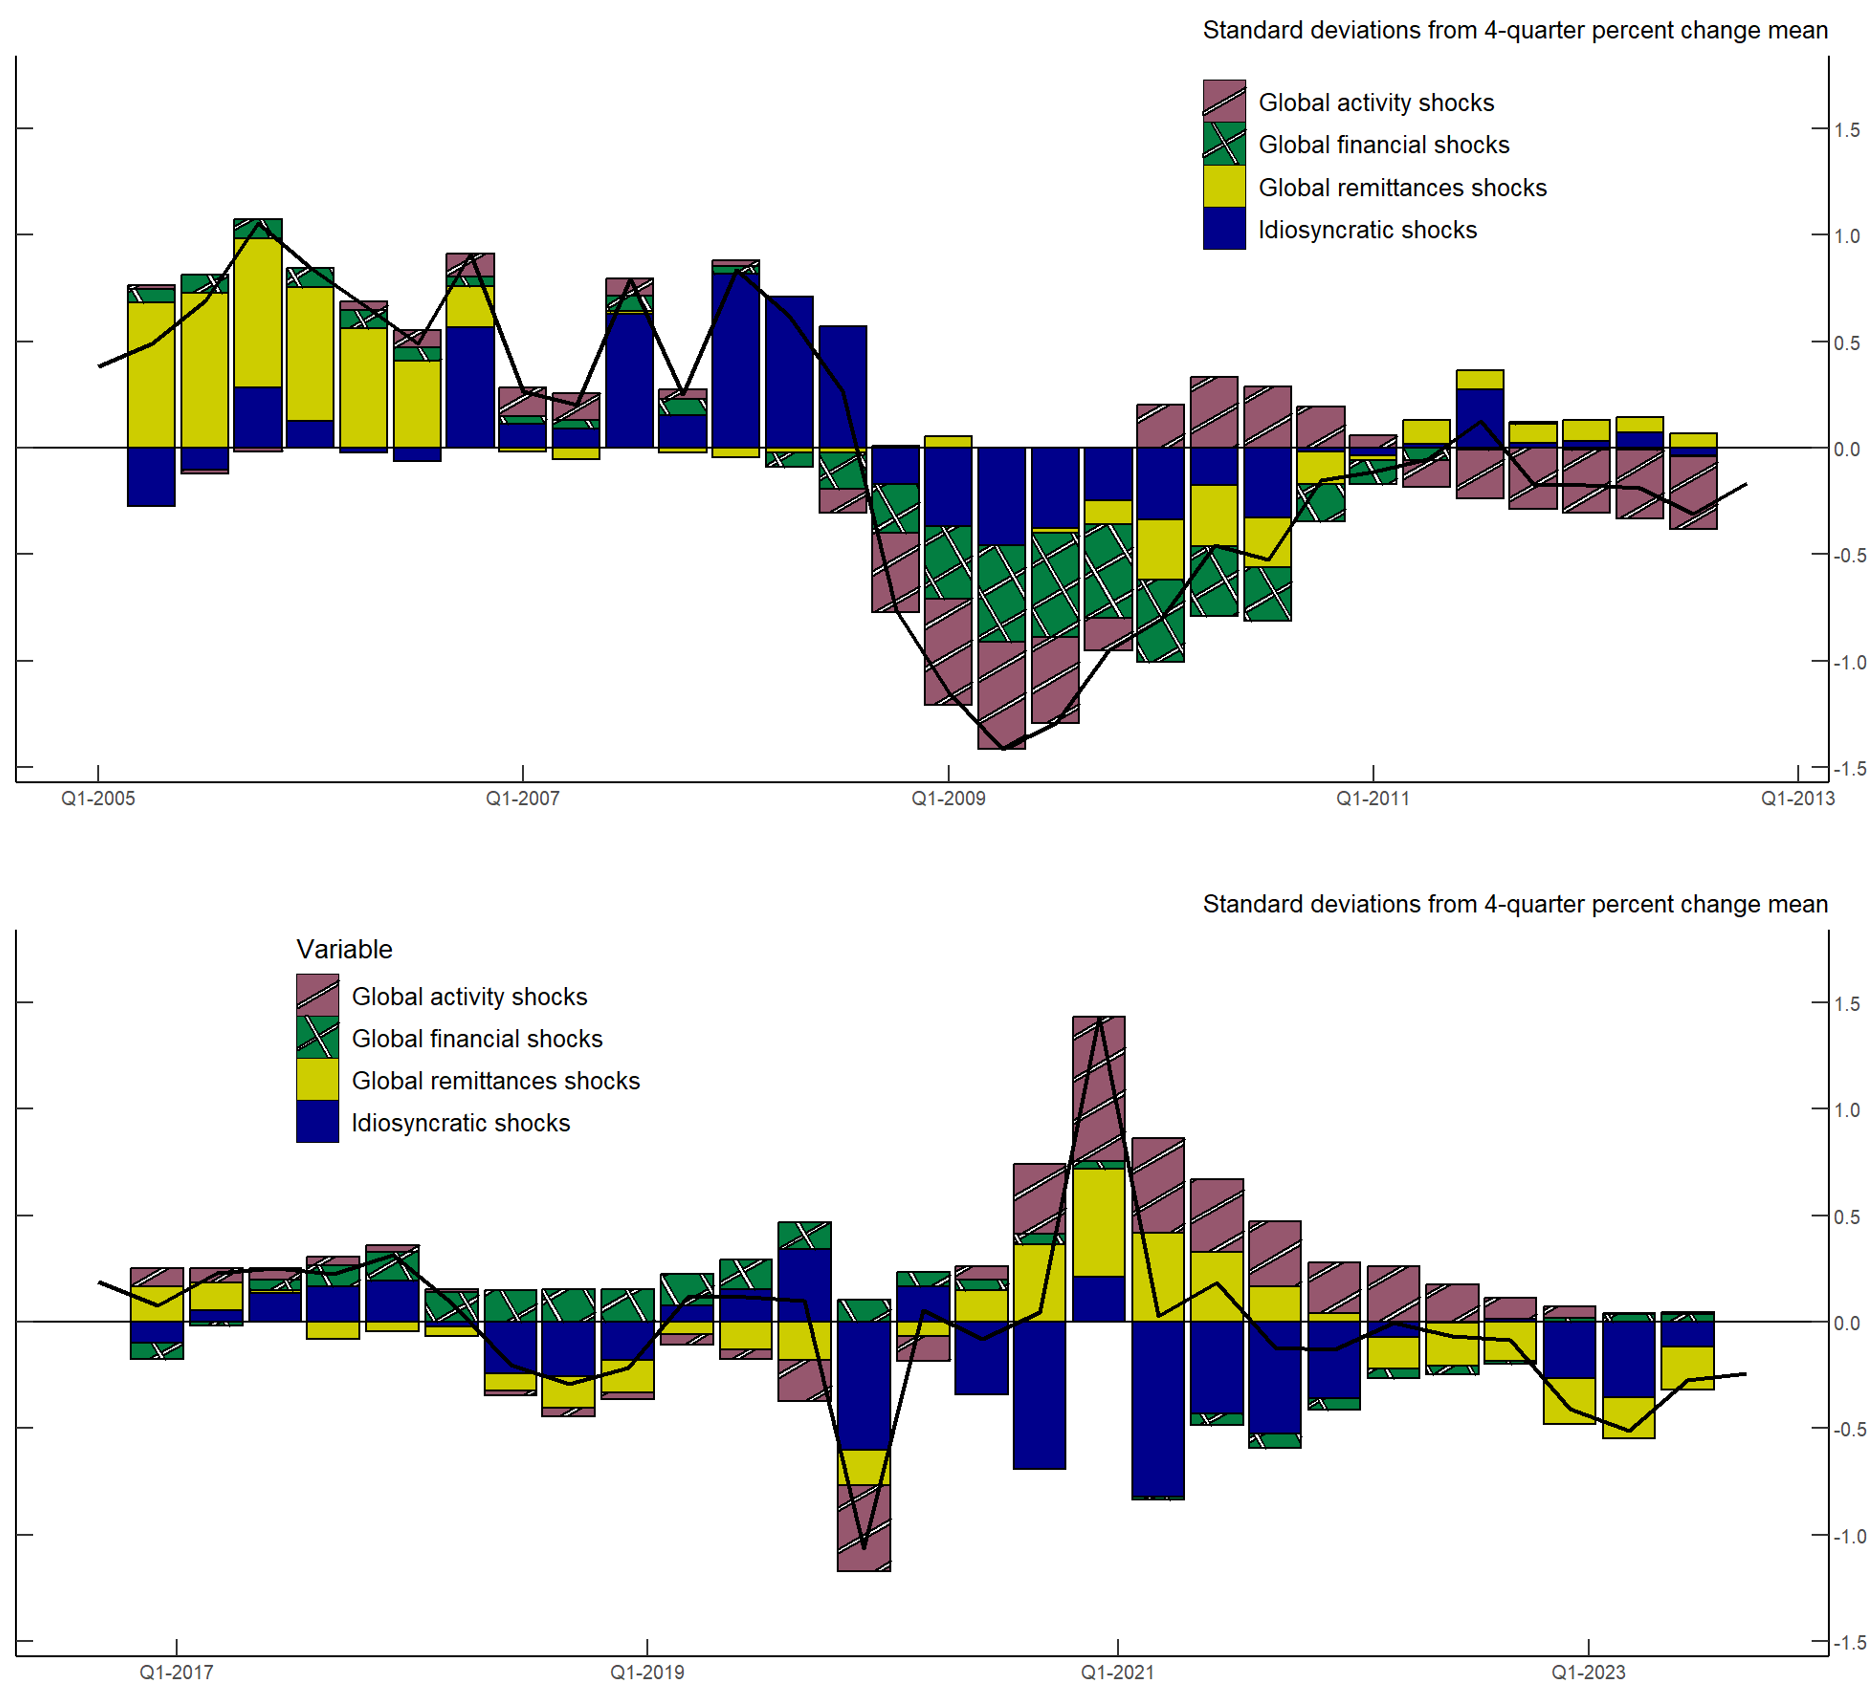
Note: Worldwide remittance flows are the standardized 4-quarter percent change of remittances.
Source: Authors' calculations.
At the start of the sample period, the rapid growth of remittances was primarily driven by its global component. Between 2007 and mid-2008, just before the height of the GFC, global remittance growth remained above average, largely due to idiosyncratic shocks. This pattern is consistent with observations from the World Bank, which attribute the phenomenon to strong remittance growth in several Asian countries,11 as well as the ongoing world-wide adoption of internet-based remittance tools, which significantly boosted the remittance industry. Starting in the second half of 2008, however, global remittance growth declined significantly. This downturn was driven by a combination of global and country-specific shocks, as economies faced severe recessions and financial conditions worsened worldwide. Positive global activity shocks played a key role in driving the recovery out from the GFC, even amid elevated financial stress. In the years immediately following the crisis, uncertainty significantly impacted economic activity, with commodity prices being particularly affected.
The relative prominence of shocks during the period surrounding the COVID-19 pandemic was somewhat different. First, the positive contribution of financial shocks to global remittance growth suggests that global financial conditions were relatively favorable throughout much of this period. Indeed, not only were financial conditions relatively accommodative in the months immediately preceding the pandemic, but the positive impact of global financial shocks at the onset of the COVID-19 pandemic can likely be attributed to central banks around the world further easing their monetary policy stance. Second, global activity shocks constituted one of the primary forces driving the fluctuations in global remittance growth during much of the 2020-2021 period. Lockdowns and supply-chain disruptions weighted heavily on economic activity during the pandemic, ultimately affecting the migrants' capacity to send remittances. As world economies began to recover and supply constraints eased somewhat, travel restrictions and social distancing measures continued to affect cross-border mobility, ultimately leading to a fall in the stock of international migrants. These restrictions prompted the temporary closure of remittance service agencies and an increase in return migration flows in some countries, a pattern that may help explain the persistent negative contribution of idiosyncratic shocks in the aftermath of the pandemic. These findings are consistent with previous evidence pointing towards some important heterogeneity among remitters that can lead to country-specific effects (see Mandelman and Vilán 2020).
Final Thoughts
For several years remittances have constituted a major source of external finance for LMICs, exceeding foreign direct investment and development assistance flows in many cases. Given the importance of these flows, understanding the drivers of remittances for policymakers in developing economies is essential. Using a simple model, fluctuations in global remittance growth rates can be attributed to a combination of global factors, financial conditions, and global activity shocks, with varying impacts depending on the broader economic context. Global economic activity has emerged as a key driver, as evidenced by its significant contribution during the GFC and the COVID-19 pandemic. Additionally, idiosyncratic factors, such as the adoption of digital technologies that facilitated remittance flows and mobility restrictions that hindered migration, have played pivotal roles. Finally, periods of heightened financial stress have been shown to slow down the growth of global remittances.
References
Baumeister, C., & Hamilton, J. D. (2019). Structural Interpretation of Vector Autoregressions with Incomplete Identification: Revisiting the Role of Oil Supply and Demand Shocks. American Economic Review.
Federal Reserve Bank of St. Louis. (2024, December). Global Price Index of All Commodities.
Office of Financial Research. (2024, December). OFR Financial Stress Index.
Ratha, D., Mohapatra, S., & Xu, Z. (2008, November 11). Migration and Development Brief 8 (PDF).
Ratha, D., Mohapatra, S., Vijayalakshmi , K. M., & Xu, Z. (2007, November 29). Migration and Development Brief 3.
The World Bank. (2020, October). Phase II: COVID-19 Crisis through a Migration Lens (PDF).
The World Bank. (2021, November). Recovery. COVID-19 Crisis through a Migration Lens (PDF).
The World Bank. (2021, May). Resilience. COVID-19 Crisis throgh a Migration Lens (PDF).
The World Bank. (2024, June). Remittances Slowed in 2023, Expected to Grow Faster in 2024 (PDF).
1. In this note, we define a migrant worker as an individual who moves from one location to another, often across national or regional borders, in pursuit of employment. Such relocation may be temporary or permanent, depending on the nature of the work and the opportunities available. Return to text
2. World Bank estimates are based on IMF Balance of Payments data. Estimates can be found on: https://data.worldbank.org/indicator/BX.TRF.PWKR.CD.DT. Return to text
3. In 2023, official development assistance by member countries of the OECD amounted to $223.7 billion. For further details refer to: https://www.developmentaid.org/api/frontend/cms/file/2024/04/ODA-summary-2023.pdf. Return to text
4. Data on remittances comes from the IMF balance of payments data via Haver analytics. The IMF's compilation of remittances is based on the Balance of Payments and International Investment Position Manual (BPM6), where remittances are mainly derived from two components: compensation of employees and personal transfers, which can be found in the primary account and the secondary income account of a country's balance of payments, respectively. Return to text
5. As reported in the Migration and Development Brief 40 by The World Bank, June 2024. Return to text
6. Authors' calculations based on the World Bank's World Development Indicators database. For further details refer to: https://databank.worldbank.org/source/world-development-indicators. Return to text
7. As estimated by the World Bank in their Migration and Development Brief 40, June 2024. Return to text
8. The countries included in our sample are: El Salvador, Guatemala, Mexico, Ecuador, Bangladesh, India, Vietnam, Lesotho, Jordan, Colombia, Egypt, Indonesia, Sri Lanka, Morocco, Nigeria, Philippines, Honduras, Thailand, Lebanon and Uganda. This is the group of countries with sufficiently high-quality data to support our model estimation. Return to text
9. Specifically, the global remittances factor accounts for approximately 60% of the variation in global remittances. Return to text
10. The OFR Financial Stress Index is a market-based measure of stress in global financial markets. Developed by the Office of Financial Research at the U.S. Department of the Treasury, it is constructed combining 33 financial market variables, including yield spreads, valuation metrics, and interest rates. Further details can be found here: https://www.financialresearch.gov/financial-stress-index/. Return to text
11. For example, countries such as Indonesia, Lebanon, and Nigeria, among others, reported significant upward revisions to their recorded remittances during this period. Return to text
Monterroso, Oscar, and Diego Vilán (2025). "Global Remittances Cycle," FEDS Notes. Washington: Board of Governors of the Federal Reserve System, February 27, 2025, https://doi.org/10.17016/2380-7172.3715.
Disclaimer: FEDS Notes are articles in which Board staff offer their own views and present analysis on a range of topics in economics and finance. These articles are shorter and less technically oriented than FEDS Working Papers and IFDP papers.