FEDS Notes
February 28, 2025
How Do Trade Disruptions Affect Inflation?
Pablo Cuba-Borda, Albert Queralto, Ricardo Reyes-Heroles, and Mikäel Scaramucci
After decades of increasing global economic integration, trade as a share of world GDP peaked before the Global Financial Crisis and has since plateaued (figure 1, blue line). Since the late 2010s, tariffs and restrictions on U.S.–China trade, supply chain bottlenecks associated with the COVID-19 pandemic, and Russia's invasion of Ukraine have all raised the cost of and added barriers to trade. These disruptions to trade highlight the inflationary risks associated with a reversal of global economic integration.
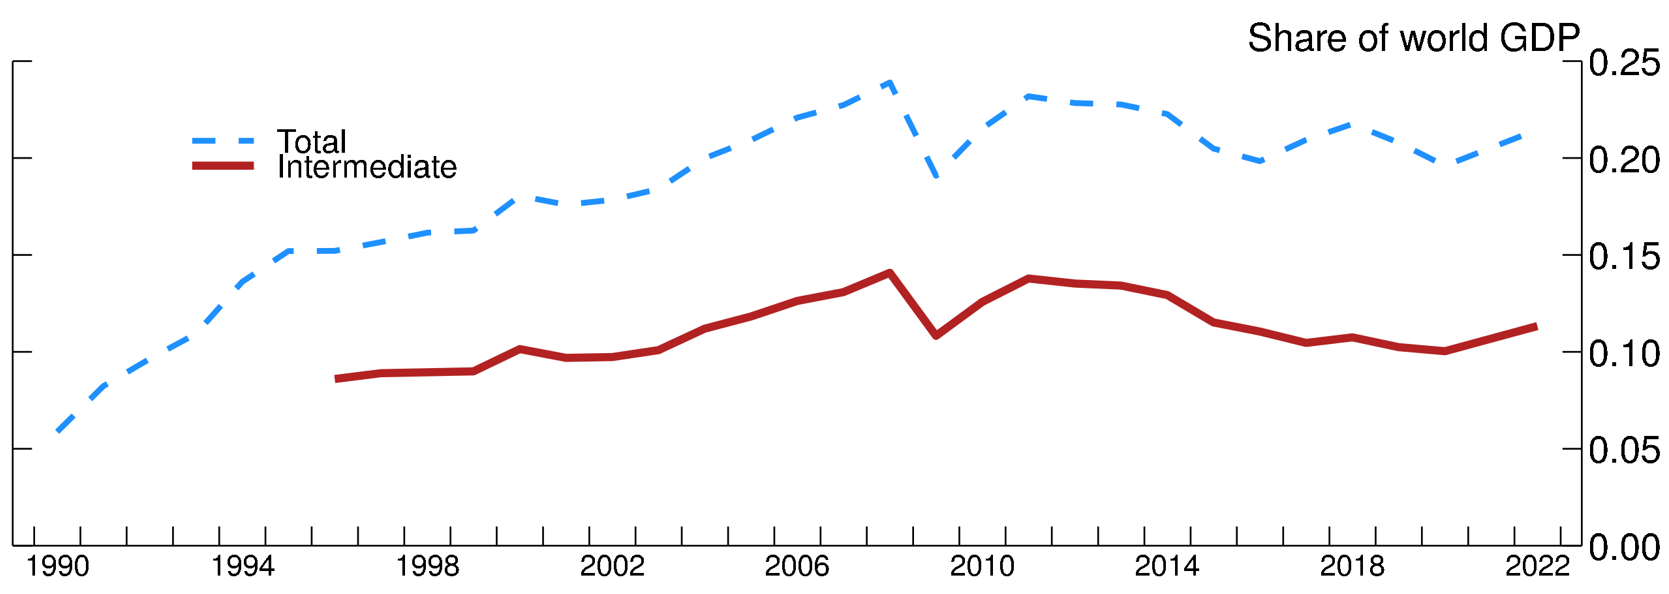
Note: Total trade is from 1990 to 2022, and trade in intermediates is from 1996 to 2022.
Source: Ricardo Reyes-Heroles, Sharon Traiberman, and Eva Van Leemput (2020), “Emerging Markets and the New Geography of Trade: The Effects of Rising Trade Barriers,” IMF Economic Review, vol. 68 (July), pp. 456-508, extended for 1990 to 1995 by World Integrated Trade Solution and World Development Indicators and for 2017 to 2022 by UN Comtrade and the International Monetary Fund’s World Economic Outlook. Data for trade in intermediates at Broad Economic Categories classification provided by UN Comtrade starting in 1996. Data for 2021 are linearly interpolated because of limited reporting.
We assess these risks using two approaches. Empirically, we estimate the historical cost of trade disruptions using a sizable cross-country, disaggregated trade data set.1 The results suggest a notable effect of rising import costs on inflation. The effect is particularly persistent when disruptions affect trade in intermediate goods, which account for more than half of global trade (figure 1, red line). We also use a general equilibrium model that incorporates trade disruptions in intermediate and final goods to quantify the effects of a significant increase in trade barriers between the U.S. and China. We find that a shift in trade costs somewhat more severe than the one observed during tariff hikes in the late 2010s leads to persistently higher inflation, importantly because disruptions affecting intermediate inputs reduce firms' production efficiency.
The Inflationary Effects of Trade Disruptions: International Evidence
To quantify the effects of trade disruptions on inflation, we construct a measure of bilateral trade costs for a panel of 41 countries using annual data from 1995 through 2020. We then estimate an empirical model linking changes in trade costs to inflation.
Our approach to constructing trade costs is guided by a workhorse model of international trade known as the "gravity" equation. The gravity equation relates trade flows between two countries to observable characteristics, such as economic size or productivity, and to an unobserved residual capturing trade costs between the two countries. Given data on bilateral trade flows and observable country characteristics, the gravity equation defines trade costs as the value of trade flows not explicable by these characteristics. For example, in a simplified version of the gravity equation, $${trade}_{ie}=M_iM_e/\tau_{ie}$$, where $$ {trade}_{ie} $$ is the value of imports by importer $$i$$ from exporter $$e;$$ $$M_i$$ and $$M_e$$ and are importer and exporter economic size, respectively; and $$\tau_{ie}$$ are costs impeding trade from country $$e$$ to country $$i$$. Given data on trade flows and on aggregate expenditures (proxying for economic size), one can recover bilateral trade costs as $$ \tau_{ie}=M_iM_e/{trade}_{ie} $$. Our methodology builds on this insight and accounts for other factors, such as differences in relative prices across countries in a more general version of the gravity equation.2
The resulting measure of trade costs effectively encompasses both policy-related barriers, such as tariffs and quotas, and non-policy-related trade barriers, such as geographic distance, shipping disruptions, and changes in transportation costs. We construct this trade cost measure for intermediate and final goods separately. For each type of good, we aggregate bilateral trade costs across source countries—weighting by import shares—to obtain a country-level measure of total trade costs for each country in our sample, measured as percent of sales prices.
According to our calculations, median bilateral trade costs across countries fell approximately 80 percentage points from 1995 to 2008 and stabilized thereafter (left panel of figure 2). Trade costs between the U.S. and China followed similar paths until the onset of recent trade tensions (right panel of figure 2). During the 2018–19 period, U.S.–China trade costs increased 20 percentage points and 11 percentage points for intermediate and final goods, respectively. Our estimated changes in trade costs are in line with the 16 percentage point increase in the weighted average tariff imposed by the U.S. on China and evidence showing that these increases were tilted toward intermediate goods.3
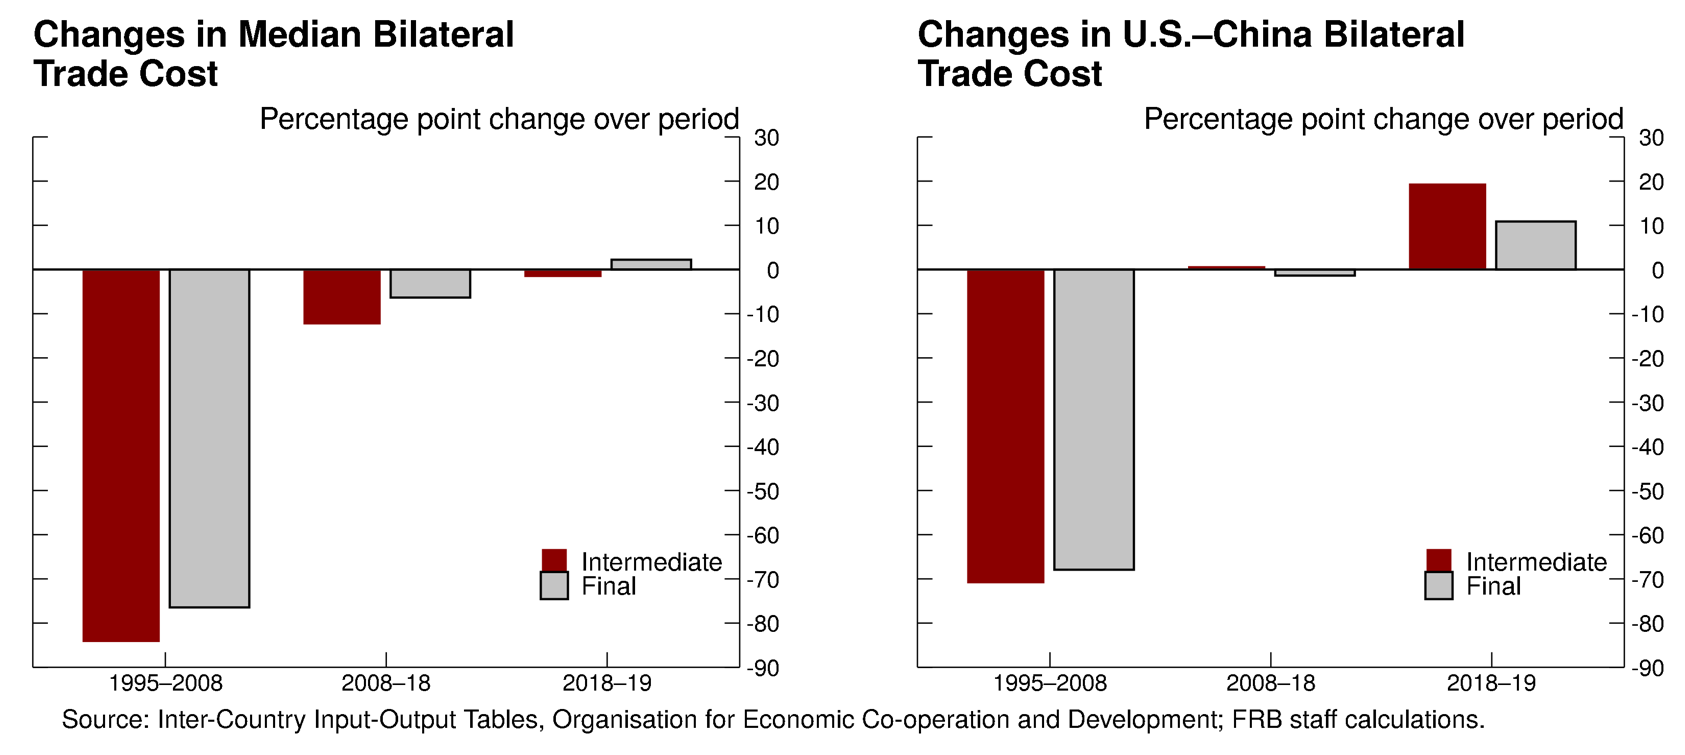
Source: Inter-Country Input-Output Tables, Organization for Economic Co-operation and Development; FRB staff calculations.
To gauge the effects of changes in trade costs on inflation, we estimate a dynamic panel regression model linking consumer price index (CPI) inflation in each country to trade costs, controlling for country-specific characteristics—such as the unemployment rate—and global shocks to inflation.
We find that an increase in trade costs leads to a statistically significant rise of CPI inflation (figure 3). According to our median estimates (the solid black lines), a shock that increases a country's trade costs of intermediate goods from all its trading partners by 10 percentage points leads to a 0.3 percentage point increase in CPI inflation within the first year (left panel). An equally sized shock in trade costs in final goods leads to a 0.5 percentage point increase in CPI inflation (right panel). The persistence of the effects differs depending on the shock. Higher costs of final goods trade—say, due to tariffs imposed on goods like washing machines—lead to a larger but more short-lived effect on CPI inflation. Higher costs of intermediate goods trade—say, as a result of a shortage in semiconductors or of tariffs imposed on imported Chinese battery cells or boat motors—have somewhat more persistent effects on CPI inflation by adversely affecting firms' productivity, as illustrated in the next section.4 Thus, taken together, a combination of an increase in trade costs for intermediate and final goods leads to a 0.8 percentage point increase in inflation that takes several years to peter out.
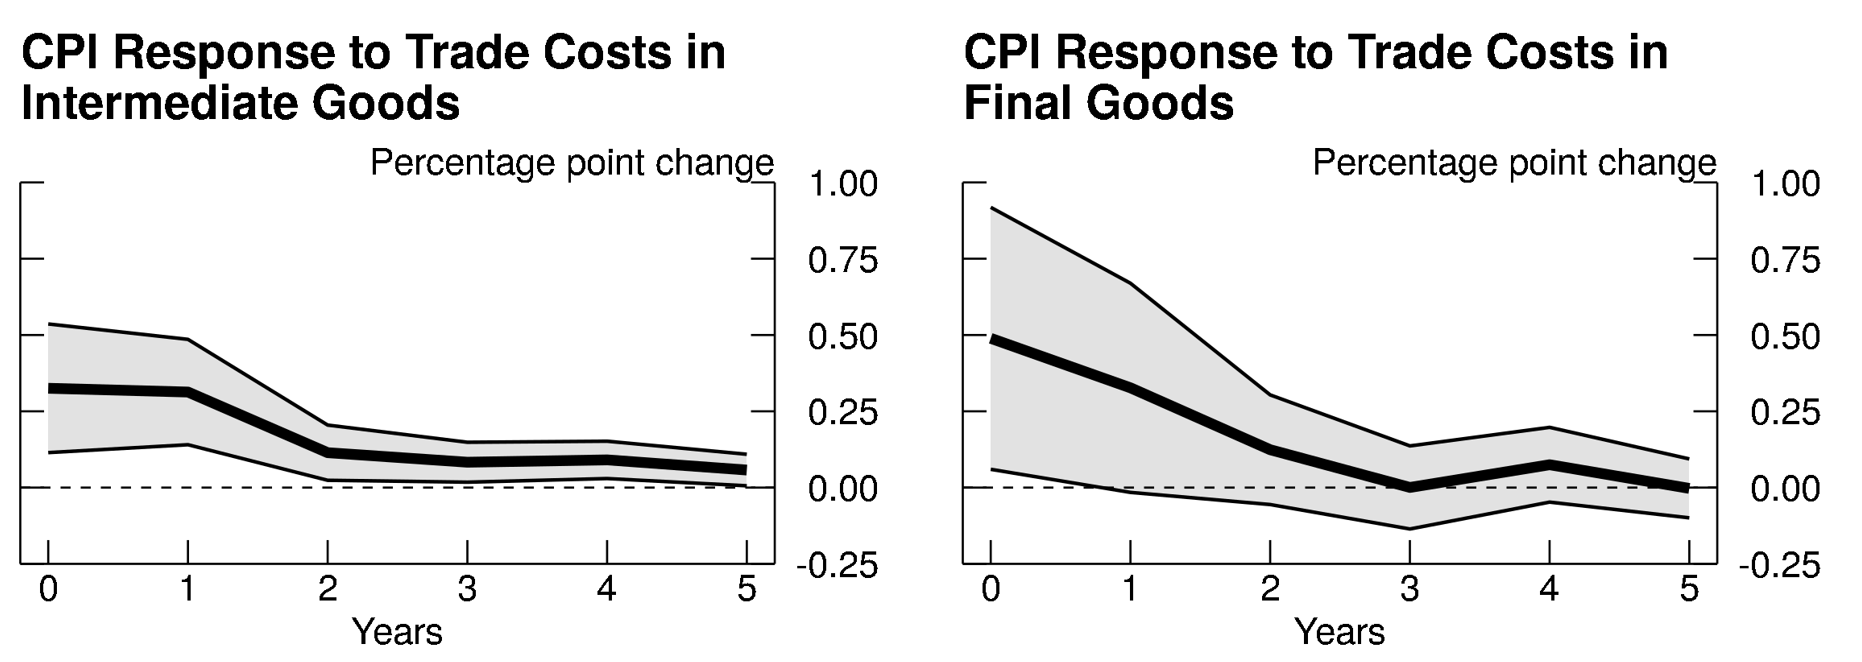
Note: The figure shows the consumer price index (CPI) response to a 10 percentage point increase in trade costs. Solid lines show the average response across countries. Shaded areas show the 70 percent confidence intervals.
Source: Inter-Country Input-Output Tables, Organization for Economic Co-operation and Development; World Development Indicators, World Bank; FRB staff calculations.
Effects of U.S.–China Trade Tensions
We next embed the empirical estimates on the effects of trade costs on inflation in a general equilibrium multiregional model that includes trade in both final consumption goods and intermediate inputs. The model includes the U.S., China, advanced non-U.S. economies, Asian emerging market economies (EMEs) excluding China, and other EMEs. Households and firms in each of the five regions buy goods produced both in their own region and in the other regions, with goods from different regions being imperfect substitutes.5 We use the model to illustrate the consequences of shocks that disrupt trade between the U.S. and China, sized so they are roughly equivalent to the trade disruptions of 2018-19—thus providing an estimate of the economic effects of that episode.
Specifically, we envision a scenario in which trade costs between the U.S. and China increase for final and intermediate goods. We assume that U.S. trade costs for all Chinese imports increase 20 percentage points—capturing the imposition of U.S. tariffs on Chinese imports, to which China partially retaliates by raising tariffs on U.S. goods 10 percentage points. The scenario is somewhat more severe than the 2018–19 increase in trade tensions between the U.S. and China, when the U.S. imposed a tariff rate of a similar magnitude on a narrower set of imported goods. The increase in trade costs occurs in quarter 1 (figure 4) is expected to be highly persistent, in line with the persistence in our trade costs measure.6
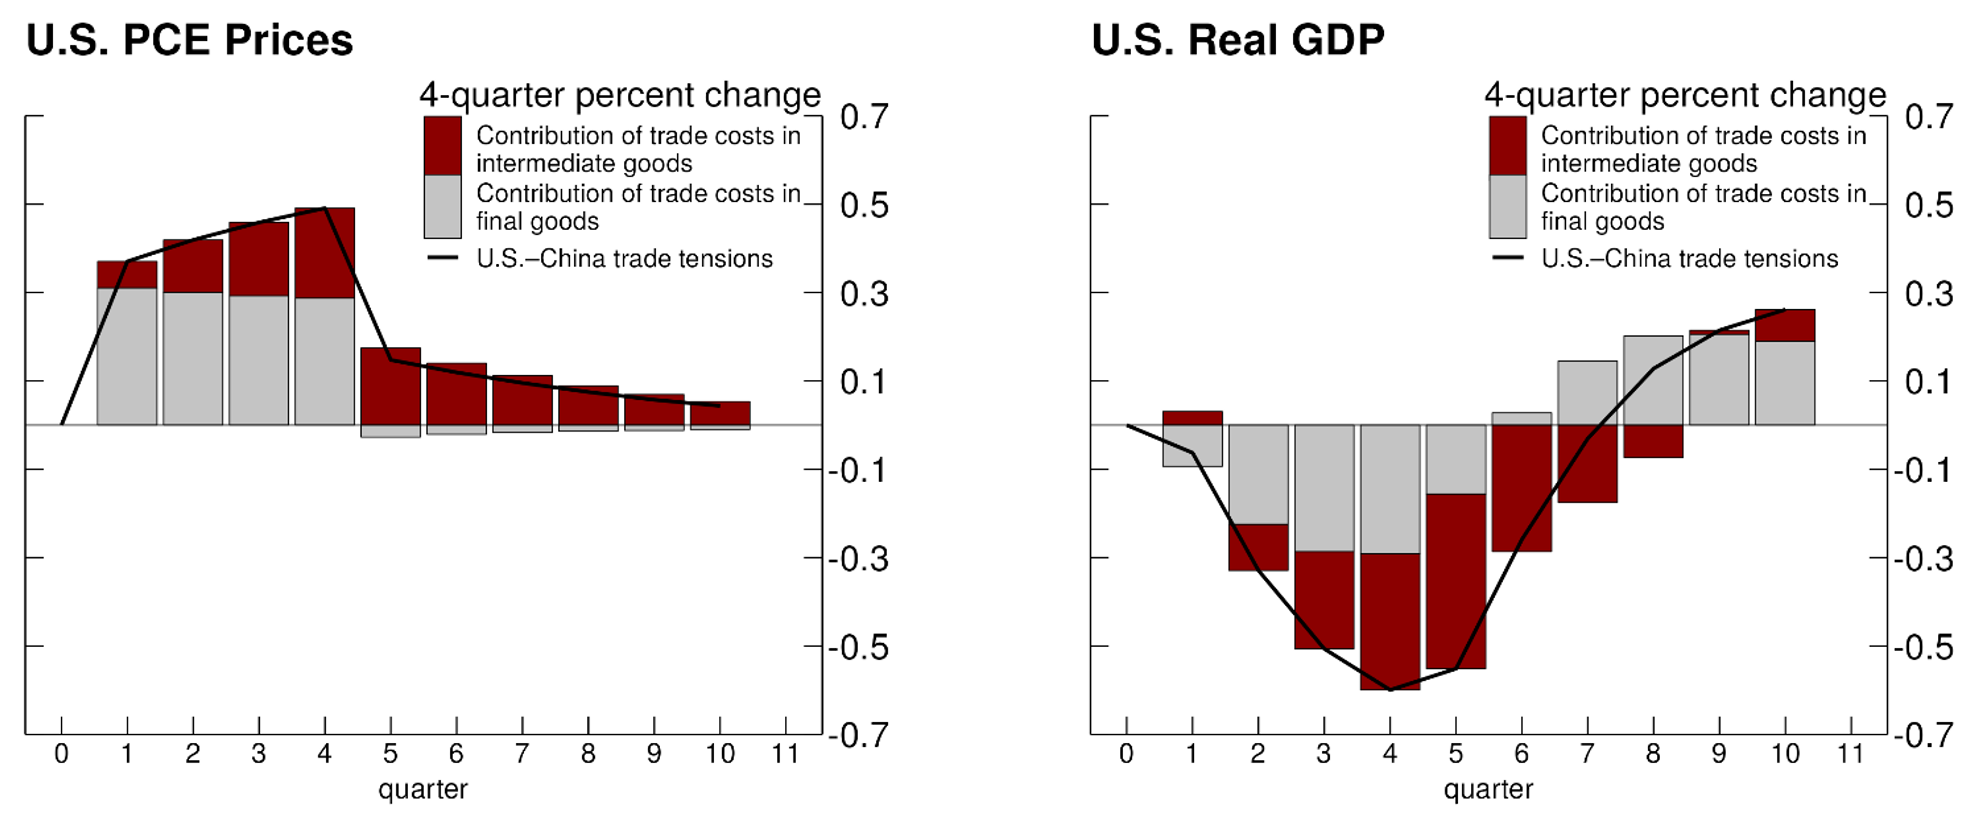
Note: Results are shown as deviations from a baseline in which trade costs do not increase. PCE is personal consumption expenditures.
Source: FRB staff calculations.
In the scenario, U.S. inflation rises and U.S. GDP growth slows (figure 4). The effect on inflation is significant: The increase in trade costs drives U.S. inflation up by 0.5 percentage point and causes it to remain persistently elevated. The contribution of trade costs in final goods (the gray bars) is short lived and vanishes by the fifth quarter. Thus, a hike in trade costs on final goods leads largely to a one-time step-up in the price level, without a persistent increase in the rate of inflation itself.7 By contrast, the contribution of higher trade costs in intermediates (the red bars) induces a persistently elevated inflation rate relative to the baseline. As the costs of importing inputs from China rise, U.S. firms react by making greater use of inputs sourced from other regions, including the U.S. itself. These other inputs, however, are not perfect substitutes for inputs imported from China, leading to lower production efficiency for U.S. firms. As a consequence, U.S. production costs increase persistently, translating into higher inflation for longer. The associated higher policy rates contribute to a persistent drag on GDP growth relative to the baseline (right panel).8
The effects on China (not shown) are qualitatively similar to those on the U.S., with a somewhat larger hit to GDP growth relative to the baseline, reflecting that China's retaliation is only partial. Real GDP growth in the non-China foreign regions experiences a modest bump, as U.S. and Chinese firms and households partly divert trade flows toward imports from these countries.
To conclude, our analysis finds that disruptions affecting trade in intermediate goods—a key component of global trade flows—are likely to have particularly persistent effects on inflation, as these disruptions lead to a decline in production efficiency and a sustained increase in marginal costs. Our discussion highlights that trade disruptions may affect consumer prices not only through the direct effect of increases in import prices, but also indirectly as a result of induced increases in the prices of domestically produced goods triggered by higher input costs.
References
Cuba-Borda, Pablo, Albert Queralto, Ricardo Reyes-Heroles, and Mikäel Scaramucci (2024). "Trade Costs and Inflation Dynamics," working paper (July).
Bown, Chad P. (2021). "The US–China Trade War and Phase One Agreement," Journal of Policy Modeling, vol. 43 (July–August), pp. 805–43.
Irwin, Neil, Alexandra Stevenson, and Claire Valentine (2018), "What a Trade War with China Looks Like on the Front Lines," The Upshot, New York Times, June 23.
Flaaen, Aaron, and Justin Pierce (2019). "Disentangling the Effects of the 2018-2019 Tariffs on a Globally Connected U.S. Manufacturing Sector," Finance and Economics Discussion Series 2019-086. Washington: Board of Governors of the Federal Reserve System.
1. This analysis is based on Cuba-Borda, Queralto, Reyes-Heroles, and Scaramucci (2024). Return to text
2. One caveat of our approach is that bilateral trade costs implied by the gravity equation might also capture changes in relative demand for goods produced in different countries. Our methodology implicitly interprets such changes in demand as fundamentally driven by changes in trade barriers. Return to text
3. See Bown (2021). Return to text
4. In 2018, tariffs on Chinese-imported motors for boats led U.S. boat makers to scramble to find alternative suppliers and led to difficulties to adapt production lines to motors with different specifications. See Irwin, Stevenson, and Valentine (2018). Return to text
5. See Cuba-Borda et al. (2024) for a full description of the model. Return to text
6. To isolate the role of trade tensions, we assume the only shocks in the scenario are to trade costs. If other adverse shocks—such as to global confidence—were also to materialize, the effects could be amplified. Return to text
7. Note that figure 4 shows four-quarter inflation rates. Therefore, a one-time rise in the price level occurring in the initial quarter shows through as an increase in four-quarter inflation for four quarters. Return to text
8. The role of intermediate inputs highlighted in our model is consistent with firm-level evidence in Flaaen and Pierce (2019) showing that the U.S.-China trade tensions had significant effects on U.S. manufacturing prices and employment via higher intermediate input costs. Return to text
Cuba-Borda, Pablo, Albert Queralto, Ricardo Reyes-Heroles, and Mikäel Scaramucci (2025). "How Do Trade Disruptions Affect Inflation?," FEDS Notes. Washington: Board of Governors of the Federal Reserve System, February 28, 2025, https://doi.org/10.17016/2380-7172.3664.
Disclaimer: FEDS Notes are articles in which Board staff offer their own views and present analysis on a range of topics in economics and finance. These articles are shorter and less technically oriented than FEDS Working Papers and IFDP papers.