FEDS Notes
April 10, 2025
How is Geopolitical Fragmentation Reshaping U.S. Foreign Direct Investment?
With the rise of geopolitical tensions, public commentary and new research have raised concerns about the reallocation of economic activities along geopolitical lines. Early evidence suggests that trade patterns, supply chains, and investment are shifting away from China and toward alternative countries. These shifts could have many motives: avoiding conflict and trade restrictions; changing business and regulatory environments; and mitigating supply chain and sea transportation risks. Research on these new developments so far mostly tests for and quantifies the extent and potential costs of trade reallocation.1
More recently, the fragmentation narrative has extended to foreign direct investment (FDI). CEOs of multinational firms have discussed shifting production away from geopolitically risky countries ("de-risking"), toward geographically proximate countries ("nearshoring"), or toward more geopolitically aligned countries ("friendshoring"). Firms could also address geopolitical risks by shifting activities back to their home countries ("reshoring") or by sourcing intermediate inputs locally ("localizing supply chains").
Recent work from the International Monetary Fund has identified new patterns of FDI flows among geopolitically aligned countries in strategically sensitive industries (IMF Research Department, 2023; Gopinath et al., 2024; Tan, 2024). However, the evidence on direct investment (DI) fragmentation remains limited, mostly because of data issues.
In this note, I provide early, novel evidence on fragmentation in U.S. outward foreign direct investment and the activities of U.S. multinational enterprises. Outward FDI from the U.S. has shifted away from the destinations of China and Hong Kong and toward Mexico, India and Vietnam, consistent with a realignment of U.S. imports from emerging market economies. Meanwhile, FDI in advanced manufacturing industries has shifted toward Mexico, the United Kingdom, and the largest European countries.
Along with these financial flows, U.S. multinationals have also shifted their expenditures and employment from China to Mexico and India. U.S. multinationals' domestic activities show tentative signs of reshoring and supply chain localization in high-tech industries and advanced manufacturing, but not more broadly.
Data
This analysis draws on two main sources of data from the Bureau of Economic Analysis (BEA). The first is the BEA's data on U.S. direct investment abroad (USDIA), which reports on outward direct investment through financial flows to other countries. The second is BEA's data on the Activities of U.S. Multinational Enterprises (AMNE), which provides details on the production and investment activities of U.S. multinationals, both domestically and in their majority-owned foreign affiliates. Although the USDIA data are timelier, they suffer from a measurement problem induced by investment hubs, whereby direct investments ultimately made in one country (e.g., China) are recorded going to the country of the subsidiary which the investments first pass through (e.g., Hong Kong). The AMNE data, which come from surveys of multinationals and their foreign affiliates and are released with a considerable lag, capture the activities of multinationals in the ultimate destination countries in addition to flows through intermediate countries.
Where is U.S. Outward Direct Investment Going?
While the majority of outward U.S. DI goes to advanced foreign economies (AFEs), flows to emerging market economies (EMEs) are also significant and show signs of geopolitical realignment.
Over the past decade, U.S. outward direct investment has faced repeated shocks that complicate the analysis of DI fragmentation. The Tax Cuts and Jobs Act (TCJA) of 2017 removed the tax penalty on dividends from foreign subsidiaries, inducing U.S. multinationals to pay out accumulated profits from their foreign subsidiaries—mostly in a handful of European and Caribbean tax havens—to their U.S. parent companies. These repatriation flows show up in the U.S. balance of payments data as negative outward DI in 2018 and 2019, especially for Europe and the Caribbean.2 These disruptions were then followed by shocks related to pandemic effects in 2020 and 2021.
To assess potential fragmentation in outbound U.S. direct investment to EMEs, Figure 1 presents the shares of U.S. outbound DI going to countries often mentioned in the fragmentation narrative, with activities supposedly reallocating from potentially "risky" countries like China and Hong Kong toward "connector" countries, alternative destinations for investment and production amid geopolitical fragmentation (Curran et al, 2023). We focus on the 2014-2017 period as the baseline (blue bars) and 2022-2023 as a period of potential fragmentation (black bars). These periods exclude the anomalous flows associated with TJCA-induced repatriations in 2018-2019 and the COVID-19 pandemic in 2020-2021.
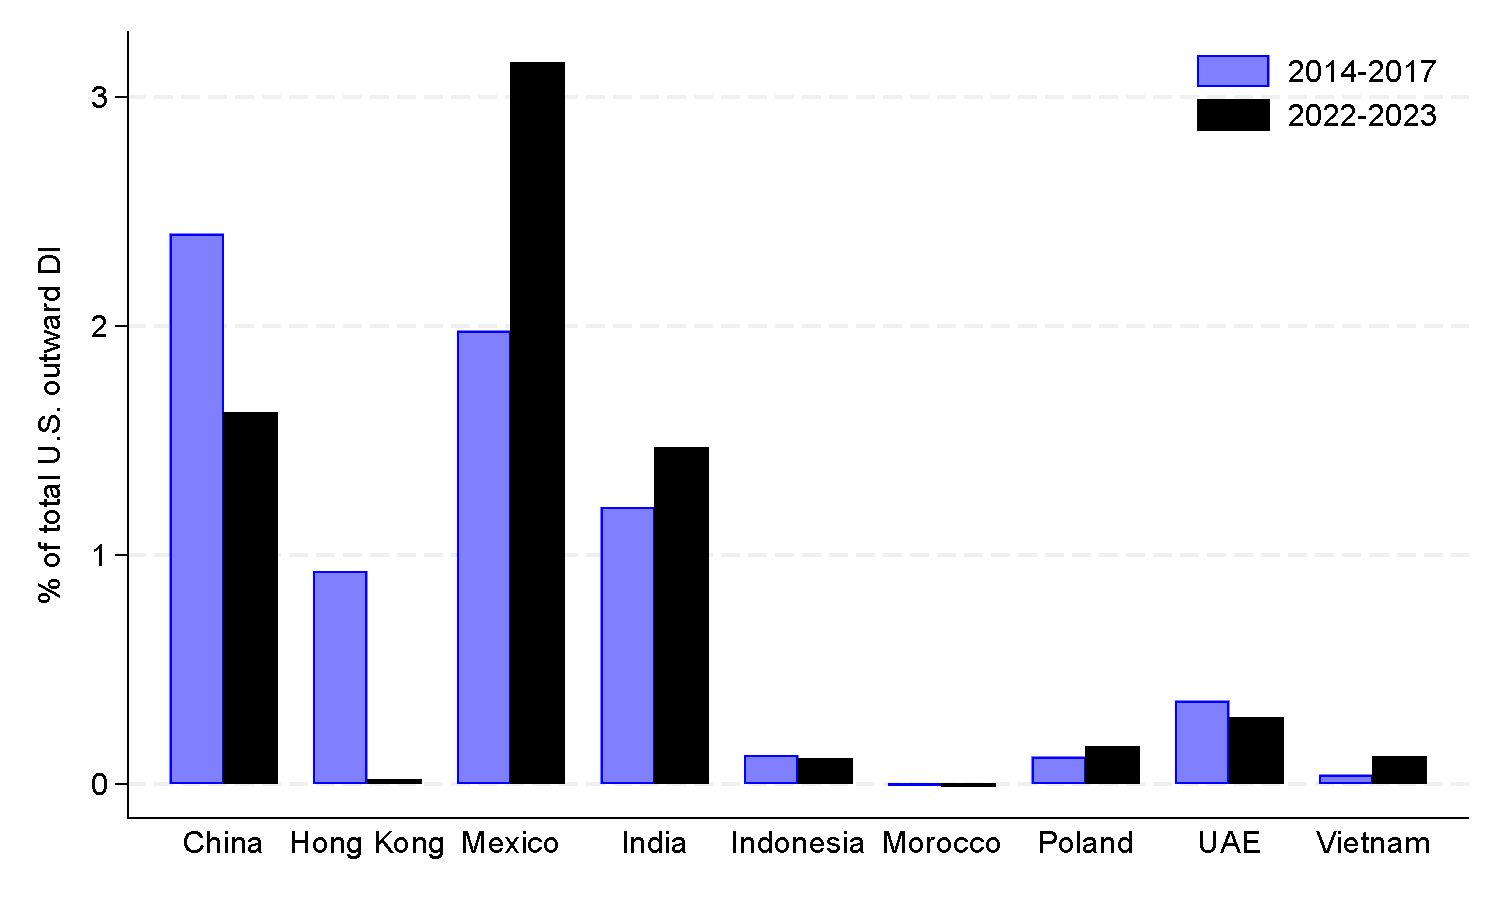
Source: BEA data on U.S. Direct Investment Abroad.
The share of U.S. investment into China decreased, and the share to Hong Kong (often used as an intermediate country for investment into China) has essentially disappeared. By contrast, the shares of U.S. investment going to Mexico and India have increased notably, as has the share going to Vietnam, although the latter remains small. Other countries reported as potential alternative destinations for investment—Indonesia, Morocco, Poland and the United Arab Emirates—show negligible changes in direct investment flows from the U.S.
We observe a similar shift away from China when looking at just U.S. outward FDI related to advanced manufacturing products (including high-tech), shown in Figure 2. The shares of U.S. advanced manufacturing FDI into China and Hong Kong both declined in 2022-23 relative to the baseline period. Meanwhile, the shares going to Mexico, the United Kingdom, and to the largest EU countries increased, consistent with friendshoring and nearshoring in advanced manufacturing. The shares to advanced Asian economies (Japan, South Korea, Singapore, and Taiwan) and to Canada roughly remained at their high levels of the baseline period.
Figure 2. U.S. Outward FDI in Advanced Manufacturing, percent of total U.S. outward advanced manufacturing FDI, annual averages
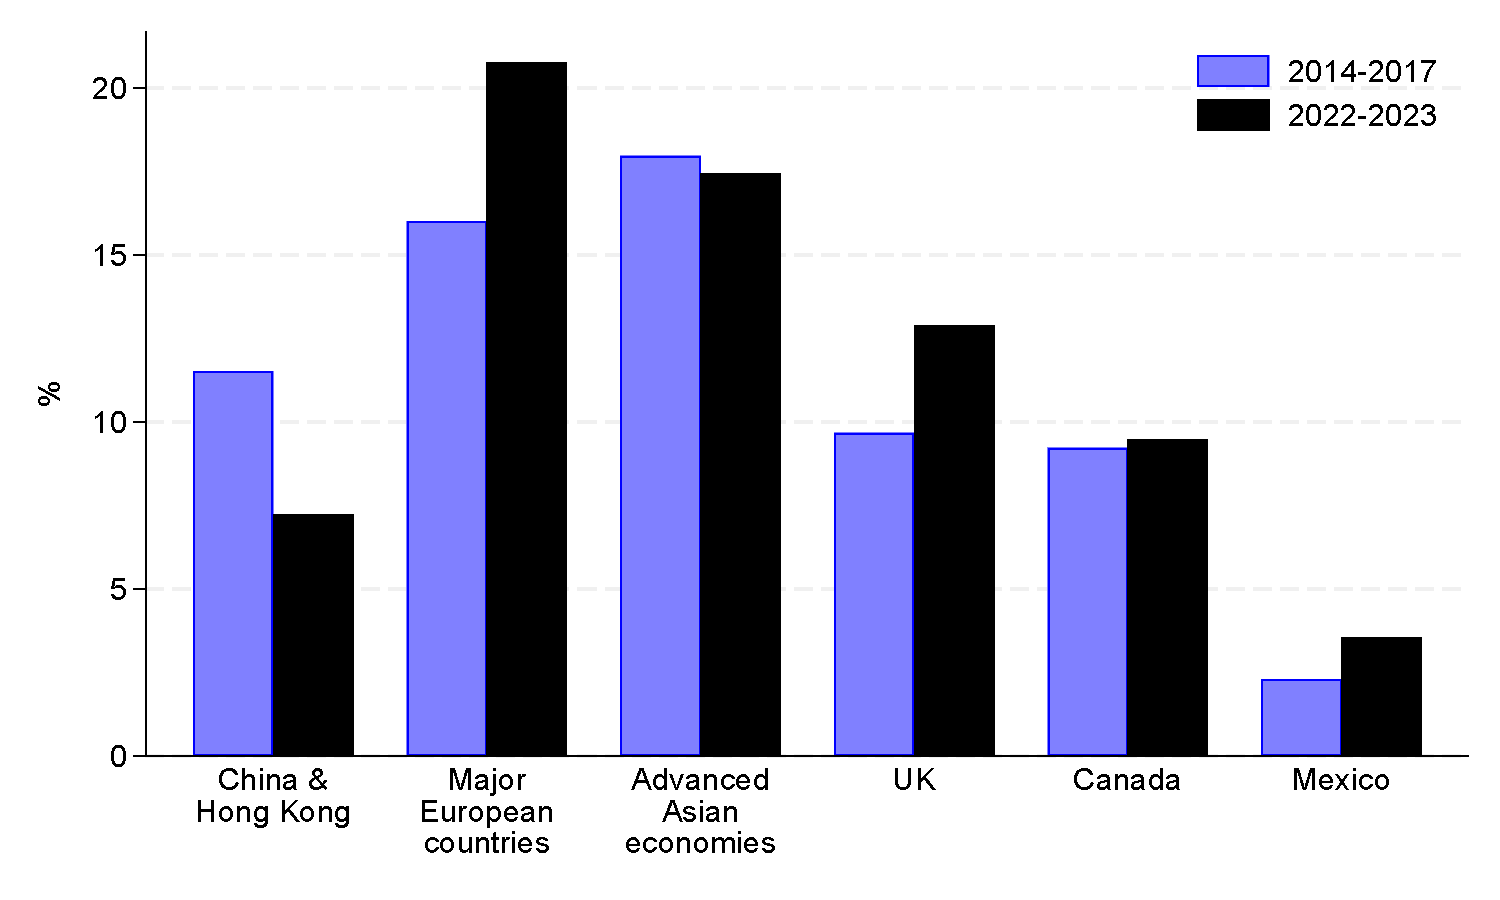
Note: The major European countries used in this graph are Germany, France, Italy, Spain, the Netherlands, Poland, Sweden, Belgium and Austria. The advanced Asian economies are Japan, South Korea, Taiwan and Singapore. Advanced manufacturing is computed by summing the following industries: computer and electronic product manufacturing; electronic equipment, appliance, and component manufacturing; machinery manufacturing; transportation equipment manufacturing; and chemical manufacturing.
Source: BEA data on U.S. Direct Investment Abroad.
Have U.S. multinationals shifted their investment and employment patterns consistent with the realignment of DI flows? Figure 3 presents the shares of capital expenditures and employment by the majority-owned foreign affiliates (MOFAs) of U.S. multinationals in China, compared to the primary connector countries: Mexico and India.
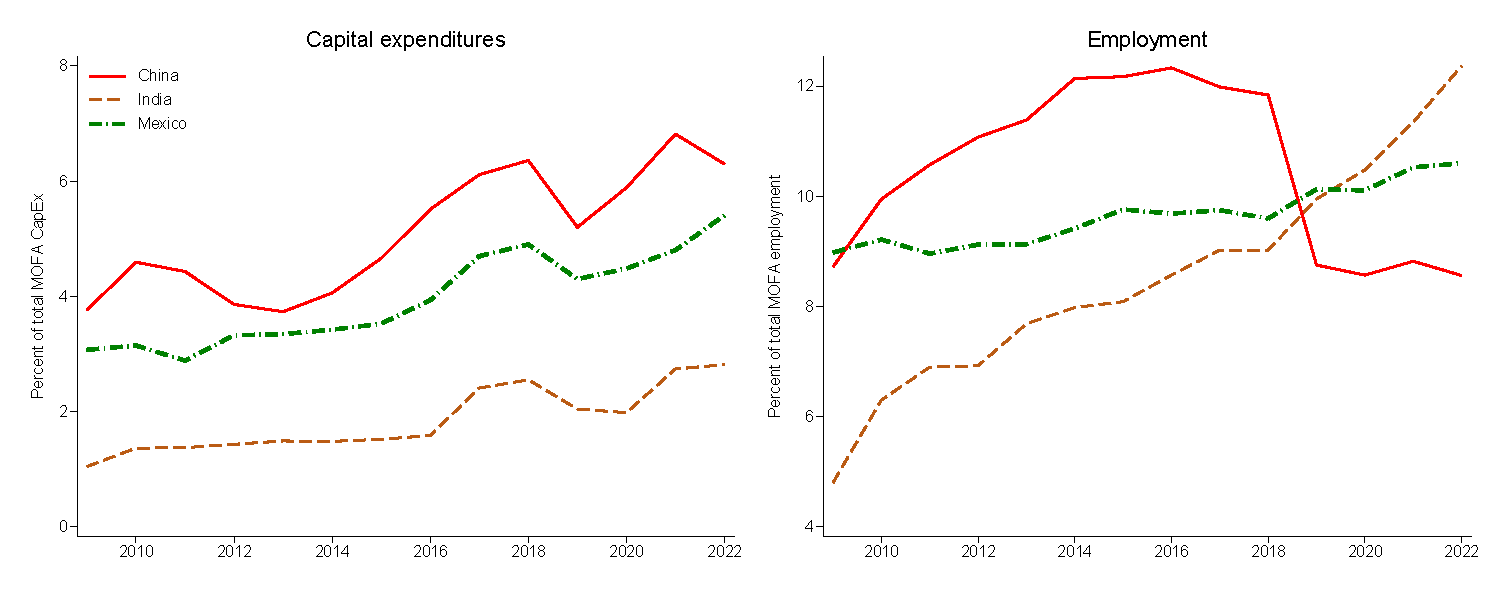
Note: Measures presented are the country-specific percentages of total activities by majority-owned foreign affiliates (MOFAs) of U.S. multinationals.
Source: BEA data on the Activities of U.S. Multinational Enterprises, 2009-2022.
Prior to the U.S.-China tariff increases of 2018-19, capital expenditures by U.S. multinationals in China had been steadily rising (left panel), while employment in China had leveled off (right panel). In 2019, the Chinese shares of capital expenditures and employment by U.S. multinationals dropped sharply. These decreased again in 2022, although less severely, likely due to rising geopolitical tensions after Russia's invasion of Ukraine. Meanwhile, the shares of capital expenditures and employment in India and Mexico have grown more rapidly on average than before 2016, and employment by U.S. multinationals in India has accelerated since 2018. The additional fixed investment and employment in Mexico and India are consistent with nearshoring (Mexico) and friendshoring (India and Mexico).
A potential caveat to the results of FDI shifting away from China comes from mismeasurement induced by investment hubs. U.S. direct investments into China are often routed through subsidiaries in Hong Kong, Singapore, and other intermediate countries, and thus are not counted as U.S.-to-China direct investment. The AMNE data—which are collected at the subsidiary level—are not subject to this mismeasurement problem.
Figure 4 compares official measures of U.S. DI exposure to China with measures for the Chinese subsidiaries of U.S. multinationals. The total assets (red line, left panel) and net equity (orange line, left panel) of Chinese subsidiaries of U.S. multinationals far exceed the official direct investment position of U.S. investors in China (blue line, left panel).3 Nevertheless, these measures exhibit similar patterns over time. U.S. DI exposure to China stagnated after 2016, while MNE balance sheet growth in China slowed after 2015 and decreased in 2022.
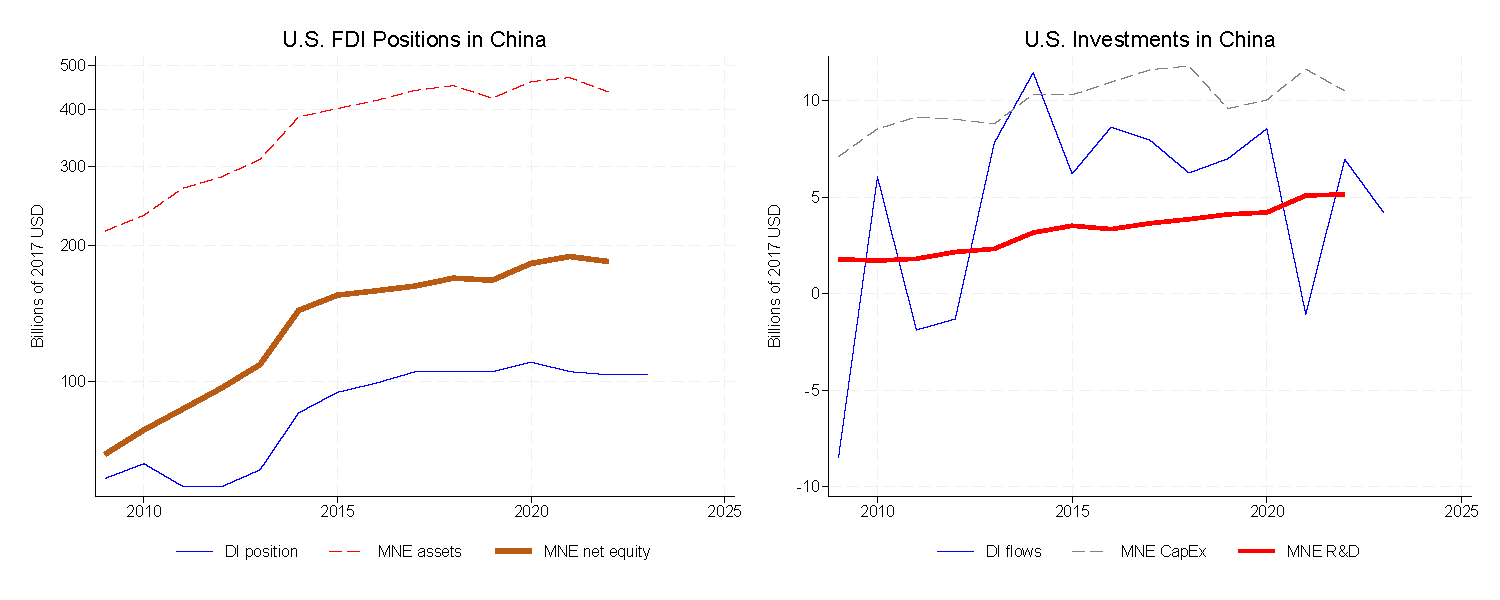
Sources: BEA data on Activities of U.S. Multinational Enterprises, and BEA data on U.S. Direct Investment Abroad. Converted to 2017 dollars using the U.S. GDP deflator.
The right panel compares the financial measure of U.S.-to-China direct investment (blue line) with investment measures of capital expenditures (gray line) and R&D (red line) by U.S. multinationals in China. While direct investment flows from the U.S. to China are volatile and have decreased recently, capital expenditures by U.S. multinationals in China stopped growing around 2018.4 In contrast, R&D by U.S. multinationals in China has been relatively steady and trending upward.
Overall, most of these measures suggest reductions in economic activities by U.S. multinationals in China, consistent with de-risking.
Reshoring and Supply Chain Localization
In principle, reshoring and supply chain localization achieve the goals of both friendshoring and nearshoring. If U.S. multinationals are engaging in reshoring, their domestic investments and production should rise relative to their foreign activities. To visualize this, Figure 5 plots the domestic shares of capital expenditures (left panel) and employment (right panel) by U.S. multinationals, across all industries (black lines), for advanced manufacturing (blue lines), and specifically for high-tech industries (red lines). These trends show little evidence of higher domestic investment and production shares in 2022 by U.S. multinationals overall. However, around 2018, the downward trends in the domestic employment shares for advanced manufacturing and high-tech industries reversed, which could be due to fragmentation or to changes induced by the Tax Cuts and Jobs Act, which also took effect in 2018. Notably, the domestic share of capital expenditures rose for multinationals in high-tech industries in 2021 and 2022, but this could be driven by investment in data centers and AI rather than reshoring.
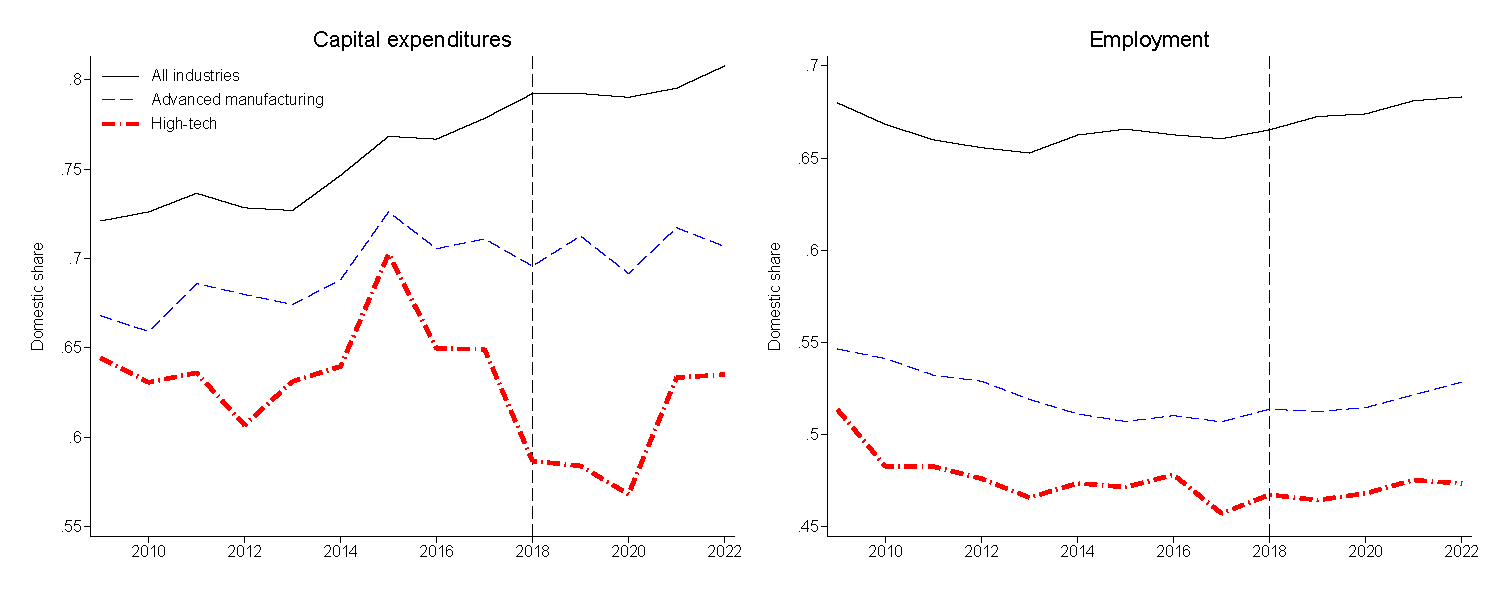
Notes: The share of each variable is computed as the amount reported by the U.S. parent and its domestic subsidiaries (consolidated) divided by itself and the amount reported by majority-owned foreign affiliates. Advanced manufacturing is computed by summing the following manufacturing industries: computer and electronic products; electronic equipment, appliances, and components; machinery; transportation equipment; and chemicals. High-tech is computed by summing: computer and electronic product manufacturing; pharmaceutical and medicine manufacturing; data processing, hosting, and related services; and computer systems design and related services. The vertical line marks 2018, when both trade conflicts and the Tax Cuts and Jobs Act took effect.
Source: BEA data on Activities of U.S. Multinational Enterprises.
Although there is limited evidence of multinationals shifting investment and production back to the U.S., they could instead address geopolitical risks by shifting their sourcing of intermediate inputs toward American suppliers instead of foreign ones, a trade-based analog to reshoring. To quantify this, we can compute the foreign-source share of the intermediate inputs used in their domestic production, defined as the ratio of their goods imports to the difference between sales and value added (Figure 6).5 Across all industries (black line), the share of U.S. multinationals' domestic costs for intermediate inputs attributable to imported goods has been slowly declining since 2013, but levelled out after 2020. The foreign sourcing share in advanced manufacturing does not suggest any consistent changes (blue line). However, in 2019, the foreign-sourcing share of U.S. multinationals' intermediate inputs in computer and electronic product manufacturing decreased notably and has since shown no signs of recovering (red line).
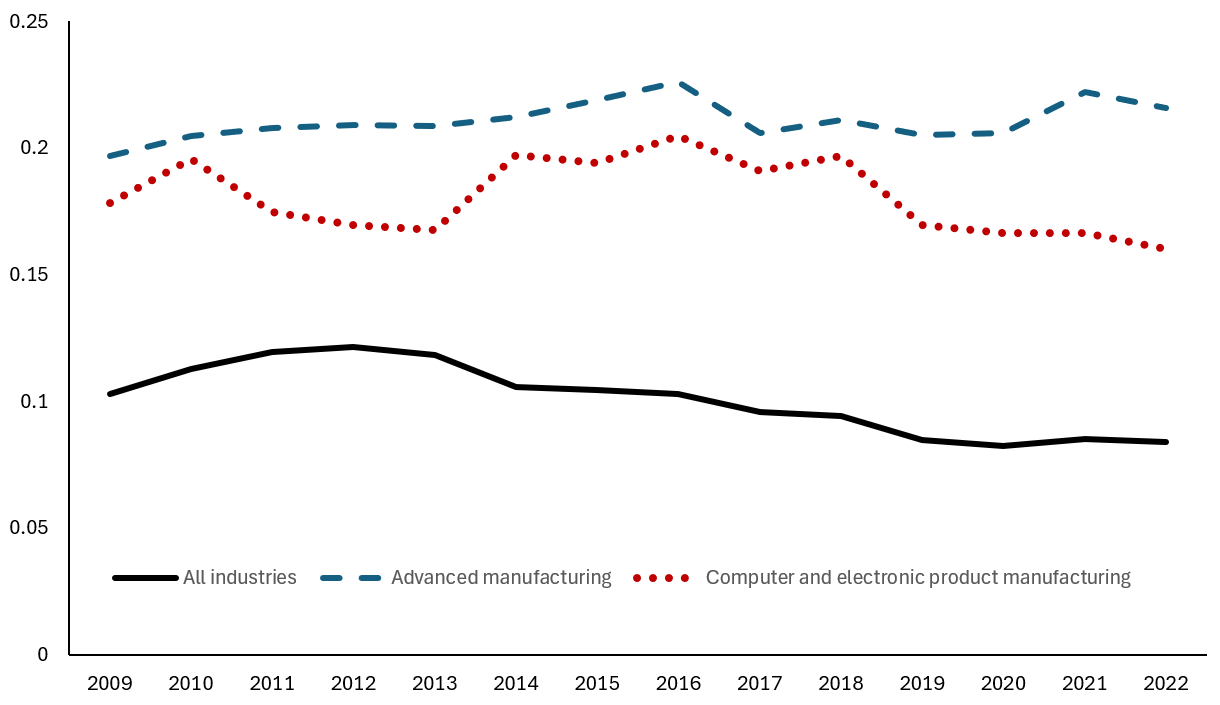
Notes: The share of each variable is computed as the ratio of goods imports by U.S. multinationals and their domestic subsidiaries to their expenditures on intermediate inputs, which are computed as the difference between sales and value added. Advanced manufacturing is computed by summing the following manufacturing industries: computer and electronic products; machinery; transportation equipment; and chemicals. This graph omits electrical equipment, appliance and component manufacturing, for which BEA obscured the data before 2014.
Source: BEA data on Activities of U.S. Multinational Enterprises.
This evidence suggests that as of 2022, U.S. multinationals overall were not shifting toward domestic suppliers of intermediate inputs overall, but there is tentative evidence in support of supply chain localization by multinationals in high-tech industries.
Conclusions
Overall, foreign direct investment flows and the activities of U.S. multinationals show some early evidence of fragmentation through friendshoring and nearshoring. U.S. outward FDI has shifted away from China and Hong Kong and toward Mexico and India, while the advanced manufacturing subcomponent has shifted toward major European countries, the United Kingdom, and Mexico. U.S. multinationals' domestic activities show tentative signs of reshoring and supply chain localization in high-tech industries and advanced manufacturing, but not more broadly.
Geopolitical and trade tensions since 2018 have already begun reshaping foreign direct investment, but these changes may be slow. Geopolitical risks will likely continue to drive further realignments in cross-border capital flows and supply chains.
References
Aiyar, Shekhar, Anna Ilyina, and others (2023). "Geoeconomic Fragmentation and the Future of Multilateralism," International Monetary Fund Staff Discussion Note SDN/2023/001.
Cerdeiro, Diego A., Johannes Eugster, Rui C. Mano, Dirk Muir, and Shanaka J. Peiris (2021). "Sizing Up the Effects of Technological Decoupling," International Monetary Fund Working Paper 21/69.
Curran, Enda, Shawn Donnan, and others (2023). "These Five Countries Are Key Economic 'Connectors' in a Fragmenting World," Bloomberg BusinessWeek, November, https://www.bloomberg.com/news/articles/2023-11-02/vietnam-poland-mexico-morocco-benefit-from-us-china-tensions.
Felbermayr, Gabriel, Hendrik Mahlkow, and Alexander Sandkamp (2023). "Cutting through the value chain: the long-run effects of decoupling the East from the West." Empirica 50, pp. 75–108, https://doi.org/10.1007/s10663-022-09561-w.
Gopinath, Gita, Pierre-Olivier Gourinchas, Andrea F. Presbitero, and Petia Topalova (2024). "Changing Global Linkages: A New Cold War?" Journal of International Economics, vol. 153, https://doi.org/10.1016/j.jinteco.2024.104042.
International Monetary Fund Research Department (2023). "Chapter 4 Geoeconomic Fragmentation and Foreign Direct Investment". In World Economic Outlook, April 2023: A Rocky Recovery. USA: International Monetary Fund.
Javorcik, Beata, Lucas Kitzmüller, Helena Schweiger, and Muhammed Yıldırım (2024). "Economic costs of friendshoring," The World Economy, vol. 47 no. 7, pp. 2871–2908, https://doi.org/10.1111/twec.13555.
Reyes-Heroles, Ricardo, Sharon Traiberman, and Eva Van Leemput (2020). "Emerging Markets and the New Geography of Trade: The Effects of Rising Trade Barriers," IMF Economic Review, vol. 68 no. 3, pp. 456-508, September.
Smolyansky, Michael, Gustavo Suarez, and Alexandra Tabova (2019). "U.S. Corporations' Repatriation of Offshore Profits: Evidence from 2018," FEDS Notes. Washington: Board of Governors of the Federal Reserve System, August 6, 2019.
Tan, Joanne (2024). "How Widespread is FDI Fragmentation?" International Monetary Fund Working Paper 24/179.
Timmer, Marcel, Bart Los, Robert Stehrer, and Gaaitzen Vries (2021). "Supply Chain Fragmentation and the Global Trade Elasticity: A New Accounting Framework," IMF Economic Review, vol 69 no. 4, pp. 656-680, December.
1. Reyes-Heroles, Traiberman & van Leemput (2020); Timmer, Los, Stehrer & Vries (2021); Aiyar (2023); Cerdeiro et al (2021); Felbermayr, Mahlkow & Sandkamp (2023); Javorcik et al (2024). Return to text
2. See Smolyansky, Suarez and Tabova (2019) for more details. Return to text
3. The net equity measure is the difference between book equity and equity assets in related parties. This avoids double-counting due to vertical MNE ownership structures. Return to text
4. The decreases in U.S.-to-China direct investment flows in 2021 and 2023 largely reflect negative debt-financed DI flows. These largely reflect early repayment of loans from related foreign affiliates. FDI from all sources (not just the U.S.) also show negative debt-financed FDI into China recently, attributable to intra-firm carry trades. Return to text
5. BEA computes value added using the income method; in principle, the firm's value added is the gap between gross output (revenue plus inventory investment) and intermediate inputs. Accordingly, we compute intermediate input costs as sales less value added, ignoring inventory changes. The calculation of the foreign share is the ratio of goods imports by U.S. multinationals to intermediate input costs. This calculation excludes imports of services. These data are available by industry, but not by country. Return to text
Kallen, Cody (2025). "How is Geopolitical Fragmentation Reshaping U.S. Foreign Direct Investment?," FEDS Notes. Washington: Board of Governors of the Federal Reserve System, April 10, 2025, https://doi.org/10.17016/2380-7172.3764.
Disclaimer: FEDS Notes are articles in which Board staff offer their own views and present analysis on a range of topics in economics and finance. These articles are shorter and less technically oriented than FEDS Working Papers and IFDP papers.