FEDS Notes
March 03, 2025
How Were Extra SNAP Benefits Spent?
The Supplemental Nutrition Assistance Program (SNAP), formerly known as the Food Stamp Program, is designed to support low-income U.S. households by providing monthly funds for their grocery spending. As of April 2024, more than 41 million Americans were SNAP recipients, which makes SNAP one of the largest aid programs in the U.S.1 During the pandemic, SNAP recipients received emergency allotments that increased their monthly benefits substantially to alleviate pandemic pressures. I use an event study setup on a household spending panel data set to explore the consumption effects of the emergency allotments. I show that emergency allotments increase food-at-home spending considerably as intended, while I observe little to no change in other forms of spending. Notably, the data allow for the computation of the SNAP recipients' Marginal Propensity to Consume (MPC) food out of extra benefits, which I estimate to be around 0.5.
The increase in SNAP benefits during the pandemic
SNAP has broad reach and assists low-income households substantially with their food purchases. Figure 1 shows the monthly number of SNAP participants in Panel A and distributed benefits per household since 2019 in Panel B. The early substantial drop, both in participation and benefits, marks the disruption due to the government shutdown, which caused most of the February 2019 benefits to be distributed early in January 2019.2 Participation in SNAP increased at the beginning of the pandemic—4 million more people enrolled from February to April in 2020—and has remained around the same level since.
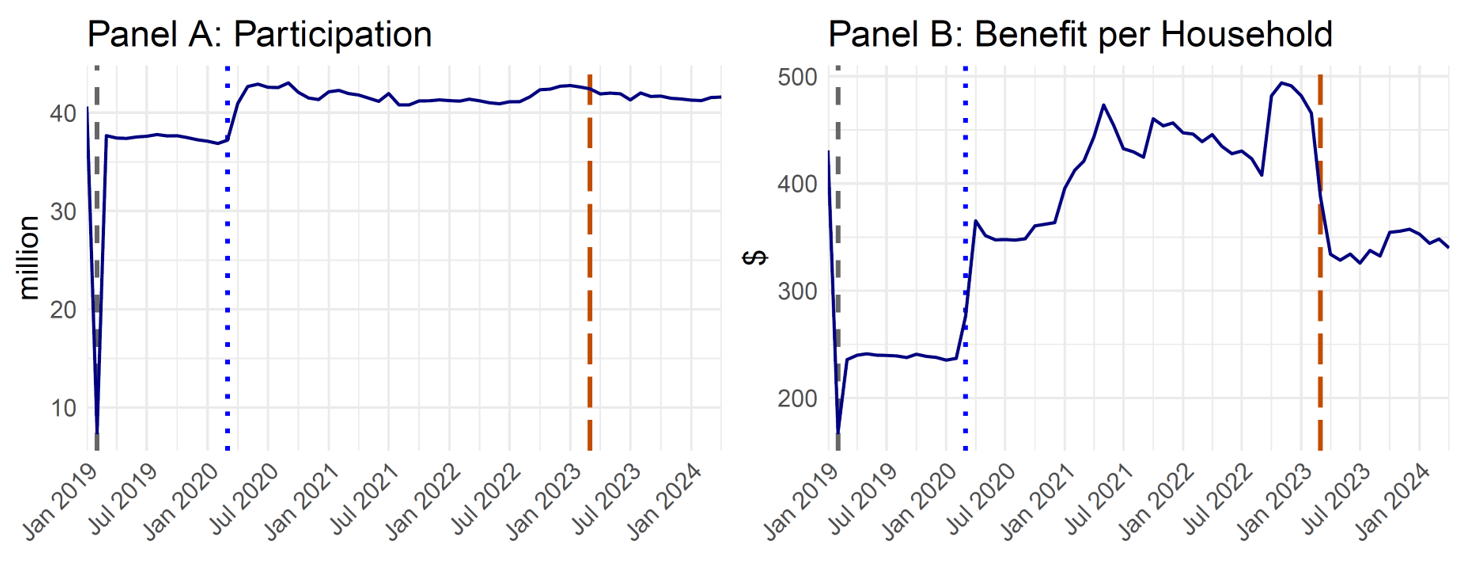
Note: Panel A shows SNAP benefits for participating persons, and panel B shows the benefit amount per household. Data are monthly from January 2019 to April 2024 and not adjusted for inflation. The grey dashed vertical line marks the drop in benefits in February 2019 due to the government shutdown. The blue dotted vertical line marks March 2020 when emergency allotments started. The dark orange long dashed line marks February 2023 when emergency allotments came to an end in all states.
Source: https://www.fns.usda.gov/pd/supplemental-nutrition-assistance-program-snap.
Unlike participation, benefit amount per household in Panel B shows significant changes between 2020 and 2023. Before March 2020, the average SNAP benefit per household was roughly $250 per month. As a result of the Families First Coronavirus Response Act that passed the Congress in March 2020, emergency allotments significantly increased the amount transferred to households every month for food-at-home spending. At first, all SNAP recipients were eligible to get the maximum amount in benefits based on their household size. In early 2021, the policy was revised and emergency allotments were set to a minimum of $95 per month, with some households receiving up to an additional $250 per month depending on their household size. The revised policy increased the distributed benefits even more during 2021 and 2022.
All states distributed emergency allotments starting in March 2020, but that came to a staggered end, with 18 states terminating the emergency allotments over the course of 2021 and 2022. The remaining 32 states and three U.S. territories continued distributing emergency allotments until February 2023.3
Spending data of SNAP recipients
The panel data I use is provided by Numerator, a consumer data company. Numerator collects data at the household level using consumers' paper and digital receipts.4 Numerator has a panel of static users—which contains 150,000 households and is representative of the U.S. population—whose transactions are continuous and complete for at least 12 months. The data set also provides detailed survey information on static users such as zip code; household income bin; and household size, age, education, employment status, race and ethnicity. Hacioglu-Hoke, Feler, and Chylak (2024) provide more details about the data.
SNAP benefits are cash-like funds that are loaded onto Electronic Benefits Transfer cards.5 The Numerator data set specifies if a static panelist uses their benefit card to pay for at least a part of their grocery shopping. This 'SNAP flag' allows me to identify SNAP recipients in the data set. I limit my analysis to panelists who were SNAP recipients during the full emergency allotment period from March 2020 to February 2023 and live in the 32 states and three U.S. territories that distributed emergency allotments during this period. I calculate each user's monthly food-at-home spending using Numerator's product level information.
In support of the hypothesis that SNAP recipients spend more on food as a result of emergency allotments, Figure 2 shows the share of trips to buy groceries that involved purchases using SNAP benefits in Panel A and spending on groceries per SNAP trip in Panel B in Numerator data. The number of grocery trips that involved benefits spending jump to 6 percent of the total trips for groceries, from around 3 percent, within a few months after emergency allotments were introduced. Spending per SNAP trip also went up around the same time. While average spending per trip before March 2020 is around $25, the average hovers around $35 in the post-pandemic period.
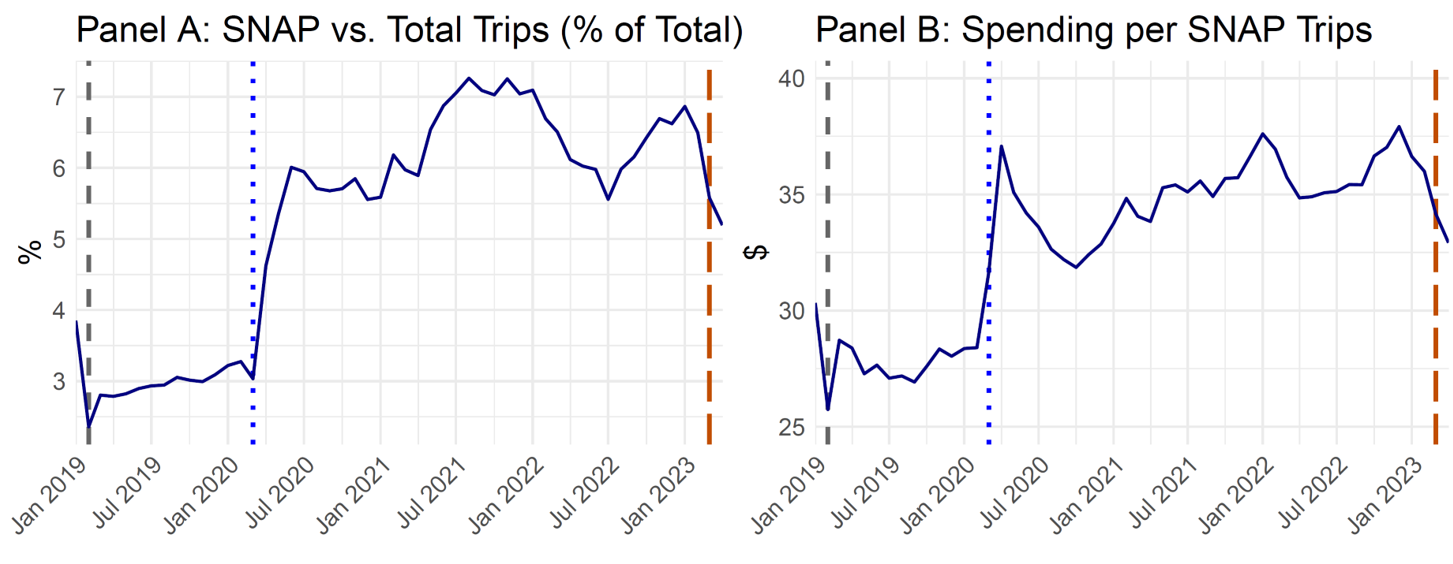
Note: Panel A shows monthly benefits trips as a share of total trips. Panel B shows spending per benefit trip. Data are monthly from January 2019 to April 2023 and are not adjusted for inflation. The grey dashed vertical line marks the drop in benefits in February 2019 due to the government shutdown. The blue dotted vertical line marks March 2020 when emergency allotments started. The dark orange long dashed line marks February 2023 emergency allotments came to an end in all states. Note that the aggregated benefits trips and spending data also contain trips that only involve WIC benefits, which is the SNAP program for Women, Infants, and Children. I do not use `WIC-only' trips in my final data set, as `WIC-only' trips are very rare in the data.
Source: Numerator. Some aggregated data can be found at https://www.numerator.com/snap-trip-tracker/
The change in SNAP recipients' food-at-home spending
I use an event study approach to gauge the effect of emergency allotments on food-at-home spending. Figure 3 shows the change in SNAP recipients' food-at-home spending before and after March 2020. Although food-at-home spending by SNAP recipients was broadly the same before March 2020, there was a significant rise in spending as emergency allotments started. As emergency allotments were designed to help with the pandemic pressures on households, they worked as intended and supported SNAP recipients' expenses with spending on food increasing by $150, on average, over the period of March 2020 and February 2023.
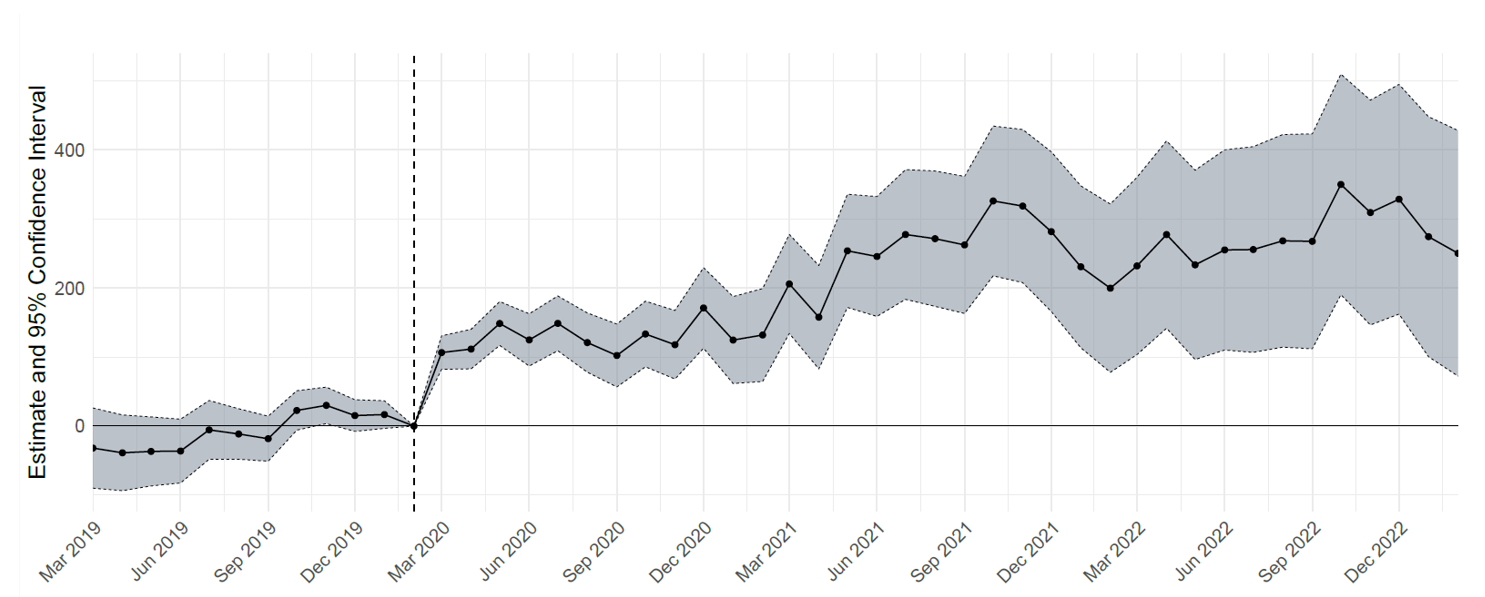
Note: The line with the circles represents the coefficients from a regression of food-at-home spending on a vector of lead and lagged indicators for the month relative to the start of emergency allotments, with February 2020 normalized to 0. The coefficients represent dollar values. The dashed vertical line indicates the start of emergency allotments in March 2020. The shaded area represents the 95% confidence interval. Standard errors are clustered by household. Each regression includes household fixed effects; the calendar month and state interaction term; as well as fixed effects for age, income bin, employment status, household size, education group, marital status, children between the ages of 0-5, 6-12 and 13-17, gender, and ethnicity.
Source: Author's calculations.
Hastings and Shapiro (2018) calculate the MPC out of SNAP benefits as 0.5 to 0.6. Although it is not possible to observe the benefits received by each household in the data, the change in food-at-home spending estimates in Figure 3 combined with the benefit per household information in Panel B of Figure 1 can give us an average MPC. A simple ratio of the change in spending to benefits per household at each time period starting from March 2020 to February 2023 leads to an average MPC of 0.51 and the median MPC of 0.53.6
While SNAP's main purpose is to support food consumption, it also aims at increasing the nutritional value of food-at-home baskets. The item level categorization in the data set allows the analysis of what SNAP recipients spend the additional SNAP benefits on. In unreported results, I examine 24 food categories and find that the top three categories seeing a relative spending increase among SNAP recipients are meat products, fresh produce, and frozen products. That is, beyond simply supporting the extensive margin of food-at-home spending, SNAP emergency allotments also serve households in the intensive margin by providing funds to allocate for healthier products as well as products they can store longer.
Comparing SNAP recipients' spending with an eligible non-SNAP recipient control group's
Although the Numerator data set does not contain information on how much SNAP recipients receive in benefits, a $150 increase in average spending over and above what recipients might receive in core SNAP benefits is substantial. But a potential concern about this result is that it reflects broader macroeconomic developments during the pandemic era, including fluctuations in wage and price growth, and fiscal stimulus and other aid programs such as enhanced child tax credits, that may be affecting households that are eligible for SNAP. I rule out this explanation by constructing treatment and control groups in a difference-in-differences set up.
In this exercise, the SNAP recipients are the treatment group. Given the detail of household level information in Numerator data, I find a group of panelists who do not receive SNAP benefits, but they would be eligible to do so based on their income and household size.7,8 This group serves as the control group so I can compare the consumption patterns of SNAP recipients who benefit from extra SNAP benefits with individuals who are not SNAP recipients but have similar characteristics.
Figure 4 shows the difference in food-at-home spending of SNAP recipients and the control group. Until March 2020, there is no statistically significant difference between the spending of these groups, which rules out pre-trends in the data before the emergency allotments started. In the earlier months of the pandemic, SNAP recipients' spending was not significantly different than the SNAP eligible non-recipients. Over the course of 2020 and 2021, however, SNAP recipients' food-at-home spending increased steadily and, on average, SNAP recipients spent $100 more on food than the control group.
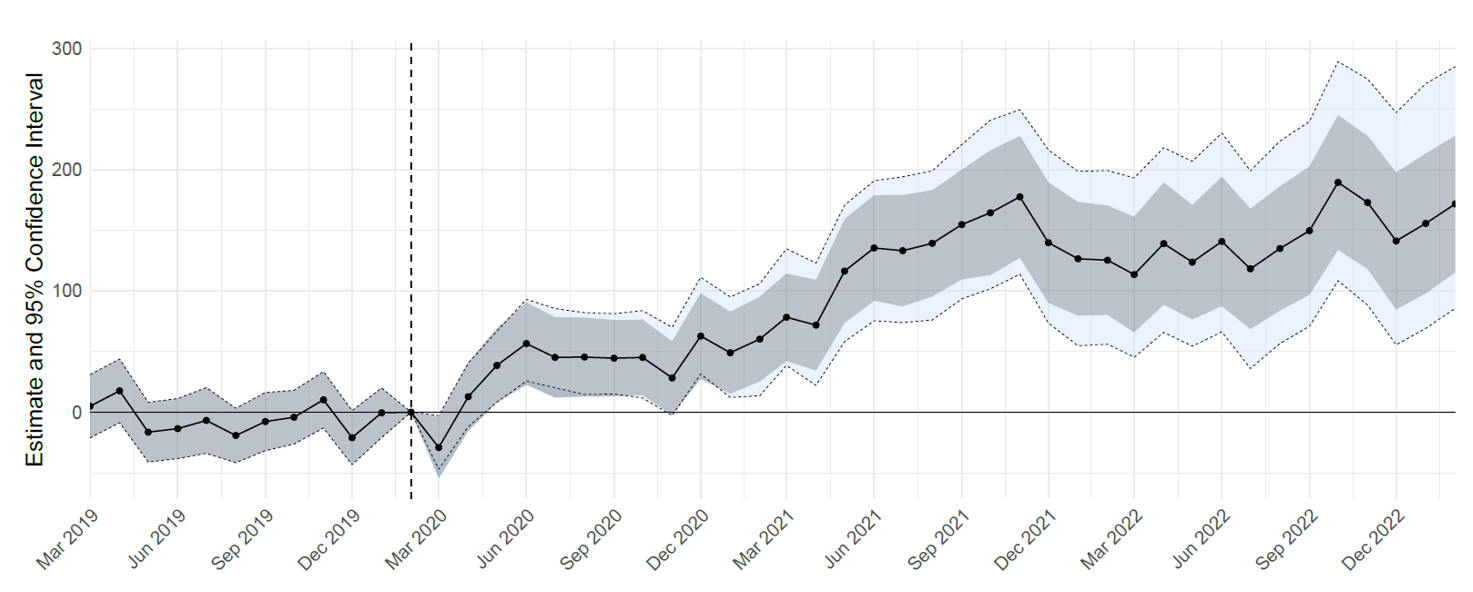
Note: The line with circles represents the coefficients from a difference-in-differences regression of food-at-home spending on a vector of lead and lagged indicators, which are 1 when SNAP recipients start receiving emergency allotments, zero otherwise, with February 2020 normalized to 0. The coefficients represent dollar values. The dashed vertical line indicates the start of emergency allotments in March 2020. The dark shades represent the 95% confidence interval. The lighter shades indicate the 95% confidence intervals estimated using Rambachan and Roth (2023)'s (https://doi.org/10.1093/restud/rdad018) method for the post-treatment period, showing the confidence interval of coefficients if the difference between SNAP and non-SNAP recipients' consumption remained linear even if the parallel trends assumption was violated. Standard errors are clustered by household. Each regression includes household fixed effects; the calendar month and state interaction term; as well as fixed effects for age, income bin, employment status, household size, education group, marital status, children between the ages of 0-5, 6-12 and 13-17, gender, and ethnicity.
Source: Author's calculations.
Finally, I observe little to no change in other forms of spending, in contrast to Kim (2016), which studied a 2009 SNAP policy change. I reach this conclusion by using the extensive data on where purchases take place and the classifications of the items purchased. Using this information, I construct measures of spending, for example, in restaurants, on clothing, or on health and beauty products, among many other spending types such as grocery expenses on SNAP ineligible item such as alcohol and tobacco, and household products. Although SNAP recipients spend more on food than the amount they receive in benefits9 and extra benefits would, in theory, free up funds for other types of spending, I do not find such evidence. This observation is consistent with the Hastings and Shapiro (2018) finding that SNAP recipients do not treat SNAP benefits as fungible as other income. Overall, the results reported in this note are in line with and complementary to Hastings and Shapiro (2018) on how SNAP benefits are spent using the change in SNAP benefits during the pandemic as an empirical laboratory, which is flagged by Schanzenbach (2023) as a gap in our understanding.
References
Gray, Colin, Adam Leive, Elena Prager, Kelsey Pukelis, and Mary Zaki (2023). "Employed in a SNAP? The Impact of Work Requirements on Program Participation and Labor Supply," American Economic Journal: Economic Policy, vol. 15 (1), pp. 306–41.
Hacıoğlu Hoke, Sinem, Leo Feler, and Jack Chylak (2024). "A Better Way of Understanding the US Consumer: Decomposing Retail Sales by Household Income," FEDS Notes. Washington: Board of Governors of the Federal Reserve System, October 11, https://doi.org/10.17016/2380-7172.3611.
Hastings, Justine, and Jesse M. Shapiro (2018). "How Are SNAP Benefits Spent? Evidence from a Retail Panel," American Economic Review, vol. 108 (12), pp.3493–540.
Kim, Jiyoon (2016). "Do SNAP Participants Expand Non-food Spending When They Receive More SNAP Benefits? Evidence from the 2009 SNAP Benefits Increase." Food Policy, vol. 65, pp. 9–20.
Rambachan, Ashesh, and Jonathan Roth (2023). "A More Credible Approach to Parallel Trends." The Review of Economic Studies, vol. 90 (5), pp. 2555–591.
Schanzenbach, Diane (2023). "Understanding SNAP: An Overview of Recent Research," Food Policy, vol. 114.
* The analysis and conclusions set forth are those of the authors and do not indicate concurrence by other members of the research staff or the Board of Governors of the Federal Reserve System. The use of commercially provided data here is for research purposes only and does not imply endorsement, recommendation, or favoring of any brand, product, service, or company by the Board of Governors or the Federal Reserve System. Return to text
1. Source: https://www.fns.usda.gov/pd/supplemental-nutrition-assistance-program-snap. Return to text
2. For more information, see https://www.cbpp.org/research/food-assistance/many-snap-households-will-experience-long-gap-between-monthly-benefits-even#:~:text=The%20Department%20of%20Agriculture%20(USDA,the%20shutdown%20was%20not%20resolved. Return to text
3. The Families First Coronavirus Response Act, signed into law in March 2020, enabled all states to distribute emergency allotments. In December 2022, the Consolidated Appropriations Act was signed into law, which terminated emergency allotments after the issuance of February 2023 benefits in all remaining states. States that ended the policy earlier, over the course of 2021 and 2022, include Idaho, North Dakota, Arkansas, Florida, Montana, Nebraska, South Dakota, Missouri, Mississippi, Tennessee, Iowa, Arizona, Kentucky, Wyoming, Georgia, Indiana, and Alaska. Emergency allotments expired in the remaining 32 states, Guam, Virgin Islands, and the District of Columbia in February 2023. These states account for 85 percent of the SNAP recipients. See USDA, Food and Nutrition Service (2024), "Characteristics of SNAP Households - FY 22," webpage. Return to text
4. There are a few different ways Numerator collects data. First, consumers scan paper receipts using a mobile app. Numerator then transcribes these paper receipts into digital format. Second, consumers can link their email accounts with Numerator and allow for the scrapping of their emails for digital receipts. Third, consumers can link their membership and loyalty accounts with the app, which gives Numerator access to their current and past purchases. Panelists receive rewards for allowing their transactions to be collected by Numerator, and they can redeem these rewards for cash or gift cards. With these different methods of collecting data, the data set contains information on the quantity and price of each item, the total cost of the entire basket, and where and when transactions took place. Return to text
5. SNAP recipients can use these funds to purchase groceries in participating retailers, the list of which is comprehensive and covers almost all big retailers and general merchandise stores that operate across the nation. Almost all basic grocery items are SNAP eligible: Staples such as fruits and vegetables; meat, poultry or fish; dairy products; breads and cereals as well as snack foods and non-alcoholic beverages, and accessory foods such as condiments. Pre-made hot meals, alcohol, and tobacco are not SNAP eligible and are excluded from the analysis. Return to text
6. Note that unused SNAP benefits do not immediately expire, instead they roll over to the next month and, in general, expire after nine months. Return to text
7. Why would there be individuals that are eligible for SNAP benefits based on their income and household size but do not enroll to receive them? First, SNAP eligibility depends on employment. Although there are exceptions such as age, disability, or caring responsibilities, those who do not satisfy the work requirement cannot get SNAP benefits. Gray et al. (2023) investigate the effect of employment on SNAP participation and find evidence of work requirements increasing exists from the program. Second, only U.S. citizens and certain lawfully present non-citizens are eligible for SNAP benefits. Third, SNAP eligibility depends on assets held. In other words, individuals' incomes might make them eligible for SNAP benefits, but if they hold assets above a certain threshold, that might invalidate their eligibility. Fourth, some U.S. states limit the eligibility of those that fail drug tests and those with prior criminal offenses. Last, there is anecdotal evidence that some individuals do not apply as either they are put off by the stigma of using SNAP benefits or they think the process is too cumbersome or they need help with the application process. For more information see, https://www.census.gov/library/stories/2021/02/demographic-snapshot-not-everyone-eligible-for-food-assistance-program-receives-benefits.html and https://www.axios.com/2024/08/21/snap-gap-food-stamps. Return to text
8. On the construction of the control group: According to the federal rule, individuals can be eligible for SNAP benefits if their gross income is below 130 percent of the poverty line. USDA defines income levels and household sizes associated with these income levels for SNAP eligibility. Using Numerator income buckets and individuals' household size, I filter the static users who are not SNAP recipients and decide whether they would be SNAP-eligible based on the following criteria: Panelists are in the control group if their income is less than $20,000 and their household size is one; their income is between $20,000 and $29,999 and their household size is two; and their income is between $30,000 and $39,999 and their household size is three. Although SNAP eligibility goes beyond the income levels of $40,000 and households can be larger than three, I remained cautious when constructing the control group. Moreover, in the fiscal year of 2022, 58 percent of SNAP recipients were single person households and the average SNAP household was reported to be 1.9 people; see https://www.fns.usda.gov/research/snap/characteristics-fy22. It is therefore expected that limiting the analysis to income levels below $40,000 and household size below four captures most SNAP eligible panelists. Note that these income levels are reported for SNAP eligibility by the USDA for 2024, https://www.fns.usda.gov/snap/recipient/eligibility. Return to text
9. USDA states that SNAP recipients are expected to use 30 percent of their own resources for food expenses. Return to text
Hacıoğlu Hoke, Sinem (2025). "How Were Extra SNAP Benefits Spent?," FEDS Notes. Washington: Board of Governors of the Federal Reserve System, March 03, 2025, https://doi.org/10.17016/2380-7172.3655.
Disclaimer: FEDS Notes are articles in which Board staff offer their own views and present analysis on a range of topics in economics and finance. These articles are shorter and less technically oriented than FEDS Working Papers and IFDP papers.