FEDS Notes
September 02, 2020
Index of Common Inflation Expectations
Data that are potentially informative about the inflation expectations of economic agents have grown over recent years and now include information from a wide variety of surveys as well as from financial instruments. These data differ along several key dimensions, including the type of economic agent, the horizon of the expectation, the source of data (survey versus market-based measures), and the associated inflation concept, which can make the co-movement of various expectations measures difficult to discern. In this note, we use a dynamic factor model to construct an index of common inflation expectations from a wide variety of measures.
The baseline index that we construct suggests that inflation expectations were relatively stable between 1999 and 2012, experienced a downward level shift between 2012 and 2016, and have since fluctuated around that lower level. In recent months, this measure has fallen somewhat, likely influenced by recent sharp declines in oil prices, although it does not yet appear to suggest a de-anchoring of inflation expectations to the downside.
1. Measures of inflation expectations
Our index is constructed using 21 inflation expectation indicators, summarized in table 1. We include expectations derived from households, firms, professional forecasters, and financial market participants.2 We include both "short horizon" inflation expectations, which are typically forecasts for the year ahead, and "long horizon" inflation expectations, which are typically forecasts made for some period over the subsequent 5 to 10 years. Finally, some indicators that we include are denominated in terms of a specific inflation measure—like the consumer price index (CPI) or the personal consumption expenditures (PCE) price index—while others are described only in general terms such as "the change in prices."3
Ideally, including such a variety of indicators will produce an index that will respond to broad changes in inflation expectations across the entire economy. At the same time, the different characteristics of the indicators may create challenges for the interpretation of our index, as we will discuss.
Table 1: List of inflation expectation indicators
| Relevant inflation concept | Forecast horizon | |
|---|---|---|
| Blue Chip survey | Consumer price index (CPI) | 1 year ahead; long horizon (7 to 11 years ahead) |
| Conference Board survey | Prices in general | 1 year ahead |
| Consensus Economics | CPI | 6 to 10 years ahead |
| TIPS | CPI | 5 years; 10 years; 10-year, 10-year forward; 5-year, 5-year forward |
| Livingston | CPI | 1 year ahead; 10 years ahead |
| Michigan survey | Prices in general | Next 12 months; next 5 to 10 years |
| Michigan survey (25, 75 percentile) | Prices in general | Next 5 to 10 years |
| Survey of Professional Forecasters (SPF) | CPI | 1 year ahead; 6 to 10 years ahead; next 10 years |
| Personal consumption expenditures (PCE) price index | 1 year ahead; 6 to 10 years ahead; next 10 years | |
| Core PCE price index | 1 year ahead |
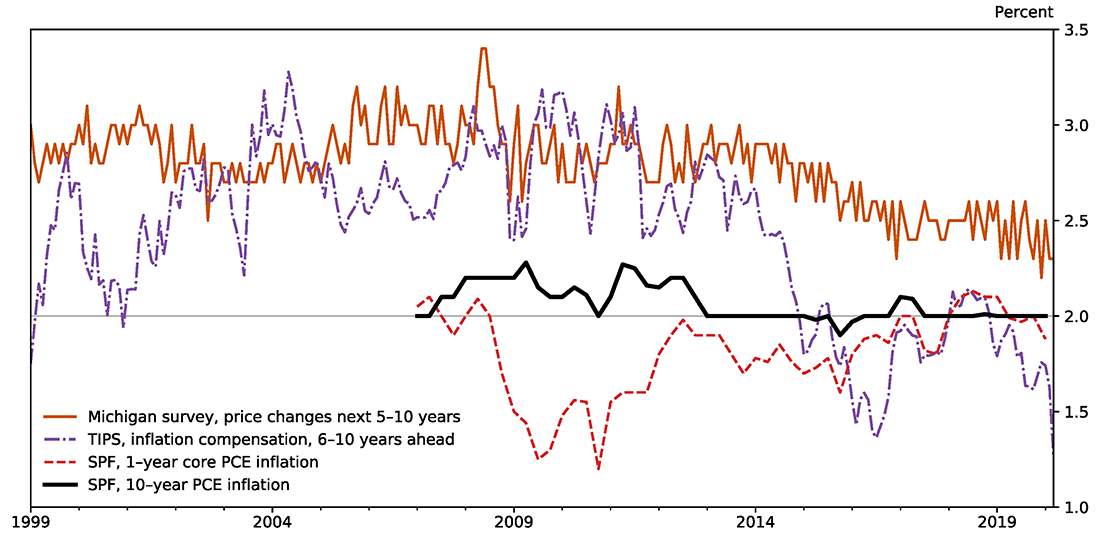
To give a sense of the overall trends and cross-sectional dispersion represented in our sample, table 2 reports pairwise correlations for a subset of inflation indicators, over the period 1999:Q1 to 2020:Q1, and figure 1 plots the time series of several of the most important indicators. These summaries highlight several important facts. First, there is good evidence of interrelationship between the various indicators, as exhibited in the large magnitudes and statistical significance of many of the pairwise correlations. At the same time, there are also important differences between these indicators.
Table 2: Pairwise correlations between selected inflation expectation indicators
| SPF (10y PCE) | SPF (10y CPI) | TIPS Breakeven (5-10y CPI) | Blue Chip (7-11y CPI) | Michigan (5-10y 75th pct) | Michigan (5-10y Prices) | Michigan (1y Prices) | Blue Chip (1y CPI) | SPF (1y Core PCE) | |
|---|---|---|---|---|---|---|---|---|---|
| SPF (10y PCE) | 1 | ||||||||
| SPF (10y CPI) | 0.82 | 1 | |||||||
| TIPS Breakeven (5-10y CPI) | 0.63 | 0.62 | 1 | ||||||
| Blue Chip (7-11y CPI) | 0.62 | 0.70 | 0.31 | 1 | |||||
| Michigan (5-10y 75th pct) | 0.57 | 0.60 | 0.72 | 0.48 | 1 | ||||
| Michigan (5-10y Prices) | 0.51 | 0.60 | 0.66 | 0.46 | 0.94 | 1 | |||
| Michigan (1y Prices) | 0.46 | 0.17 | 0.41 | -0.17 | 0.48 | 0.59 | 1 | ||
| Blue Chip (1y CPI) | -0.17 | 0.34 | -0.19 | 0.33 | 0.08 | 0.23 | 0.10 | 1 | |
| SPF (1y Core PCE) | -0.26 | -0.12 | -0.41 | -0.49 | -0.40 | -0.22 | 0.17 | 0.65 | 1 |
Source: Federal Reserve Board; University of Michigan Surveys of Consumers; Federal Reserve Bank of Philadelphia; Wolters Kluwer Legal and Regulatory Solutions U.S., Blue Chip Economic Indicators.

Source: Federal Reserve Board; University of Michigan Surveys of Consumers; Federal Reserve Bank of Philadelphia.
The clearest differences exist between the short- and long-horizon indicators. Table 2 shows that short-horizon measures exhibit less correlation with other measures overall and in many cases are negatively correlated with long-horizon measures. Figure 1 illustrates this, showing that the short-horizon Survey of Professional Forecasters (SPF) measure of core PCE, which increased over the past decade, has a much different path than any of the three long-horizon measures in the graph.
It is also evident that there exist meaningful differences even between indicators that are of the same horizon and are highly correlated. For example, while the SPF, Michigan, and TIPS-based measures in figure 1 all exhibit declines over the past decade, their dynamics are quite different. The SPF measure falls quickly in 2012 and then remains essentially flat at 2 percent thereafter. By contrast, the other two long-term measures begin to trend downward only in 2014. Moreover, although the Michigan measure exhibits a slow and protracted decline, the TIPS-based measure falls dramatically, in line with a fall in oil prices, before rebounding. Finally, the behavior of the long-horizon TIPS-based measure in recent years is in line with the short-horizon SPF measure, while in the early part of the sample its behavior showed more similarities to the long-horizon Michigan measure.
2. The Econometric method
We estimate a dynamic factor model to construct an index of common inflation expectations that represents co-movements among the 21 inflation expectation indicators from 1999:Q1 to 2020:Q1. Loosely speaking, one can think of the unobserved factor as the weighted average of the 21 indicators with weights positively related to the share of the variation of an indicator that is correlated with the others. Thus, indicators that tend to move with the other indicators receive a high weight. We assume that the data can be efficiently summarized by one factor, and that the dynamics of this latent factor is characterized by a stationary AR(4) process. The usual procedure of estimating a dynamic factor model is to use standardized data.4 As a result, this procedure will give us factor estimates whose mean is zero. Therefore, the level of the estimated factor will not have an economic interpretation. The direction of its variations, however, can inform us about the direction of pervasive changes in inflation expectations. We can then interpret these changes in terms of a given inflation expectation indicator by "projecting" the factor onto that series.5
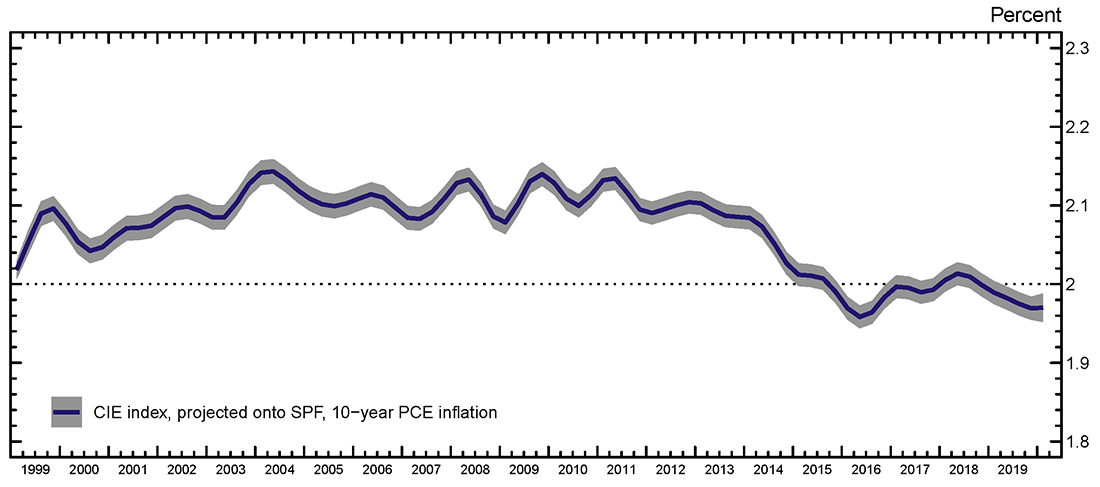
Here we focus on using the estimated factor to study changes in long-run inflation expectations. We are particularly interested in using the common inflation expectation index to monitor the evolution of long-run inflation expectations, since they are those directly anchored by monetary policy and less sensitive to transitory factors such as oil price movements and extreme events such as 9/11. Hence we decided to project the common factor extracted from the model onto the SPF's 10-year-ahead PCE inflation expectation. We choose the SPF's 10-year-ahead PCE inflation expectation as our baseline indicator of long-run inflation expectations, because we think professional forecasters' inflation expectations might be more accurate than those of households. We refer to these values of the dynamic factor projected onto the SPF 10-year measure as the "index of common inflation expectations," or the CIE index. This index is plotted in figure 2.
Figure 2. Estimated index of common inflation expectations (projected onto SPF 10-year-ahead PCE inflation expectations)

Source: Staff calculations.
Note: The shaded area denotes 95% confidence intervals.
3. Estimated index of common inflation expectations
The CIE index suggests that inflation expectations were relatively stable through 2012, experienced a downward level shift between 2012 and 2016, and have since fluctuated around that lower level. In terms of the level given by the projection onto the SPF's 10-year-ahead PCE inflation expectation, the CIE stayed at around 2.1 percent until 2012, then stepped down to a level that is a little lower than 2.0 percent and has generally stayed at the lower level in the past few years. This downward shift potentially coincides with a number of influential economic events, including changes in the stance of monetary policy across a number of economies and large fluctuations in oil prices.6 While the index slightly edged up to 2 percent in 2018, it has since declined below the low point observed in 2016, likely following the recent sharp declines in oil prices.7 Altogether, despite a notable decline earlier this decade, the evidence provided by this index does not yet appear to indicate de-anchoring of inflation expectations to the downside in the past few years.
One might wonder which indicators are most informative for the inference of common inflation expectations.8 The variables that play key roles in the variation of common inflation expectations are those representing long-run inflation expectations, in particular (1) inflation compensation with long-run inflation expectation from TIPS (5-year; 10-year; 10-year, 10-year forward), (2) inflation expectation over the next 5 to 10 years from Michigan survey, and (3) Livingston's 10-year-ahead inflation expectation.9
4. Looking ahead
Overall, the CIE index captures the general trajectory of many of the long-horizon inflation expectation indicators well. This result is a more formal reflection of the interrelationships already suggested in the basic summary evaluation discussed earlier. However, as it is derived from a single factor, it cannot capture all relevant features of the data as discussed in section 1.
More specifically, short-horizon inflation expectation indicators tend to exhibit a different trend over this sample from long-horizon indicators. The current model with one factor does not capture these differences in the dynamics between long- and short-horizon inflation expectations.
Relatedly, even among the various long-horizon indicators that decline over the sample period, the timing and the pattern of decline were different, which allows the possibility that an economic event might have an effect on some series but not on others. In this case, the prediction of future co-movement based on the model with one factor might be less reliable. Therefore, additional factors can be considered in the model to characterize the co-movement of various inflation expectation indicators more comprehensively in future work.
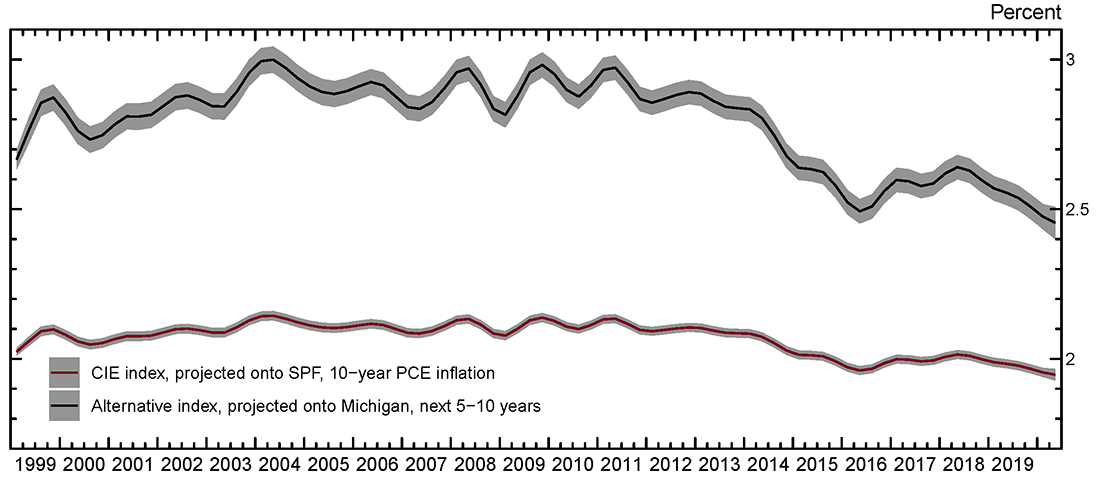
In addition, as noted earlier, the level of the index is determined by the mean of the indicator used to interpret the underlying factor. If we use the long-run inflation expectations from the Michigan survey as the indicator, the level and the overall size of variation of this alternative index become different from those of the baseline one. As shown in figure 3, the alternative index ends at 2.5 percent, while the baseline CIE index ends the sample slightly below 2 percent. Considering that observed indicators capture different concepts of inflation that may have different long-run levels, the CIE does not provide information on the level of underlying inflation expectations or trend inflation. In spite of this limitation, the CIE index can be useful for better inference on the evolution of trend inflation or underlying inflation expectations.
Figure 3. Indexes of common inflation expectations projected onto SPF 10-year-ahead PCE inflation expectations and University of Michigan inflation expectations of the next 5 to 10 years

Source: Staff calculations.
Note: The shaded area denotes 95% confidence intervals.
References
Bańbura, Marta, and Michele Modugno (2014). "Maximum Likelihood Estimation of Factor Models on Datasets with Arbitrary Pattern of Missing Data," Journal of Applied Econometrics, vol. 29 (January), pp. 133–160.
Coibion, Olivier, and Yuriy Gorodnichenko (2015). "Is the Phillips Curve Alive and Well after All? Inflation Expectations and the Missing Disinflation," American Economic Journal: Macroeconomics, vol. 7 (January), pp. 197–232.
1. We thank Gianni Amisano, Andrew Figura, Norm Morin, Jeremy Rudd, and John Stevens for their guidance and advice on this project. Michael Kister provided excellent research assistance. Return to text
2. High-quality and long-running surveys capturing the inflation expectations of a large cross section of firms do not exist for the United States, but several of our survey measures—such as the Blue Chip consensus forecast—do include respondents from large firms. Return to text
3. We do not include model-based estimates of inflation expectations (e.g., Cleveland Fed's estimate of inflation expectations) in our analysis, as these measures are likely to be estimated from data already contained in our model. Return to text
4. We used the method developed by Bańbura and Modugno (2014) for the estimation of the factor. Return to text
5. The projection procedure is multiplying the factor by the standard deviation of the series of choice and adding its mean. Return to text
6. Around this time, the FOMC announced an explicit inflation target, the ECB adopted quantitative easing policies, and both the ECB and Bank of Japan implemented negative policy rates. Return to text
7. Coibion and Gorodnichenko (2015) argue that the decline of oil prices might have lowered inflation expectations. Return to text
8. The estimated parameters of the dynamic factor model (especially the so-called "factor loadings") can be used to assess the correlation between each series and the common component. Return to text
9. Consistent with this finding, a relatively high share of their overall variances of these series is attributable to the variance of the common factor. Likewise, the Kalman gains, which indicate how much the estimate of a factor is revised in response to surprising changes in a series, also suggest that these series are more informative than others in estimating the factor. Return to text
Ahn, Hie Joo, and Chad Fulton (2020). "Index of Common Inflation Expectations," FEDS Notes. Washington: Board of Governors of the Federal Reserve System, September 02, 2020, https://doi.org/10.17016/2380-7172.2551.
Disclaimer: FEDS Notes are articles in which Board staff offer their own views and present analysis on a range of topics in economics and finance. These articles are shorter and less technically oriented than FEDS Working Papers and IFDP papers.